LendingTree Reveals the Cities with the Highest Share of Vacation, Investment and Second Homes

The housing market is characterized by a lack of inventory for both new and existing homes. In the existing market, there is a shortage of current owners willing to sell, a problem that could be exacerbated by rising interest rates. Rising rates create a “lock-in” effect where current owners are dissuaded from selling and moving as their new home would be at a higher rate. In the new market, homebuilders are facing rising prices for inputs and labor, which are eroding their profit margins. This is particularly acute for lower-priced homes that are not being built fast enough.
In this environment, every unit of inventory makes a difference for homebuyers. Our study looks at the share of mortgages made for non-owner occupied properties to gauge their impact on inventory. Non-owner occupied properties are either vacation homes, investment properties or second homes. Many such properties are often bought for cash, however, which means our mortgage focused-study likely understates the effect on the market.
It also seems logical to surmise that buyers getting a property for anything other than their primary residence might have stronger financial resources than the average buyer of an owner-occupied residence. For the 50 cities we looked at, non-owner occupied average income was $163,000 compared to $117,000 for owner occupied. Thus, such buyers may be in a position to pay a higher price. In economic parlance, non-occupant buyers could crowd out homebuyers, making a market more competitive and pricier.
Our data below ranks the top 50 cities by the share of non-owner occupied loans based on the recently released HMDA data for 2017. We also look at the average loan amounts for the two groups to see if there are any insights there.
Key findings
- There is a clear regional break. Cities with the most non-owner occupied properties were located in the South or the West while those with the least are in Northeast and Midwest.
- Southern cities may be attracting investors due to low prices and growing populations. Many residents in Southern cities may not be able to access home ownership due to lower median salaries, creating a ready pool of renters.
- In the West, the opportunity for rapid price appreciation is likely attracting investors. But high prices also suppress homeownership, creating a pool of renters.
- In the Northeast and Midwest, affordable homes mean the opportunity to be a homeowner is high and less appreciation attracts less investors.
- The homeownership rate in the top 10 cities is an average 59% compared with just 67% in the bottom 10. Even Detroit, a city often cited as having a challenging housing market, has a homeownership rate above all the top ten cities.
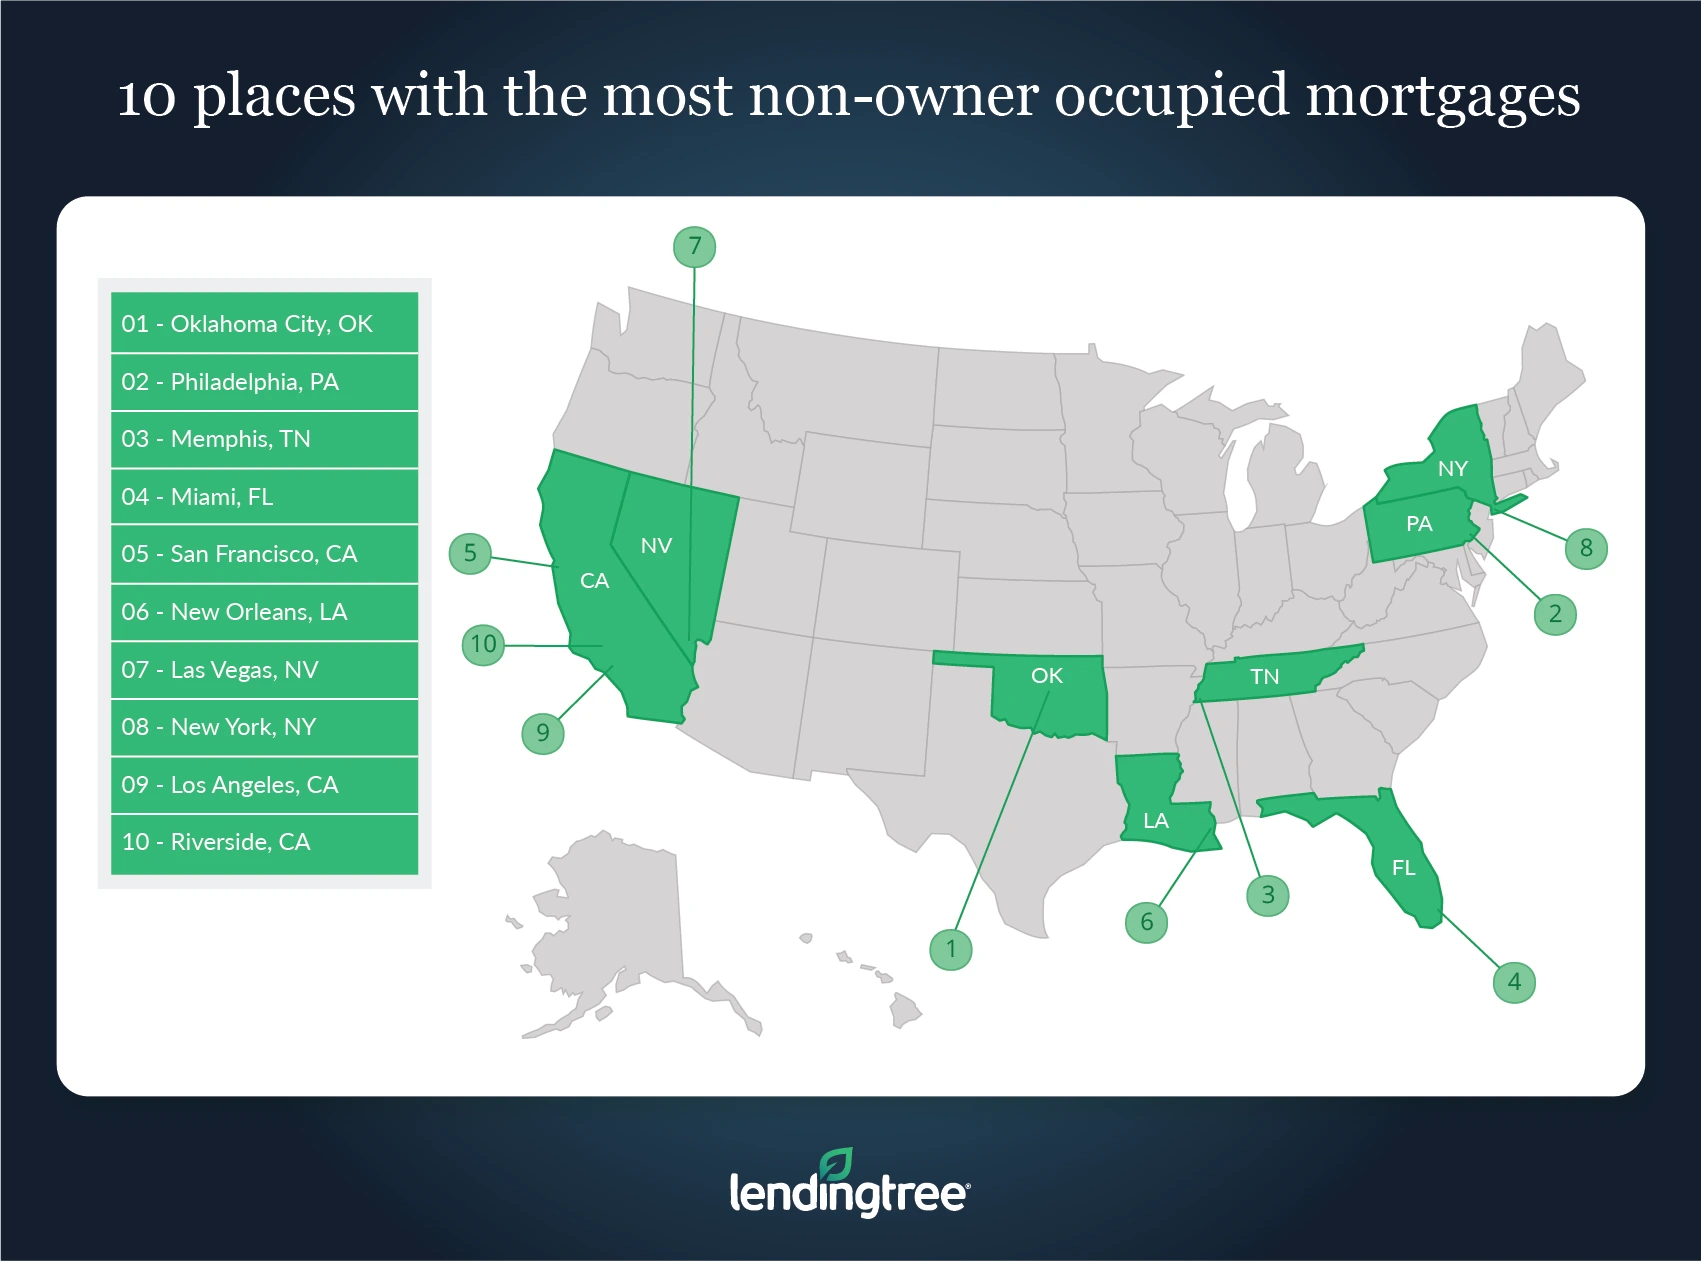
Cities with most non-owner-occupied mortgages
No. 1: Oklahoma City
- Share of non-owner-occupied mortgages: 15.4%
- Non-owner-occupied average loan size: $193,000
- Owner-occupied average loan size: $182,000
No. 2: Philadelphia
- Share of non-owner-occupied mortgages: 14.6%
- Non-owner-occupied average loan size: $245,000
- Owner-occupied average loan size: $225,000
No. 3: Memphis, Tenn
- Share of non-owner-occupied mortgages: 14.6%
- Non-owner-occupied average loan size: $126,000
- Owner-occupied average loan size: $192,000
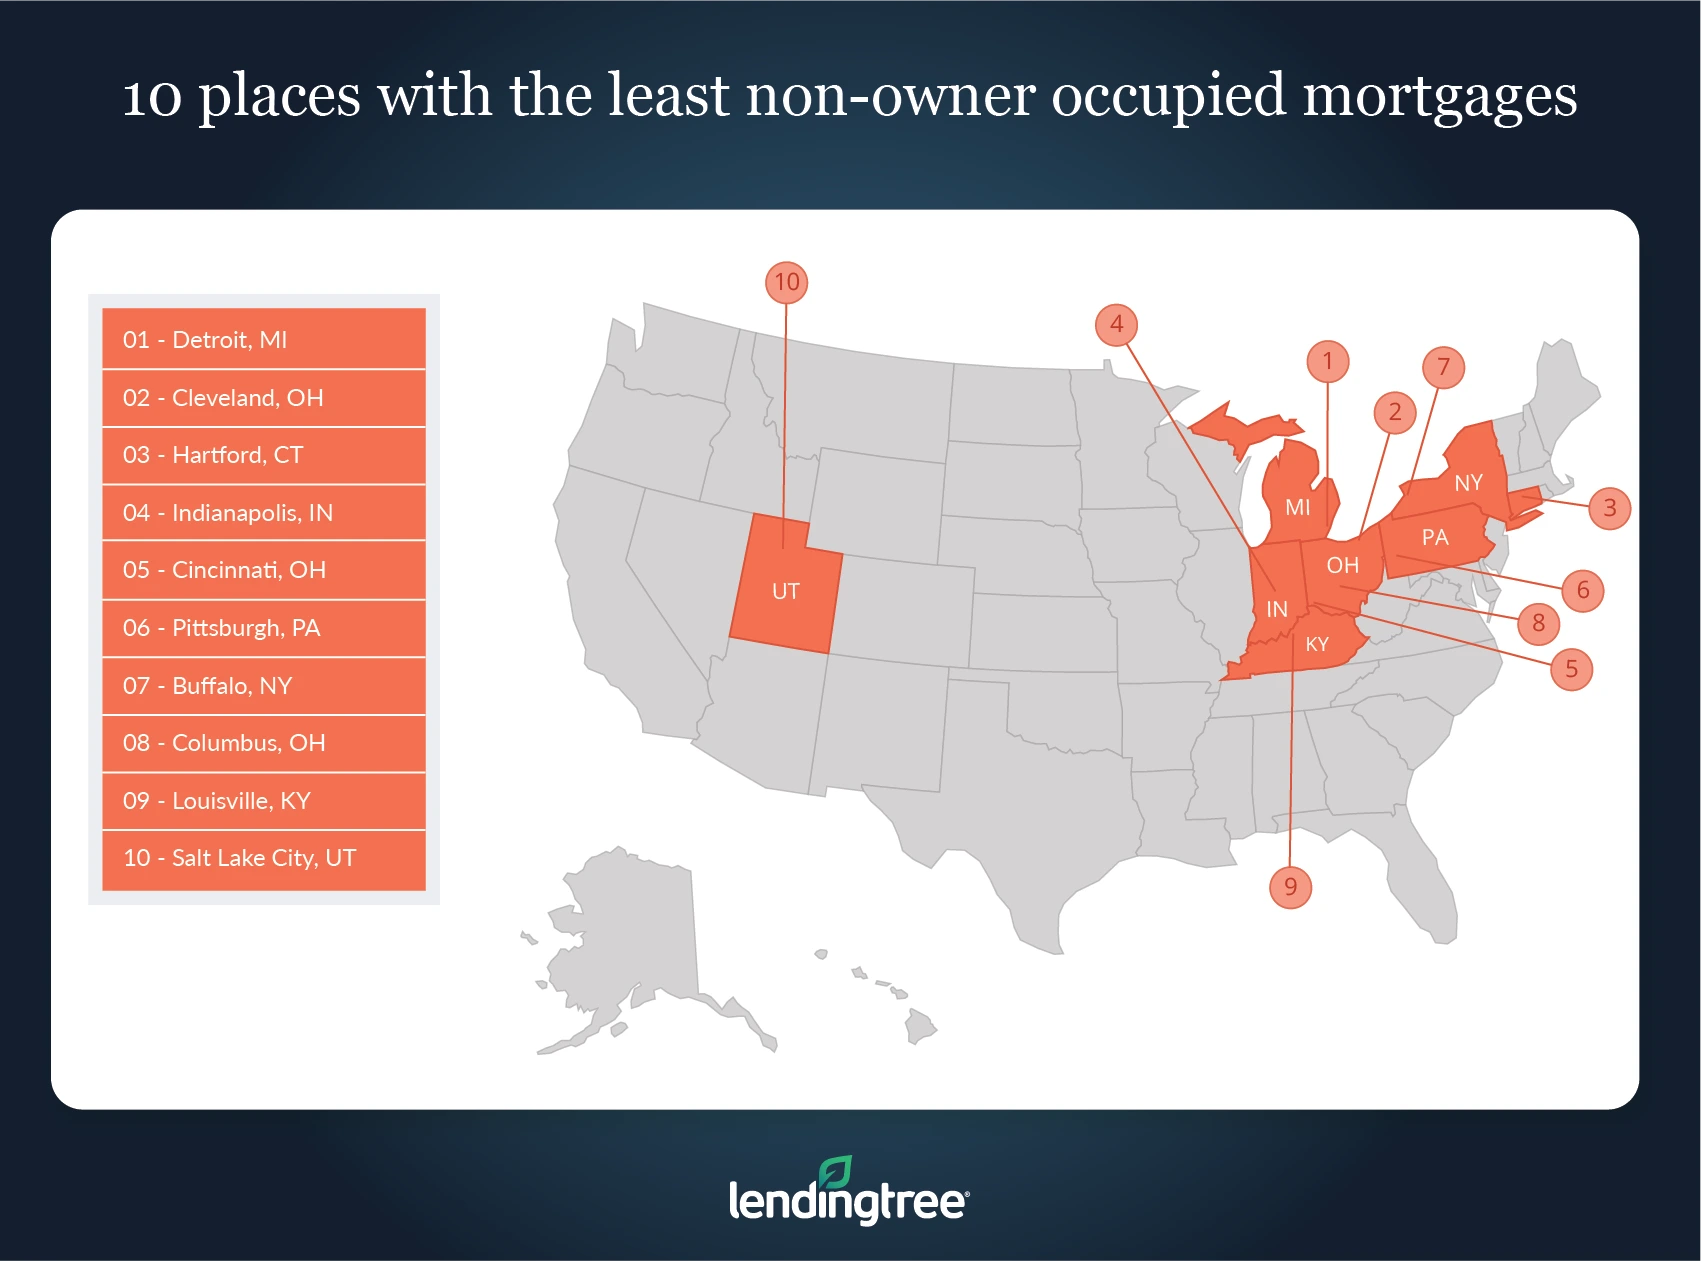
Cities with the least non-owner-occupied mortgages
No. 48: Hartford, Conn.
- Share of non-owner-occupied mortgages: 5.9%
- Non-owner-occupied average loan size: $237,000
- Owner-occupied average loan size: $215,000
No. 49: Cleveland
- Share of non-owner-occupied mortgages: 5.7%
- Non-owner-occupied average loan size: $124,000
- Owner-occupied average loan size: $167,000
No. 50: Detroit
- Share of non-owner-occupied mortgages: 5.2%
- Non-owner-occupied average loan size: $115,000
- Owner-occupied average loan size: $163,000
View mortgage loan offers from up to 5 lenders in minutes