Housing Market’s 10-Year Challenge — Comparing Housing Market of 2009 to Today
When the real estate bubble burst in late 2008, many Americans saw their home values fall drastically, but a lot has changed in the 10 years since — housing prices have rebounded from their lows during the Great Recession. And though prices are now starting to cool, in many cases, home values have even exceeded their 2006 highs.
That being said, not every market has fully recovered. A new study from LendingTree, the nation’s leading online loan marketplace, looks at the 50 largest metropolitan areas in the U.S. to see where housing prices have recovered the most since the height of the Great Recession — and where values are still struggling. The study also looks at how income and unemployment rates have changed since 2009.
Key findings
- On average, median home values have increased by nearly $50,000 across the 50 largest metros in the United States since 2009. Increasing incomes and falling unemployment rates have likely fueled this increase.
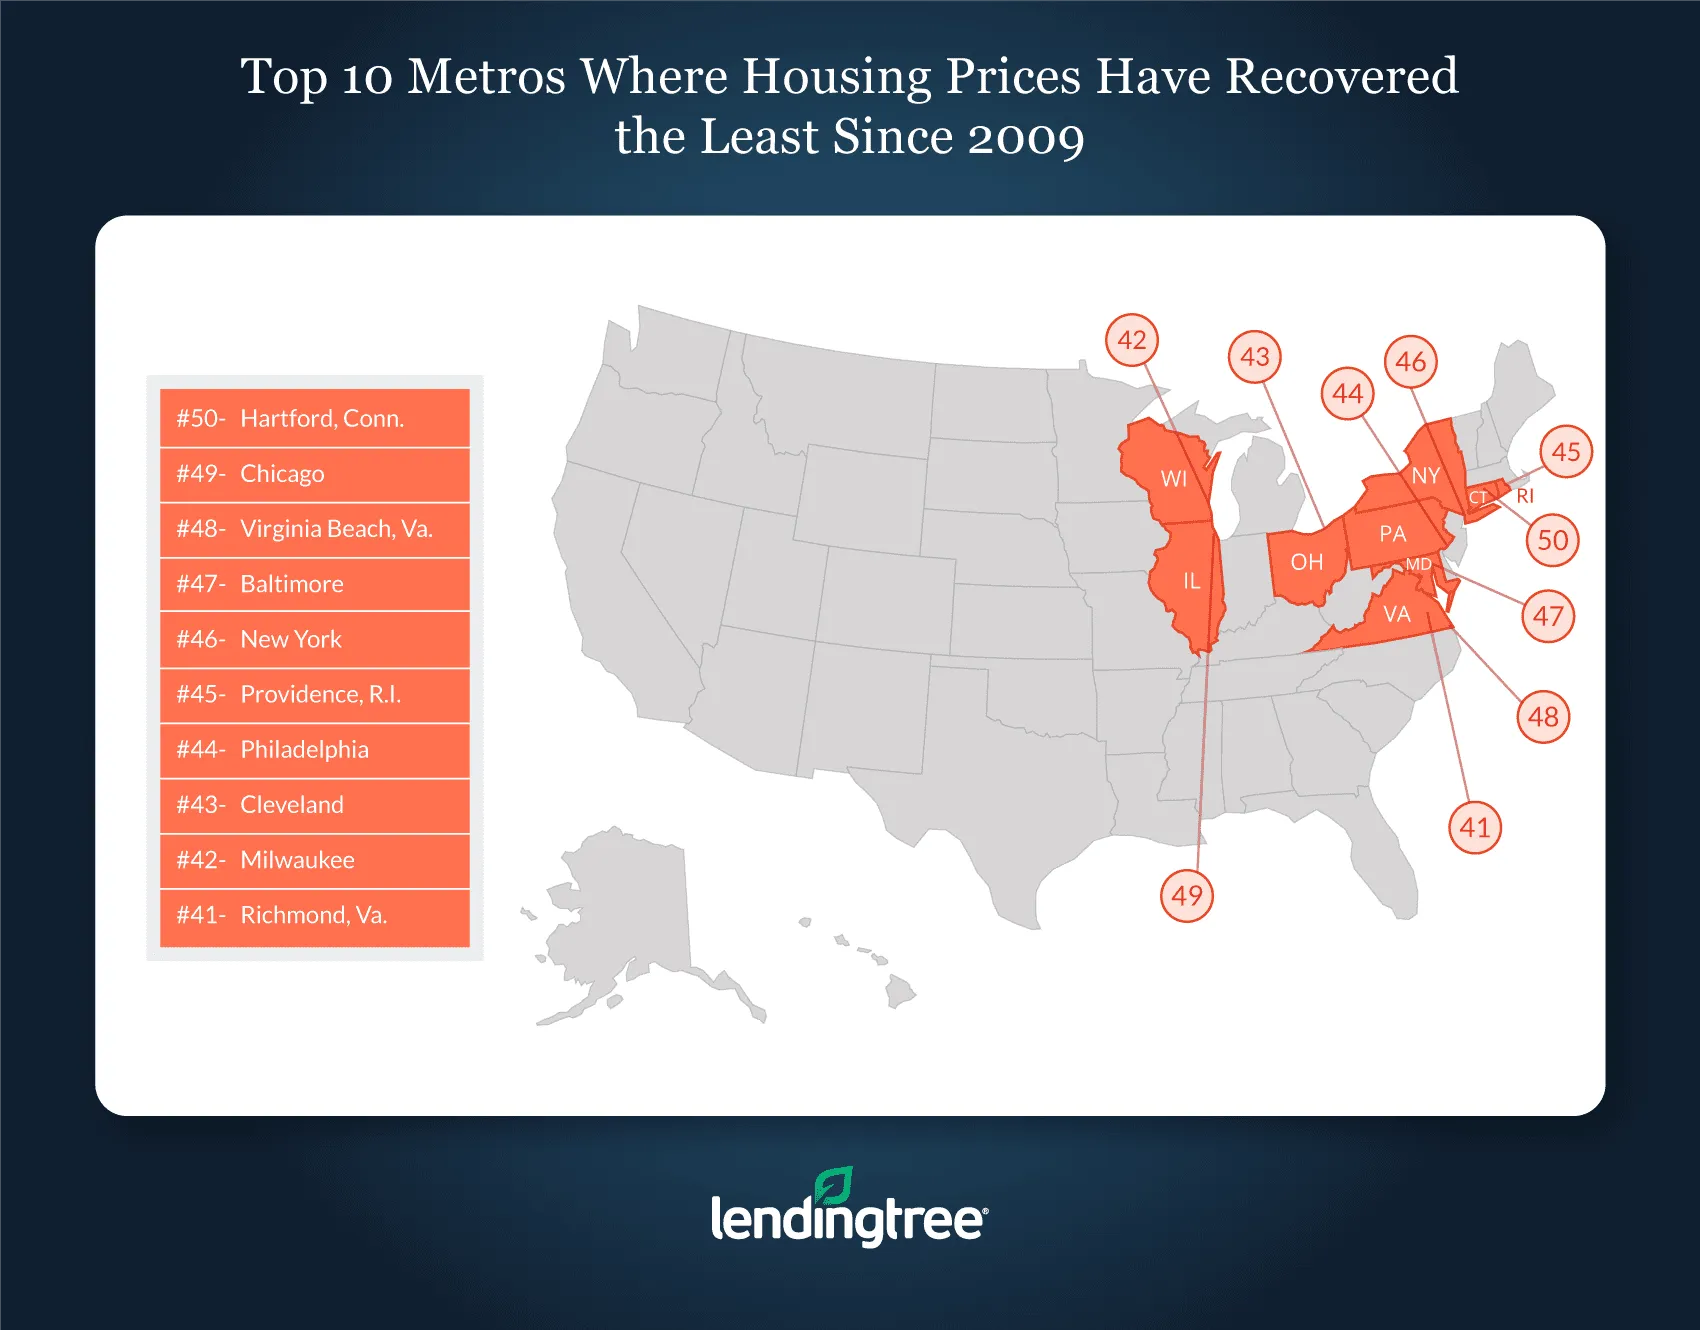
- Hartford, Conn., Chicago, Virginia Beach, Va., and Baltimore are the only metros in our study where median housing prices have fallen since 2009. On average, these areas have seen home prices fall nearly $6,700. It is difficult to blame these results on a single factor, but, in many of these areas, a lack of strong employment opportunities and out-of-state migration might play a role.
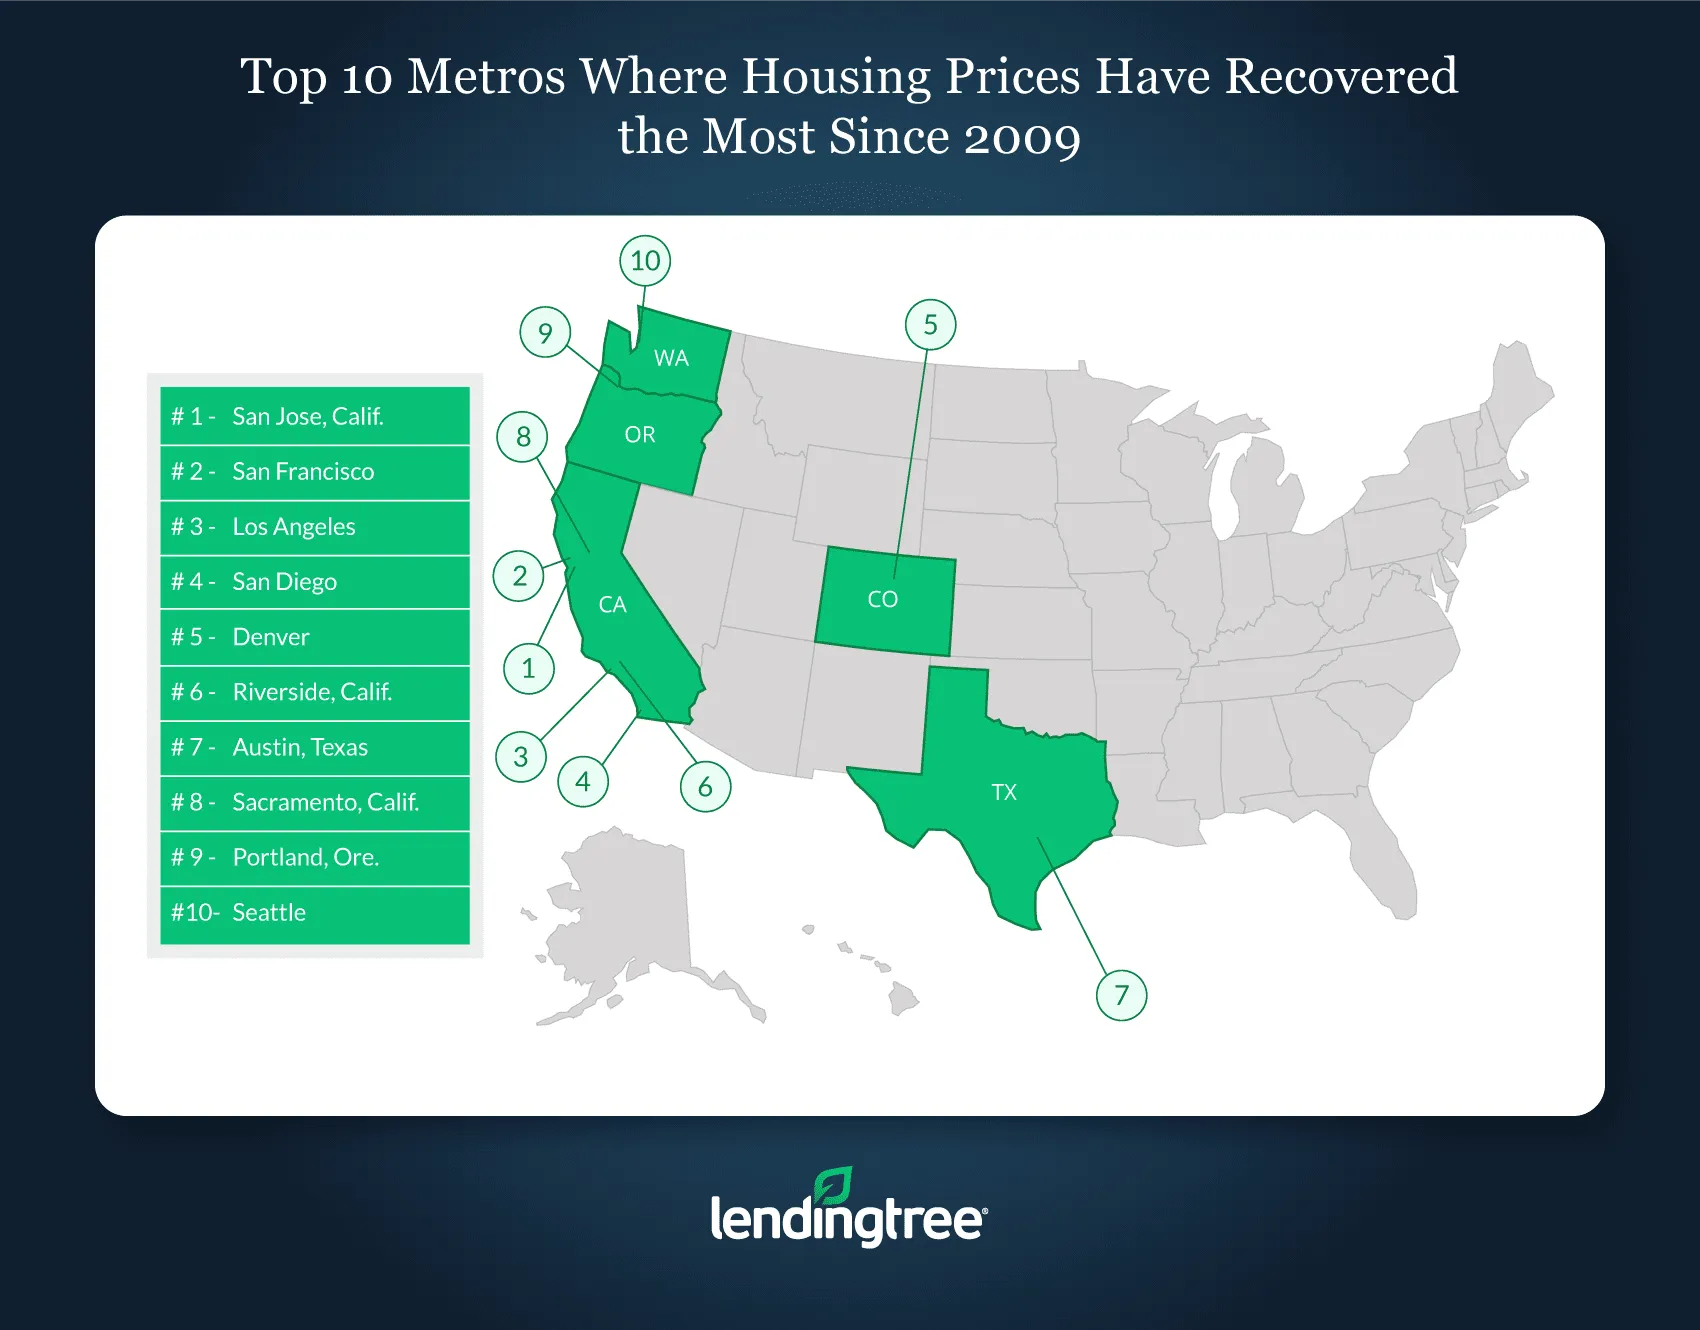
- The housing markets in San Jose, Calif., San Francisco and Los Angeles have recovered the most since 2009. Each of these areas has seen their average housing price climb by six-digit figures, with an average increase of $243,600. It is likely that these markets have rebounded so strongly due the prevalence of high paying jobs brought by tech companies like Google and Apple in these metros.
- Unemployment rates have fallen by an average of 4.7 percentage points in the nation’s 50 largest metros. Unemployment rates have fallen in every metro looked at in this study. Detroit’s drop of nearly 10 percentage points is the largest in the nation, while Houston’s 1.7 percentage point decrease is the smallest.
- The median household income in the metros surveyed in this study has increased by an average of $11,344 since 2009. San Antonio was the only metro where the median household income fell.
Metros where housing prices have recovered the most since 2009
San Jose, Calif.
- Median home value 2009: $638,300
- Median home value 2017: $957,700
- Median home value change: $319,400
- Median unemployment rate change: -6.4%
- Median household income change: $32,991
San Francisco
- Median home value 2009: $591,600
- Median home value 2017: $849,500
- Median home value change: $257,900
- Median unemployment rate change: -5.4%
- Median household income change: $27,889
Los Angeles
- Median home value 2009: $463,600
- Median home value 2017: $617,100
- Median home value change: $153,500
- Median unemployment rate change: -5.0%
- Median household income change: $11,467
Metros where housing prices have recovered the least since 2009
Hartford, Conn.
- Median home value 2009: $259,700
- Median home value 2017: $247,900
- Median home value change: -$11,800
- Median unemployment rate change: -2.8%
- Median household income change: $5,716
Chicago
- Median home value 2009: $249,600
- Median home value 2017: $240,300
- Median home value change: -$9,300
- Median unemployment rate change: -5.1%
- Median household income change: $9,674
Virginia Beach, Va.
- Median home value 2009: $249,600
- Median home value 2017: $245,900
- Median home value change: -$3,700
- Median unemployment rate change: -2.5%
- Median household income change: $9,046
What does this mean for today’s buyers
As our study shows, the housing market can change significantly in a decade. but while current homeowners and potential home buyers should understand how the housing market has changed over time, they should be careful not to let observations about the past and speculations about the future prevent them from taking advantage of opportunities in the present.
From allowing potential buyers to compare mortgage loan offers to helping current homeowners compare refinance rates, LendingTree offers numerous tools and resources that can help both current homeowners and would-be homebuyers navigate today’s market.
Methodology:
All data used to conduct this study comes from the U.S. Census bureau’s American Community Survey. The surveys used in this study are the 2009 and 2017 American Community Surveys with 1 year Estimates. The 2017 ACS contains the latest data available for the subjects covered in this study.
While the study also looks at income and unemployment rates, the ranking of metros is determined solely by how much home prices have increased in a given area since 2009. Metros where prices have increased the most are ranked the highest, while metros have decreased the least or fallen were ranked lower.
A table that includes full unemployment rate and median household income for 2009 and 2017 can be found here:
View mortgage loan offers from up to 5 lenders in minutes
Recommended Articles
Back-to-School Shopping Defies Inflation: Families Spend Nearly the Same as Before the Pandemic
Delaware, D.C. and Texas Have the Highest Business Bankruptcy Filing Rates in the US
Best Health Insurance Companies in Georgia in 2026
Homebuyer Down Payments by Generation in the 50 Largest US Metros
Best Merchant Cash Advances in August 2026
How To Refinance a Car Loan With Bad Credit
Best Bad Credit Auto Refinance Companies in August 2026
Home Insurance Takes Up Nearly a Fifth of Monthly Housing Costs in Some States
America’s Tourism-Dependent Metros Aren’t Always the Obvious Ones
Personal Bankruptcy Filings Have Risen 47% Since 2022, Marking a Third Straight Annual Increase