HOA Fees Surpass $500 a Month for Millions, and 82% Say Costs Are Rising


A home shopper may crunch the numbers to make sure the mortgage fits their budget, only to encounter the fine print: an additional $400 or even $500 a month in homeowners association (HOA) fees. This added cost can make a difference when it comes to overall home affordability, and it’s not especially uncommon.
Across the 100 largest U.S. metros, 17.5 million homeowners — nearly 1 in 3 — paid HOA or condo fees in 2024. And for 2.6 million of them, those dues ran at least $500 a month, adding up to $6,000 or more each year on top of a mortgage, property taxes and insurance.
Here’s a closer look at where these fees are most common and most costly.
- Homeowners association fees are widespread and costly for millions. Across the 100 largest metros, 17.5 million homeowners (31.8%) paid HOA or condominium fees in 2024. Among HOA-paying homeowners, 2.6 million (15.0%) paid at least $500 a month — which is $6,000+ annually.
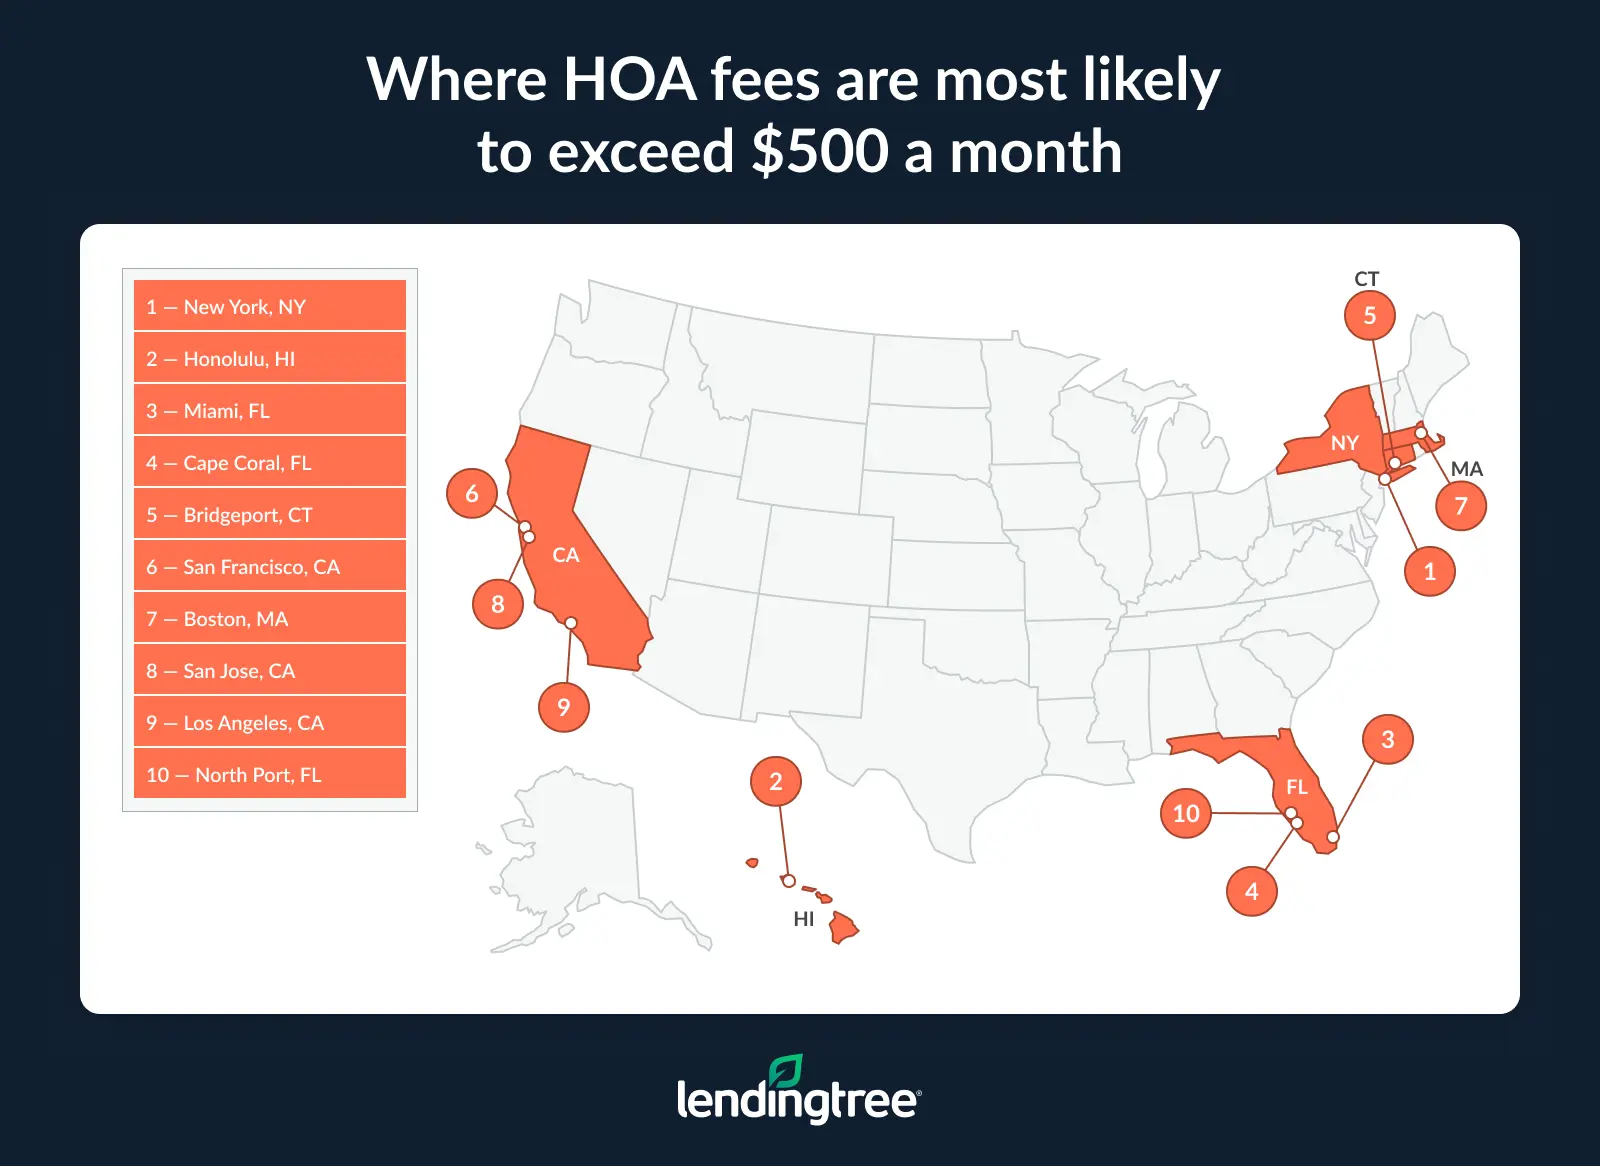
- New York tops the list, with over half (53.4%) of HOA-paying homeowners owing monthly fees of $500 or more, followed by Honolulu (52.4%) and Miami (39.5%). Together, these three metros account for 30.8% of all homeowners paying $500 or more a month. By contrast, less than 2.0% of homeowners in HOAs in two Utah metros, Provo and Ogden, and in Albuquerque, N.M., face such high fees.
- HOA fees are most common in Las Vegas, Orlando, Fla., and Houston. In Las Vegas, 60.9% of all homeowners pay HOA or condo fees — the highest rate of any metro. That’s ahead of Orlando (56.4%) and Houston (55.3%).
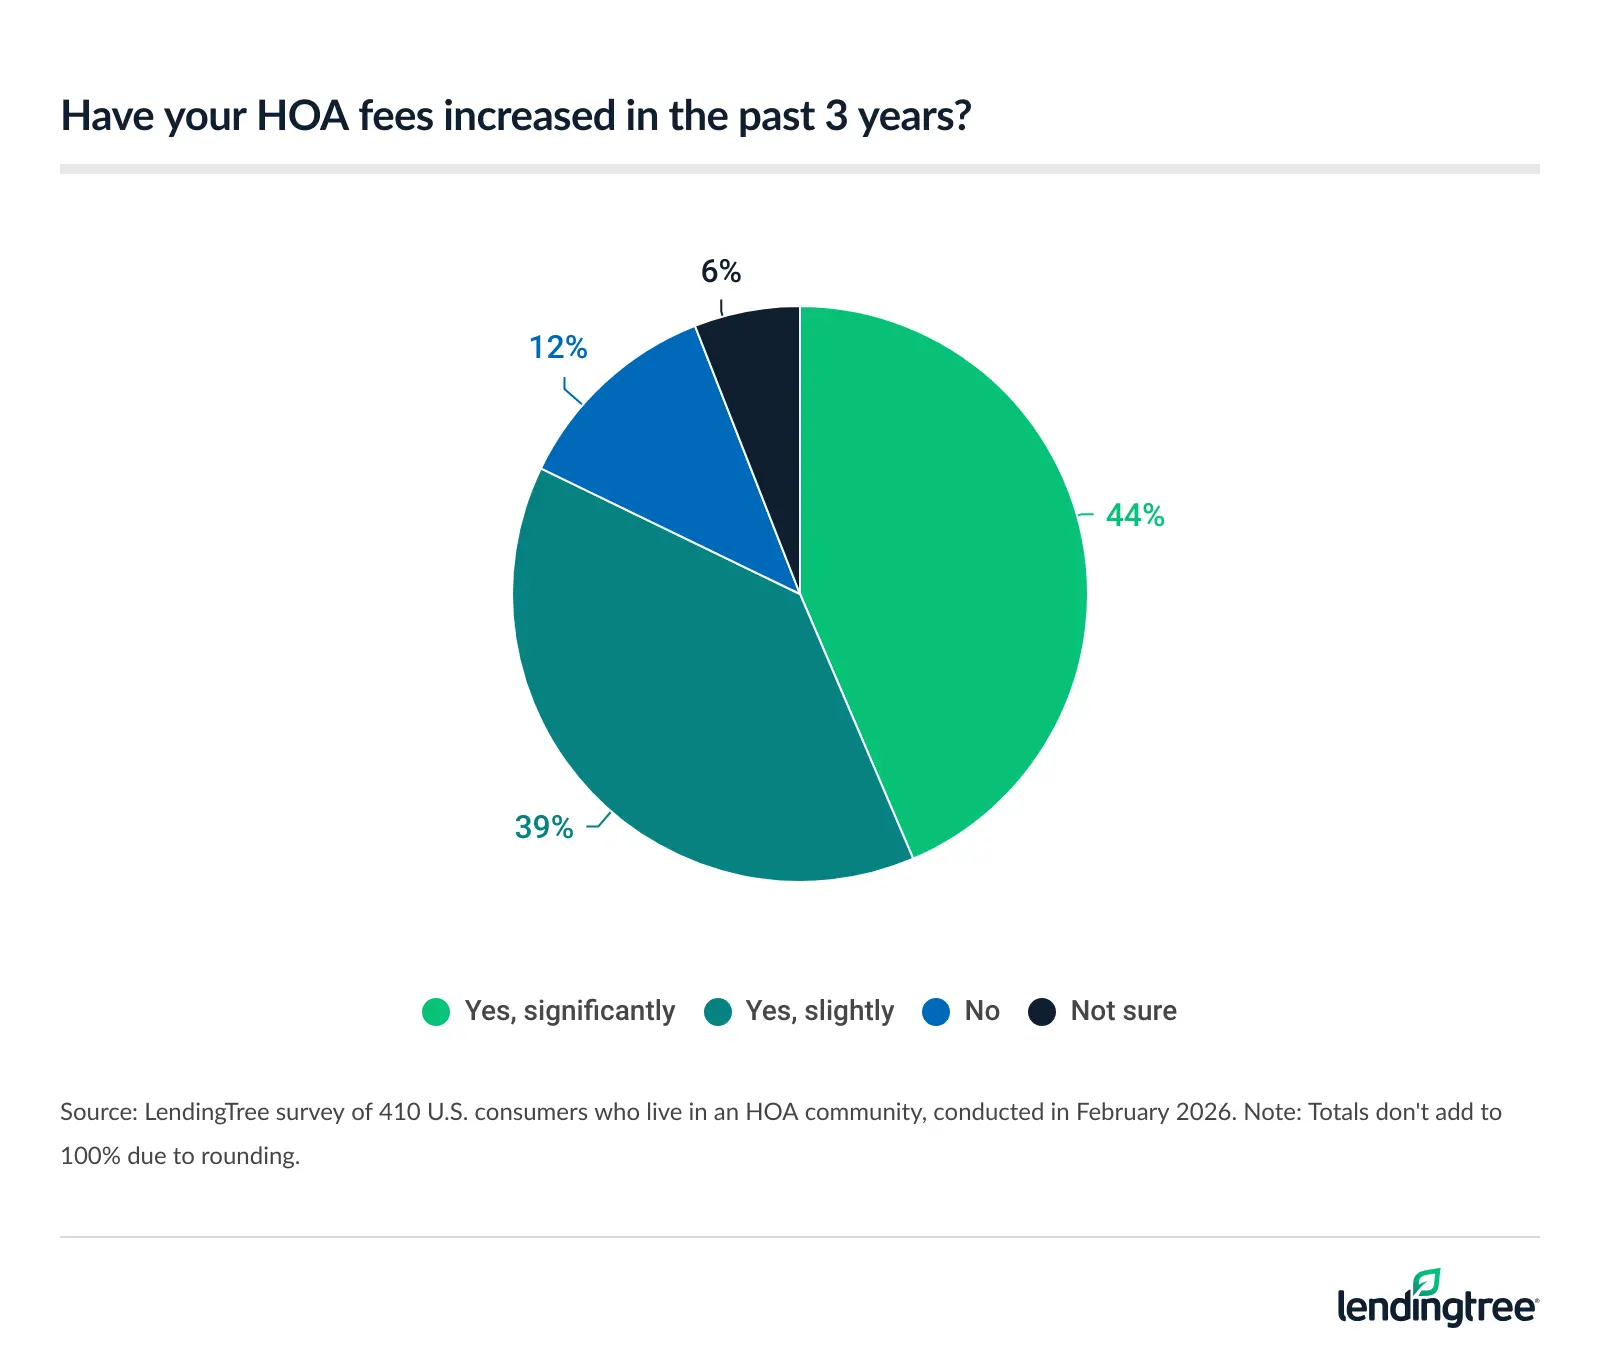
- Separately, our survey finds that HOA fees are rising and are more common among higher earners. Among current HOA residents, 82% say their fees have gone up in the past three years, including 44% who say the increase was significant. While about 1 in 5 (21%) Americans surveyed live in a community with an HOA, that jumps to 34% among those earning $100,000 or more, compared with just 9% of those earning less than $30,000.
- Most non-HOA residents want to keep it that way, especially older generations. Among those who don’t currently live in an HOA community, 73% say they’d be unlikely to choose one if buying today, including 88% of baby boomers and 80% of Gen Xers. In fact, 59% say they actively avoid HOA properties when searching for housing.
31.8% of homeowners in biggest metros pay HOA fees
HOA fees are a common price to pay, but they’re nothing if not costly.
In 2024, 17.5 million homeowners paid HOA or condominium fees across the 100 largest metros. That’s 31.8% of all homeowners in these metros, or nearly 1 in 3 homeowners. Among HOA-paying homeowners, 2.6 million paid at least $500 a month, which translates to 15.0% of HOA-paying homeowners spending $6,000+ annually on their neighborhood premium.
Matt Schulz, LendingTree chief consumer finance analyst and author of “Ask Questions, Save Money, Make More: How to Take Control of Your Financial Life,” believes that many people underestimate just how big a deal HOA costs are.
“When you’re paying $500 or more a month, that’s a really big deal, especially when you consider how tight many Americans’ budgets are,” he says. “That’s money that can’t go to other financial priorities, such as building an emergency fund, paying down high-interest debt or saving for retirement.”
New York homeowners most likely to pay $500 or more
By metro, New York homeowners are the most likely to pay the biggest premium. Here, 53.4% of HOA-paying homeowners pay monthly fees of $500 or more.
Similarly expensive metros Honolulu (52.4%) and Miami (39.5%) follow. These three metros account for 30.8% of all homeowners in the biggest metros paying $500 or more a month in HOA fees.
Schulz says those dues can have a huge impact on home shoppers.
“When people consider how much home they can afford, they’re generally thinking about how big of a monthly payment they’re comfortable taking on,” he says. “The total loan amount and the interest rate are the primary factors to consider, but if you don’t also take into account HOA fees, private mortgage insurance (PMI) and other costs that typically are part of your monthly payment, that’s a recipe for trouble.”
On the other end of the list, less than 2.0% of homeowners in HOAs in two Utah metros, Provo and Ogden, and in Albuquerque, N.M., pay fees of $500 or more a month.
Meanwhile, median monthly HOA fees are highest in New York ($558), Honolulu ($526) and Bridgeport, Conn. ($424). At the other end of the spectrum, HOA-paying homeowners pay the least in Fayetteville, Ark. ($42), Little Rock, Ark. ($43), and Tulsa, Okla., and Oklahoma City (both at $48). That’s a difference of more than $500 a month compared to New York.
Full rankings: Where HOA fees are most likely to exceed $500 a month
| Rank | Metro | % of homeowners in HOAs paying $500+/mo | % of homeowners in HOAs paying $1,000+/mo | % of homeowners paying HOA fees | Median monthly HOA fee |
|---|---|---|---|---|---|
| 1 | New York, NY | 53.4% | 28.0% | 21.9% | $558 |
| 2 | Honolulu, HI | 52.4% | 16.0% | 49.2% | $526 |
| 3 | Miami, FL | 39.5% | 12.6% | 54.1% | $410 |
| 4 | Cape Coral, FL | 37.0% | 11.7% | 40.4% | $411 |
| 5 | Bridgeport, CT | 35.0% | 7.7% | 20.5% | $424 |
| 6 | San Francisco, CA | 31.8% | 6.4% | 27.4% | $349 |
| 7 | Boston, MA | 29.9% | 5.3% | 20.2% | $386 |
| 8 | San Jose, CA | 25.7% | 3.1% | 23.2% | $362 |
| 9 | Los Angeles, CA | 24.3% | 3.3% | 27.2% | $343 |
| 10 | North Port, FL | 23.1% | 6.9% | 53.3% | $275 |
| 11 | Deltona, FL | 20.0% | 6.0% | 28.0% | $170 |
| 12 | Worcester, MA | 19.8% | 1.4% | 10.7% | $365 |
| 13 | Seattle, WA | 19.4% | 3.4% | 32.5% | $103 |
| 13 | Tampa, FL | 19.4% | 3.7% | 41.3% | $161 |
| 15 | New Haven, CT | 19.3% | 2.3% | 16.8% | $338 |
| 16 | Houston, TX | 19.0% | 6.9% | 55.3% | $105 |
| 17 | Kiryas Joel, NY | 17.7% | 1.8% | 12.9% | $341 |
| 18 | New Orleans, LA | 17.4% | 8.2% | 10.6% | $98 |
| 19 | Buffalo, NY | 17.3% | 8.1% | 6.3% | $287 |
| 19 | Palm Bay, FL | 17.3% | 2.8% | 38.2% | $127 |
| 21 | San Diego, CA | 16.8% | 2.2% | 38.3% | $277 |
| 22 | Chicago, IL | 16.2% | 4.7% | 30.5% | $252 |
| 23 | Oxnard, CA | 15.8% | 0.7% | 32.8% | $242 |
| 24 | Providence, RI | 14.9% | 1.4% | 9.7% | $321 |
| 24 | Hartford, CT | 14.9% | 1.8% | 14.5% | $323 |
| 26 | Washington, DC | 14.3% | 4.1% | 51.0% | $133 |
| 26 | Minneapolis, MN | 14.3% | 2.9% | 23.4% | $276 |
| 26 | Syracuse, NY | 14.3% | 7.2% | 5.1% | $184 |
| 29 | Atlanta, GA | 13.9% | 2.9% | 44.8% | $110 |
| 30 | Fresno, CA | 11.4% | 0.9% | 9.3% | $143 |
| 31 | Riverside, CA | 11.2% | 2.6% | 24.0% | $175 |
| 32 | Philadelphia, PA | 10.7% | 3.9% | 20.7% | $163 |
| 33 | Kansas City, MO | 10.4% | 2.6% | 35.2% | $68 |
| 34 | Portland, OR | 10.3% | 1.8% | 22.9% | $93 |
| 35 | El Paso, TX | 10.1% | 1.3% | 4.7% | $57 |
| 36 | Dallas, TX | 9.7% | 2.9% | 37.5% | $75 |
| 37 | Charleston, SC | 9.5% | 3.4% | 47.4% | $96 |
| 38 | Stockton, CA | 9.3% | 1.4% | 15.5% | $142 |
| 39 | Jacksonville, FL | 9.1% | 2.1% | 48.0% | $101 |
| 40 | Albany, NY | 8.8% | 4.7% | 8.1% | $163 |
| 41 | Cleveland, OH | 8.7% | 2.2% | 18.5% | $160 |
| 42 | Milwaukee, WI | 8.3% | 1.8% | 19.0% | $225 |
| 42 | Memphis, TN | 8.3% | 3.2% | 22.2% | $68 |
| 44 | Greenville, SC | 8.1% | 1.0% | 32.0% | $70 |
| 44 | Chattanooga, TN | 8.1% | 0.7% | 17.1% | $67 |
| 46 | Detroit, MI | 8.0% | 1.7% | 26.4% | $135 |
| 46 | Denver, CO | 8.0% | 1.3% | 48.4% | $114 |
| 48 | Baltimore, MD | 7.7% | 2.2% | 35.9% | $97 |
| 48 | Cincinnati, OH | 7.7% | 1.8% | 24.5% | $122 |
| 50 | Pittsburgh, PA | 7.3% | 2.4% | 10.9% | $116 |
| 51 | Augusta, GA | 7.1% | 1.2% | 28.9% | $59 |
| 52 | Indianapolis, IN | 6.7% | 1.5% | 40.6% | $66 |
| 53 | Orlando, FL | 6.6% | 1.5% | 56.4% | $125 |
| 53 | Oklahoma City, OK | 6.6% | 2.1% | 32.2% | $48 |
| 55 | St. Louis, MO | 6.5% | 1.5% | 34.2% | $50 |
| 55 | Akron, OH | 6.5% | 0.4% | 19.7% | $130 |
| 57 | Birmingham, AL | 6.4% | 1.8% | 23.2% | $59 |
| 58 | Madison, WI | 6.1% | 0.5% | 20.1% | $163 |
| 59 | Sacramento, CA | 6.0% | 1.5% | 20.4% | $158 |
| 60 | Boise, ID | 5.9% | 1.1% | 51.7% | $63 |
| 61 | Columbia, SC | 5.8% | 0.9% | 33.8% | $57 |
| 62 | Louisville, KY | 5.7% | 1.7% | 26.1% | $71 |
| 63 | Virginia Beach, VA | 5.4% | 2.2% | 28.4% | $107 |
| 63 | Grand Rapids, MI | 5.4% | 1.2% | 18.9% | $177 |
| 65 | Tulsa, OK | 5.3% | 1.3% | 26.9% | $48 |
| 66 | Charlotte, NC | 5.2% | 1.3% | 40.9% | $90 |
| 66 | Richmond, VA | 5.2% | 1.7% | 30.5% | $106 |
| 68 | Jackson, MS | 5.1% | 2.9% | 27.3% | $57 |
| 69 | Salt Lake City, UT | 5.0% | 0.9% | 21.6% | $190 |
| 69 | Bakersfield, CA | 5.0% | 2.2% | 11.3% | $157 |
| 71 | Dayton, OH | 4.9% | 0.4% | 16.2% | $94 |
| 72 | McAllen, TX | 4.7% | 3.7% | 10.1% | $71 |
| 72 | Little Rock, AR | 4.7% | 0.5% | 17.5% | $43 |
| 74 | Austin, TX | 4.6% | 1.2% | 52.9% | $62 |
| 75 | Columbus, OH | 4.5% | 1.2% | 29.9% | $106 |
| 75 | Omaha, NE | 4.5% | 1.7% | 25.5% | $49 |
| 75 | Lakeland, FL | 4.5% | 0.9% | 39.8% | $83 |
| 78 | Wichita, KS | 4.3% | 1.2% | 26.0% | $49 |
| 79 | Rochester, NY | 4.2% | 0.0% | 6.7% | $246 |
| 80 | Allentown, PA | 3.8% | 0.7% | 10.8% | $198 |
| 81 | San Antonio, TX | 3.7% | 1.5% | 43.7% | $58 |
| 82 | Phoenix, AZ | 3.6% | 1.1% | 54.0% | $106 |
| 82 | Colorado Springs, CO | 3.6% | 0.4% | 37.7% | $72 |
| 82 | Durham, NC | 3.6% | 1.1% | 40.9% | $87 |
| 82 | Fayetteville, AR | 3.6% | 0.8% | 27.9% | $42 |
| 86 | Raleigh, NC | 3.5% | 1.2% | 53.7% | $74 |
| 87 | Knoxville, TN | 3.4% | 0.6% | 21.2% | $65 |
| 88 | Las Vegas, NV | 3.1% | 1.0% | 60.9% | $99 |
| 89 | Spokane, WA | 3.0% | 0.8% | 15.3% | $73 |
| 90 | Baton Rouge, LA | 2.9% | 0.0% | 27.1% | $56 |
| 91 | Des Moines, IA | 2.8% | 0.5% | 20.4% | $135 |
| 92 | Winston-Salem, NC | 2.7% | 0.9% | 19.8% | $58 |
| 93 | Nashville, TN | 2.6% | 0.6% | 32.9% | $88 |
| 93 | Tucson, AZ | 2.6% | 1.1% | 44.4% | $71 |
| 95 | Harrisburg, PA | 2.3% | 0.5% | 17.6% | $94 |
| 96 | Greensboro, NC | 2.1% | 0.3% | 23.8% | $76 |
| 96 | Toledo, OH | 2.1% | 0.7% | 14.9% | $103 |
| 98 | Albuquerque, NM | 1.8% | 0.5% | 22.9% | $54 |
| 99 | Ogden, UT | 1.1% | 0.0% | 17.7% | $116 |
| 100 | Provo, UT | 1.0% | 0.3% | 28.4% | $106 |
Full rankings: Metros with the most expensive median monthly HOA fees
| Rank | Metro | Median monthly HOA fee |
|---|---|---|
| 1 | New York, NY | $558 |
| 2 | Honolulu, HI | $526 |
| 3 | Bridgeport, CT | $424 |
| 4 | Cape Coral, FL | $411 |
| 5 | Miami, FL | $410 |
| 6 | Boston, MA | $386 |
| 7 | Worcester, MA | $365 |
| 8 | San Jose, CA | $362 |
| 9 | San Francisco, CA | $349 |
| 10 | Los Angeles, CA | $343 |
| 11 | Kiryas Joel, NY | $341 |
| 12 | New Haven, CT | $338 |
| 13 | Hartford, CT | $323 |
| 14 | Providence, RI | $321 |
| 15 | Buffalo, NY | $287 |
| 16 | San Diego, CA | $277 |
| 17 | Minneapolis, MN | $276 |
| 18 | North Port, FL | $275 |
| 19 | Chicago, IL | $252 |
| 20 | Rochester, NY | $246 |
| 21 | Oxnard, CA | $242 |
| 22 | Milwaukee, WI | $225 |
| 23 | Allentown, PA | $198 |
| 24 | Salt Lake City, UT | $190 |
| 25 | Syracuse, NY | $184 |
| 26 | Grand Rapids, MI | $177 |
| 27 | Riverside, CA | $175 |
| 28 | Deltona, FL | $170 |
| 29 | Philadelphia, PA | $163 |
| 29 | Albany, NY | $163 |
| 29 | Madison, WI | $163 |
| 32 | Tampa, FL | $161 |
| 33 | Cleveland, OH | $160 |
| 34 | Sacramento, CA | $158 |
| 35 | Bakersfield, CA | $157 |
| 36 | Fresno, CA | $143 |
| 37 | Stockton, CA | $142 |
| 38 | Detroit, MI | $135 |
| 38 | Des Moines, IA | $135 |
| 40 | Washington, DC | $133 |
| 41 | Akron, OH | $130 |
| 42 | Palm Bay, FL | $127 |
| 43 | Orlando, FL | $125 |
| 44 | Cincinnati, OH | $122 |
| 45 | Pittsburgh, PA | $116 |
| 45 | Ogden, UT | $116 |
| 47 | Denver, CO | $114 |
| 48 | Atlanta, GA | $110 |
| 49 | Virginia Beach, VA | $107 |
| 50 | Richmond, VA | $106 |
| 50 | Columbus, OH | $106 |
| 50 | Phoenix, AZ | $106 |
| 50 | Provo, UT | $106 |
| 54 | Houston, TX | $105 |
| 55 | Seattle, WA | $103 |
| 55 | Toledo, OH | $103 |
| 57 | Jacksonville, FL | $101 |
| 58 | Las Vegas, NV | $99 |
| 59 | New Orleans, LA | $98 |
| 60 | Baltimore, MD | $97 |
| 61 | Charleston, SC | $96 |
| 62 | Dayton, OH | $94 |
| 62 | Harrisburg, PA | $94 |
| 64 | Portland, OR | $93 |
| 65 | Charlotte, NC | $90 |
| 66 | Nashville, TN | $88 |
| 67 | Durham, NC | $87 |
| 68 | Lakeland, FL | $83 |
| 69 | Greensboro, NC | $76 |
| 70 | Dallas, TX | $75 |
| 71 | Raleigh, NC | $74 |
| 72 | Spokane, WA | $73 |
| 73 | Colorado Springs, CO | $72 |
| 74 | Louisville, KY | $71 |
| 74 | McAllen, TX | $71 |
| 74 | Tucson, AZ | $71 |
| 77 | Greenville, SC | $70 |
| 78 | Kansas City, MO | $68 |
| 78 | Memphis, TN | $68 |
| 80 | Chattanooga, TN | $67 |
| 81 | Indianapolis, IN | $66 |
| 82 | Knoxville, TN | $65 |
| 83 | Boise, ID | $63 |
| 84 | Austin, TX | $62 |
| 85 | Augusta, GA | $59 |
| 85 | Birmingham, AL | $59 |
| 87 | San Antonio, TX | $58 |
| 87 | Winston-Salem, NC | $58 |
| 89 | El Paso, TX | $57 |
| 89 | Columbia, SC | $57 |
| 89 | Jackson, MS | $57 |
| 92 | Baton Rouge, LA | $56 |
| 93 | Albuquerque, NM | $54 |
| 94 | St. Louis, MO | $50 |
| 95 | Omaha, NE | $49 |
| 95 | Wichita, KS | $49 |
| 97 | Oklahoma City, OK | $48 |
| 97 | Tulsa, OK | $48 |
| 99 | Little Rock, AR | $43 |
| 100 | Fayetteville, AR | $42 |
HOA fees are most common in Las Vegas
Expensive HOA fees are one thing — but where are HOAs most common?
Las Vegas tops the list on this, with 60.9% of all homeowners there paying HOA or condo fees. Orlando, Fla. (56.4%), and Houston (55.3%) follow.
In total, at least half of homeowners have an HOA fee in 10 metros.
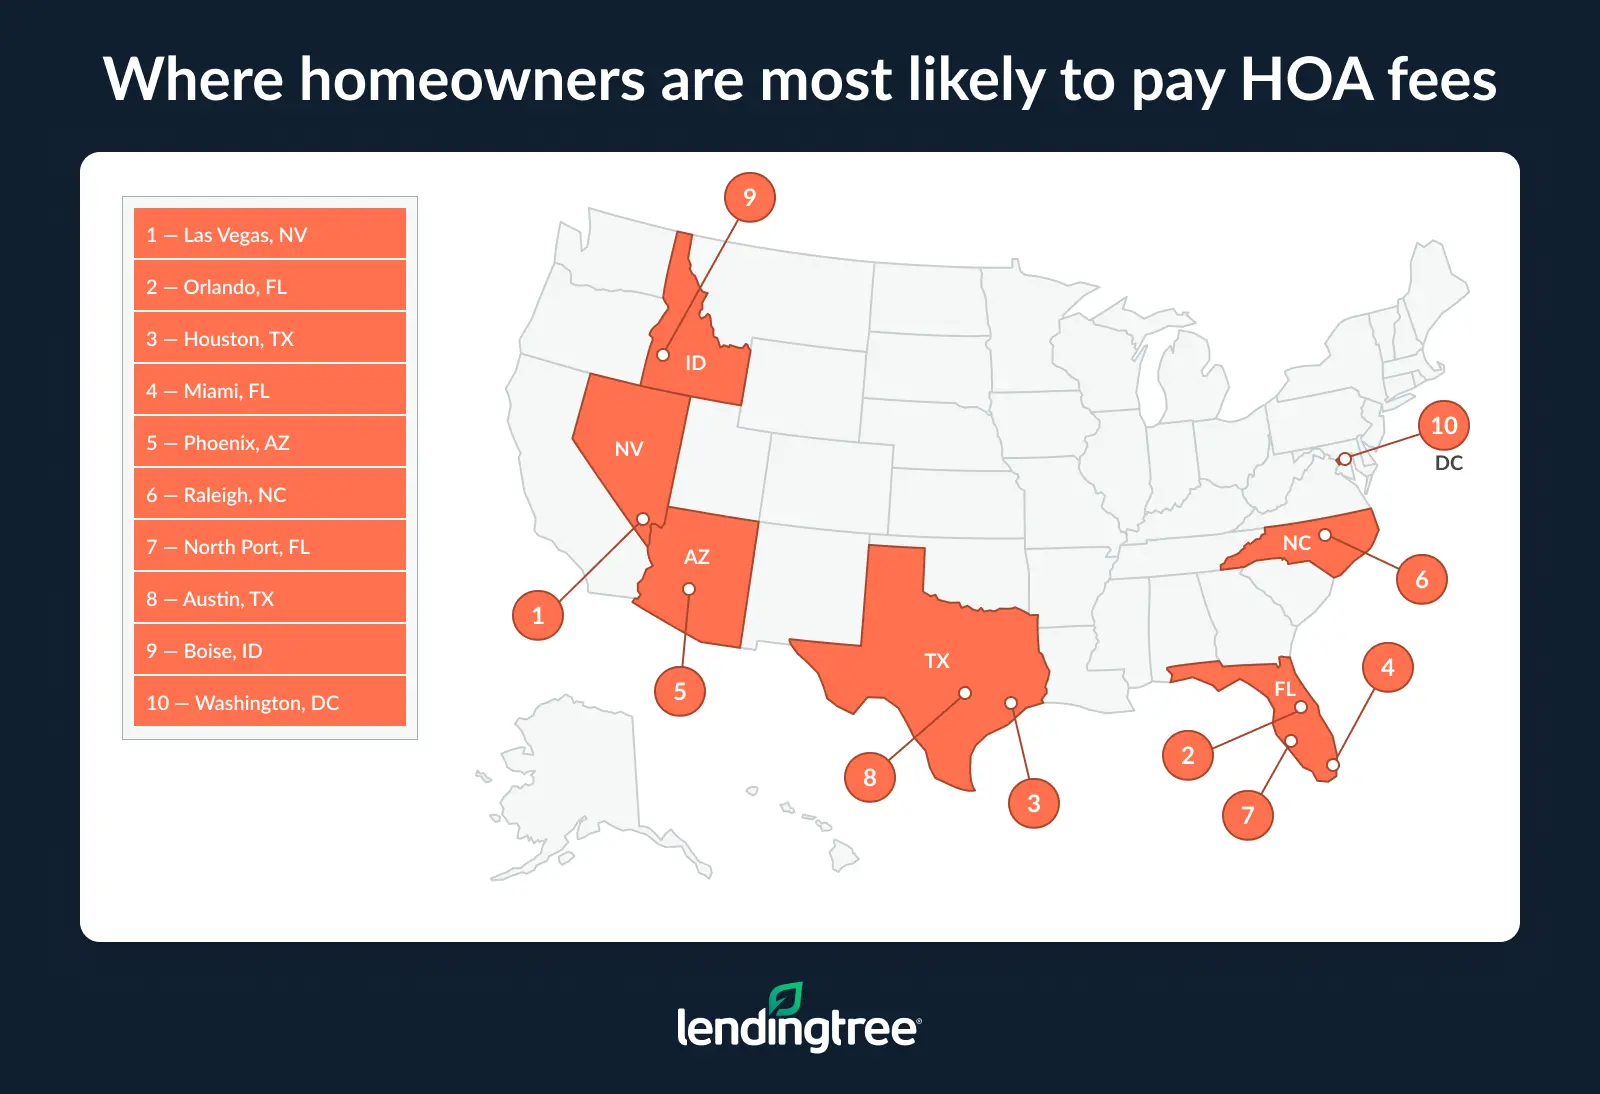
Meanwhile, El Paso, Texas, homeowners are least likely to have HOA fees, with just 4.7% paying them. That’s followed by Syracuse, N.Y. (5.1%), and Buffalo, N.Y. (6.3%).
Full rankings: Where homeowners are most likely to pay HOA fees
| Rank | Metro | % of homeowners paying HOA fees |
|---|---|---|
| 1 | Las Vegas, NV | 60.9% |
| 2 | Orlando, FL | 56.4% |
| 3 | Houston, TX | 55.3% |
| 4 | Miami, FL | 54.1% |
| 5 | Phoenix, AZ | 54.0% |
| 6 | Raleigh, NC | 53.7% |
| 7 | North Port, FL | 53.3% |
| 8 | Austin, TX | 52.9% |
| 9 | Boise, ID | 51.7% |
| 10 | Washington, DC | 51.0% |
| 11 | Honolulu, HI | 49.2% |
| 12 | Denver, CO | 48.4% |
| 13 | Jacksonville, FL | 48.0% |
| 14 | Charleston, SC | 47.4% |
| 15 | Atlanta, GA | 44.8% |
| 16 | Tucson, AZ | 44.4% |
| 17 | San Antonio, TX | 43.7% |
| 18 | Tampa, FL | 41.3% |
| 19 | Charlotte, NC | 40.9% |
| 19 | Durham, NC | 40.9% |
| 21 | Indianapolis, IN | 40.6% |
| 22 | Cape Coral, FL | 40.4% |
| 23 | Lakeland, FL | 39.8% |
| 24 | San Diego, CA | 38.3% |
| 25 | Palm Bay, FL | 38.2% |
| 26 | Colorado Springs, CO | 37.7% |
| 27 | Dallas, TX | 37.5% |
| 28 | Baltimore, MD | 35.9% |
| 29 | Kansas City, MO | 35.2% |
| 30 | St. Louis, MO | 34.2% |
| 31 | Columbia, SC | 33.8% |
| 32 | Nashville, TN | 32.9% |
| 33 | Oxnard, CA | 32.8% |
| 34 | Seattle, WA | 32.5% |
| 35 | Oklahoma City, OK | 32.2% |
| 36 | Greenville, SC | 32.0% |
| 37 | Chicago, IL | 30.5% |
| 37 | Richmond, VA | 30.5% |
| 39 | Columbus, OH | 29.9% |
| 40 | Augusta, GA | 28.9% |
| 41 | Virginia Beach, VA | 28.4% |
| 41 | Provo, UT | 28.4% |
| 43 | Deltona, FL | 28.0% |
| 44 | Fayetteville, AR | 27.9% |
| 45 | San Francisco, CA | 27.4% |
| 46 | Jackson, MS | 27.3% |
| 47 | Los Angeles, CA | 27.2% |
| 48 | Baton Rouge, LA | 27.1% |
| 49 | Tulsa, OK | 26.9% |
| 50 | Detroit, MI | 26.4% |
| 51 | Louisville, KY | 26.1% |
| 52 | Wichita, KS | 26.0% |
| 53 | Omaha, NE | 25.5% |
| 53 | Cincinnati, OH | 24.5% |
| 55 | Riverside, CA | 24.0% |
| 56 | Greensboro, NC | 23.8% |
| 57 | Minneapolis, MN | 23.4% |
| 58 | San Jose, CA | 23.2% |
| 58 | Birmingham, AL | 23.2% |
| 60 | Portland, OR | 22.9% |
| 60 | Albuquerque, NM | 22.9% |
| 62 | Memphis, TN | 22.2% |
| 63 | New York, NY | 21.9% |
| 64 | Salt Lake City, UT | 21.6% |
| 65 | Knoxville, TN | 21.2% |
| 66 | Philadelphia, PA | 20.7% |
| 67 | Bridgeport, CT | 20.5% |
| 68 | Sacramento, CA | 20.4% |
| 68 | Des Moines, IA | 20.4% |
| 70 | Boston, MA | 20.2% |
| 71 | Madison, WI | 20.1% |
| 72 | Winston-Salem, NC | 19.8% |
| 73 | Akron, OH | 19.7% |
| 74 | Milwaukee, WI | 19.0% |
| 75 | Grand Rapids, MI | 18.9% |
| 76 | Cleveland, OH | 18.5% |
| 77 | Ogden, UT | 17.7% |
| 78 | Harrisburg, PA | 17.6% |
| 79 | Little Rock, AR | 17.5% |
| 80 | Chattanooga, TN | 17.1% |
| 81 | New Haven, CT | 16.8% |
| 82 | Dayton, OH | 16.2% |
| 83 | Stockton, CA | 15.5% |
| 84 | Spokane, WA | 15.3% |
| 85 | Toledo, OH | 14.9% |
| 86 | Hartford, CT | 14.5% |
| 87 | Kiryas Joel, NY | 12.9% |
| 88 | Bakersfield, CA | 11.3% |
| 89 | Pittsburgh, PA | 10.9% |
| 90 | Allentown, PA | 10.8% |
| 91 | Worcester, MA | 10.7% |
| 92 | New Orleans, LA | 10.6% |
| 93 | McAllen, TX | 10.1% |
| 94 | Providence, RI | 9.7% |
| 95 | Fresno, CA | 9.3% |
| 96 | Albany, NY | 8.1% |
| 97 | Rochester, NY | 6.7% |
| 98 | Buffalo, NY | 6.3% |
| 99 | Syracuse, NY | 5.1% |
| 100 | El Paso, TX | 4.7% |
HOA fees are rising
In a survey of 2,000 U.S. consumers, we found that HOA fees are rising. Among those in an HOA community, 82% say their fees have gone up in the past three years. This includes 44% who say the increase was significant.
About 1 in 5 (21%) Americans surveyed live in a community with an HOA — but it’s certainly more common among high earners. That figure jumps to 34% among those earning $100,000 or more, compared with just 9% of those earning less than $30,000.
Schulz says that’s not surprising.
“HOA communities certainly aren’t just for higher-income buyers, but I’m also not surprised that those with bigger incomes are more likely to face HOA fees,” he says. “For example, many master-planned communities, which can come with higher price tags, have HOAs to help maintain amenities such as pools and clubhouses or to keep the neighborhood looking manicured and clean. HOAs also often enforce rules about landscaping, renovations, noise and more. These rules, and the HOA’s enforcement of them, are often seen as necessary evils for the sake of protecting property values in the area.”
Those with children younger than 18 (31%) and millennials ages 30 to 45 (25%) are also more likely to live in an HOA community.
Residents call the HOA system fair — and many homeowners are involved
HOA residents say the system is fair, despite restrictions and penalties. Among homeowners who currently pay HOA fees, 86% find the rules at least somewhat reasonable, and 70% say their fees are justified given the benefits they receive. However, 62% say that HOA rules have limited how they can use, modify or enjoy their home, and 46% have been fined, warned or cited by their HOA.
Still, 78% of those who have had action taken against them by their HOA believe it was done fairly.
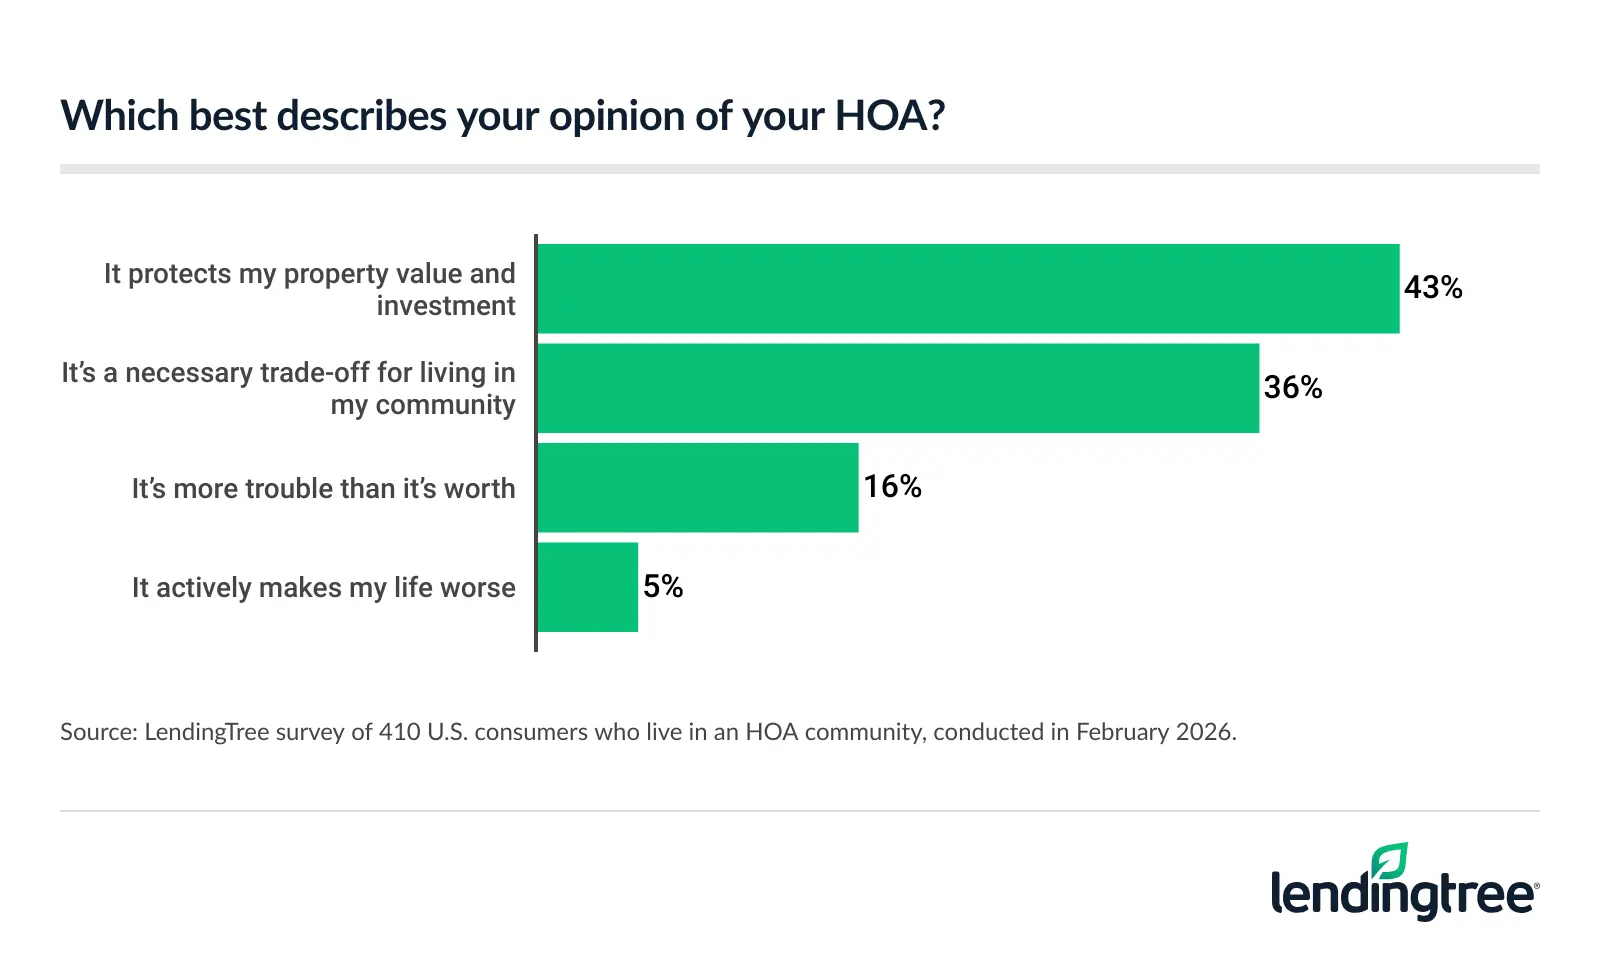
Not only do those in HOAs believe the system is fair, but most residents see value in the trade-offs. Among HOA residents, 43% say their HOA protects their property value, and another 36% call it a necessary trade-off. Just 5% say it actively makes their life worse.
Notably, about half (51%) say they currently serve on or have previously served on their HOA board.
Non-HOA residents wouldn’t buy into one
Despite the generally positive attitude that residents with HOAs have toward their associations, the grass doesn’t always look greener from the other side. Most people not in an HOA community would prefer to stay away from them, with 73% saying they’d be unlikely to choose a home with an HOA if buying today. That percentage rises to 88% among baby boomers ages 62 to 80 and 80% among Gen Xers ages 46 to 61.
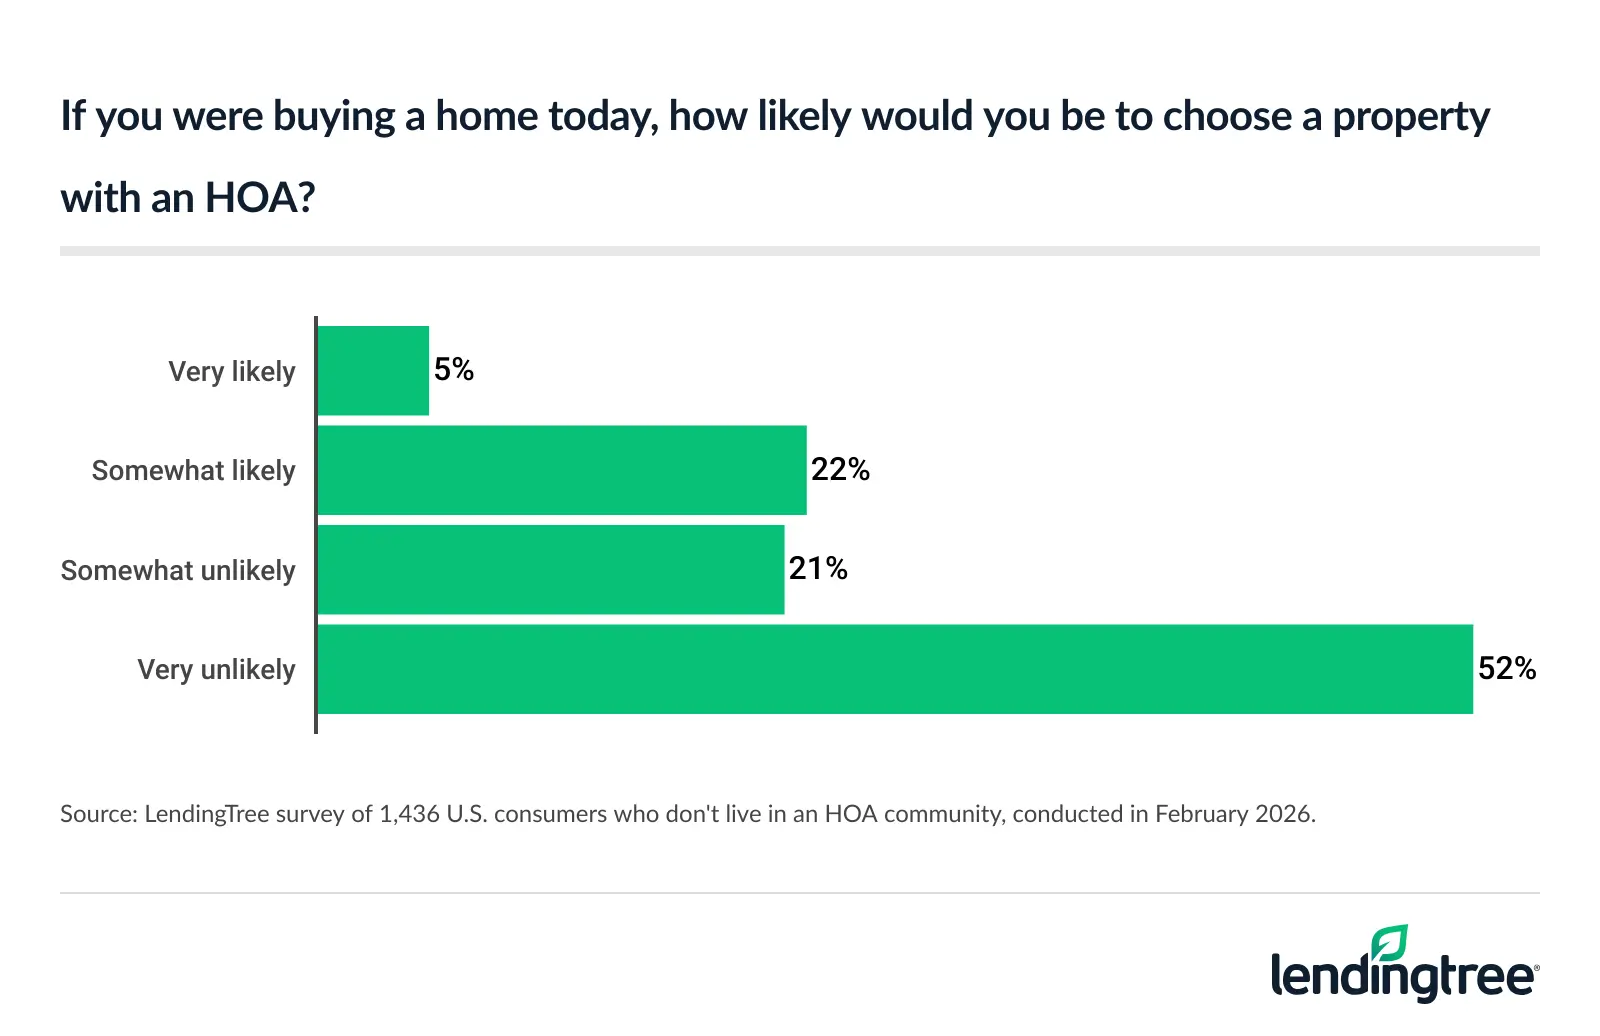
Meanwhile, 59% went further, saying they actively avoid HOA properties when searching for housing.
Buying into an HOA: Top due diligence tips
Understanding a community’s HOA is another step in the long list of tasks when buying a home, but it’s not one you should skip. We offer the following advice:
- Make sure you understand what you’re getting in return for those HOA fees. “That doesn’t mean you need to know every last task the HOA performs and service it provides, but you would be wise to have a broad feel for what’s offered to see if it’s worth the cost,” Schulz says. “Just how deep you dive should depend on just how much of a burden you feel those costs might be.”
- Factor HOA fees into your overall affordability. HOA dues can significantly impact your monthly housing costs, so it’s important to include them when determining your price range. Using a tool like a house affordability calculator can help you see how those fees affect what you can comfortably afford. Even a few hundred dollars a month in dues could shift your budget or change the type of home you pursue.
- Understand what type of HOA you’re dealing with. Not all HOAs operate the same way. Condo associations, townhome HOAs and single-family home HOAs often have different responsibilities, rules and fee structures. Reviewing the different types of HOAs can give you a clearer sense of what to expect in terms of maintenance obligations, shared amenities and oversight.
Methodology
LendingTree researchers analyzed the U.S. Census Bureau 2024 American Community Survey (ACS) with one-year estimates, the most recent data available.
For each of the 100 largest metropolitan statistical areas (MSAs), we calculated:
- The share of homeowners who pay HOA/condo fees of $500 or more a month, among homeowners who pay any HOA/condo fees
- The share of homeowners who pay HOA/condo fees of $1,000 or more a month, among homeowners who pay any HOA/condo fees
- The share of owner-occupied homes that pay any HOA or condo fees
- Median monthly HOA and/or condo fees
Additionally, LendingTree commissioned QuestionPro to conduct an online survey of 2,000 U.S. consumers ages 18 to 80 on Feb. 2-6, 2026. The survey was administered using a nonprobability-based sample, and quotas were used to ensure the sample base represented the overall population. Researchers reviewed all responses for quality control.
We defined generations as the following ages in 2026:
- Generation Z: 18 to 29
- Millennials: 30 to 45
- Generation X: 46 to 61
- Baby boomers: 62 to 80
View mortgage loan offers from up to 5 lenders in minutes