American Households Have $34.5 Trillion in Home Equity — See Where Your State Ranks


American households have $34.5 trillion in home equity as of the first quarter of 2025. That’s a significant $600 billion increase from Q1 2024 — and one that might unlock significantly higher home equity loan offers for some.
We’ll look at where homeowners get the highest and lowest average home equity loan offers — and offer some top expert tips on how to use the money wisely.
Key findings
- American households have $34.5 trillion in home equity as of the first quarter of 2025. That’s a $600 billion increase from Q1 2024 and a $4.7 trillion spike from Q1 2023, when they had $29.8 trillion in equity.
- Home equity loan offers top an average of $140,000 nationwide. Homeowners were offered an average of $144,330 in early 2025 — a significant 38.6% jump from $104,102 in early 2023.
- Home equity loan offers are highest in Hawaii, California and Utah. In the Aloha State, such loan offers average $493,143 — at least $160,000 above California ($326,923) and Utah ($323,702). These states also saw the biggest jumps in offer amounts between 2023 and 2025 at 323.0%, 258.2% and 227.7%, respectively.
- West Virginia, Iowa and Arkansas see the lowest home equity loan offers. Home equity loan offers in these states average $64,916, $72,817 and $81,645, respectively. Meanwhile, New Hampshire, Pennsylvania and West Virginia saw the biggest drops in offer amounts between 2023 and 2025 at 28.8%, 26.6% and 24.1%, respectively.
Home equity has risen $600 billion
As of the first quarter of 2025, American households have $34.5 trillion in home equity.
Comparatively, households had $33.9 trillion in home equity in Q1 2024 and $29.8 trillion in Q1 2023. That’s an increase of $600 billion and $4.7 trillion, respectively.
Matt Schulz — LendingTree chief consumer finance analyst and author of “Ask Questions, Save Money, Make More: How to Take Control of Your Financial Life” — says that’s significant.
“Housing prices continue to rise in much of the country while people stay put in their current homes, reluctant to trade their current low mortgage rate for the higher rate that would come with a new mortgage,” he says.
“The longer they stay in their home, the more of their mortgage they pay off. Combine that with increasing home prices and you get significantly higher home equity. That’s a big deal for homeowners.”
Home equity loan offers average $144,330
As home equity has risen, so have home equity loan offers. Homeowners were offered an average of $144,330 in early 2025. Meanwhile, they were offered an average of $104,102 in early 2023. That’s a 38.6% jump.
Schulz says higher home equity loan offers can open a lot of doors for homeowners. “That extra money can go toward doing a more substantial home renovation, consolidating other debts, paying educational expenses or even starting a small business,” he says. “Ultimately, it gives you options,” which can offer homeowners a lot of financial agency.
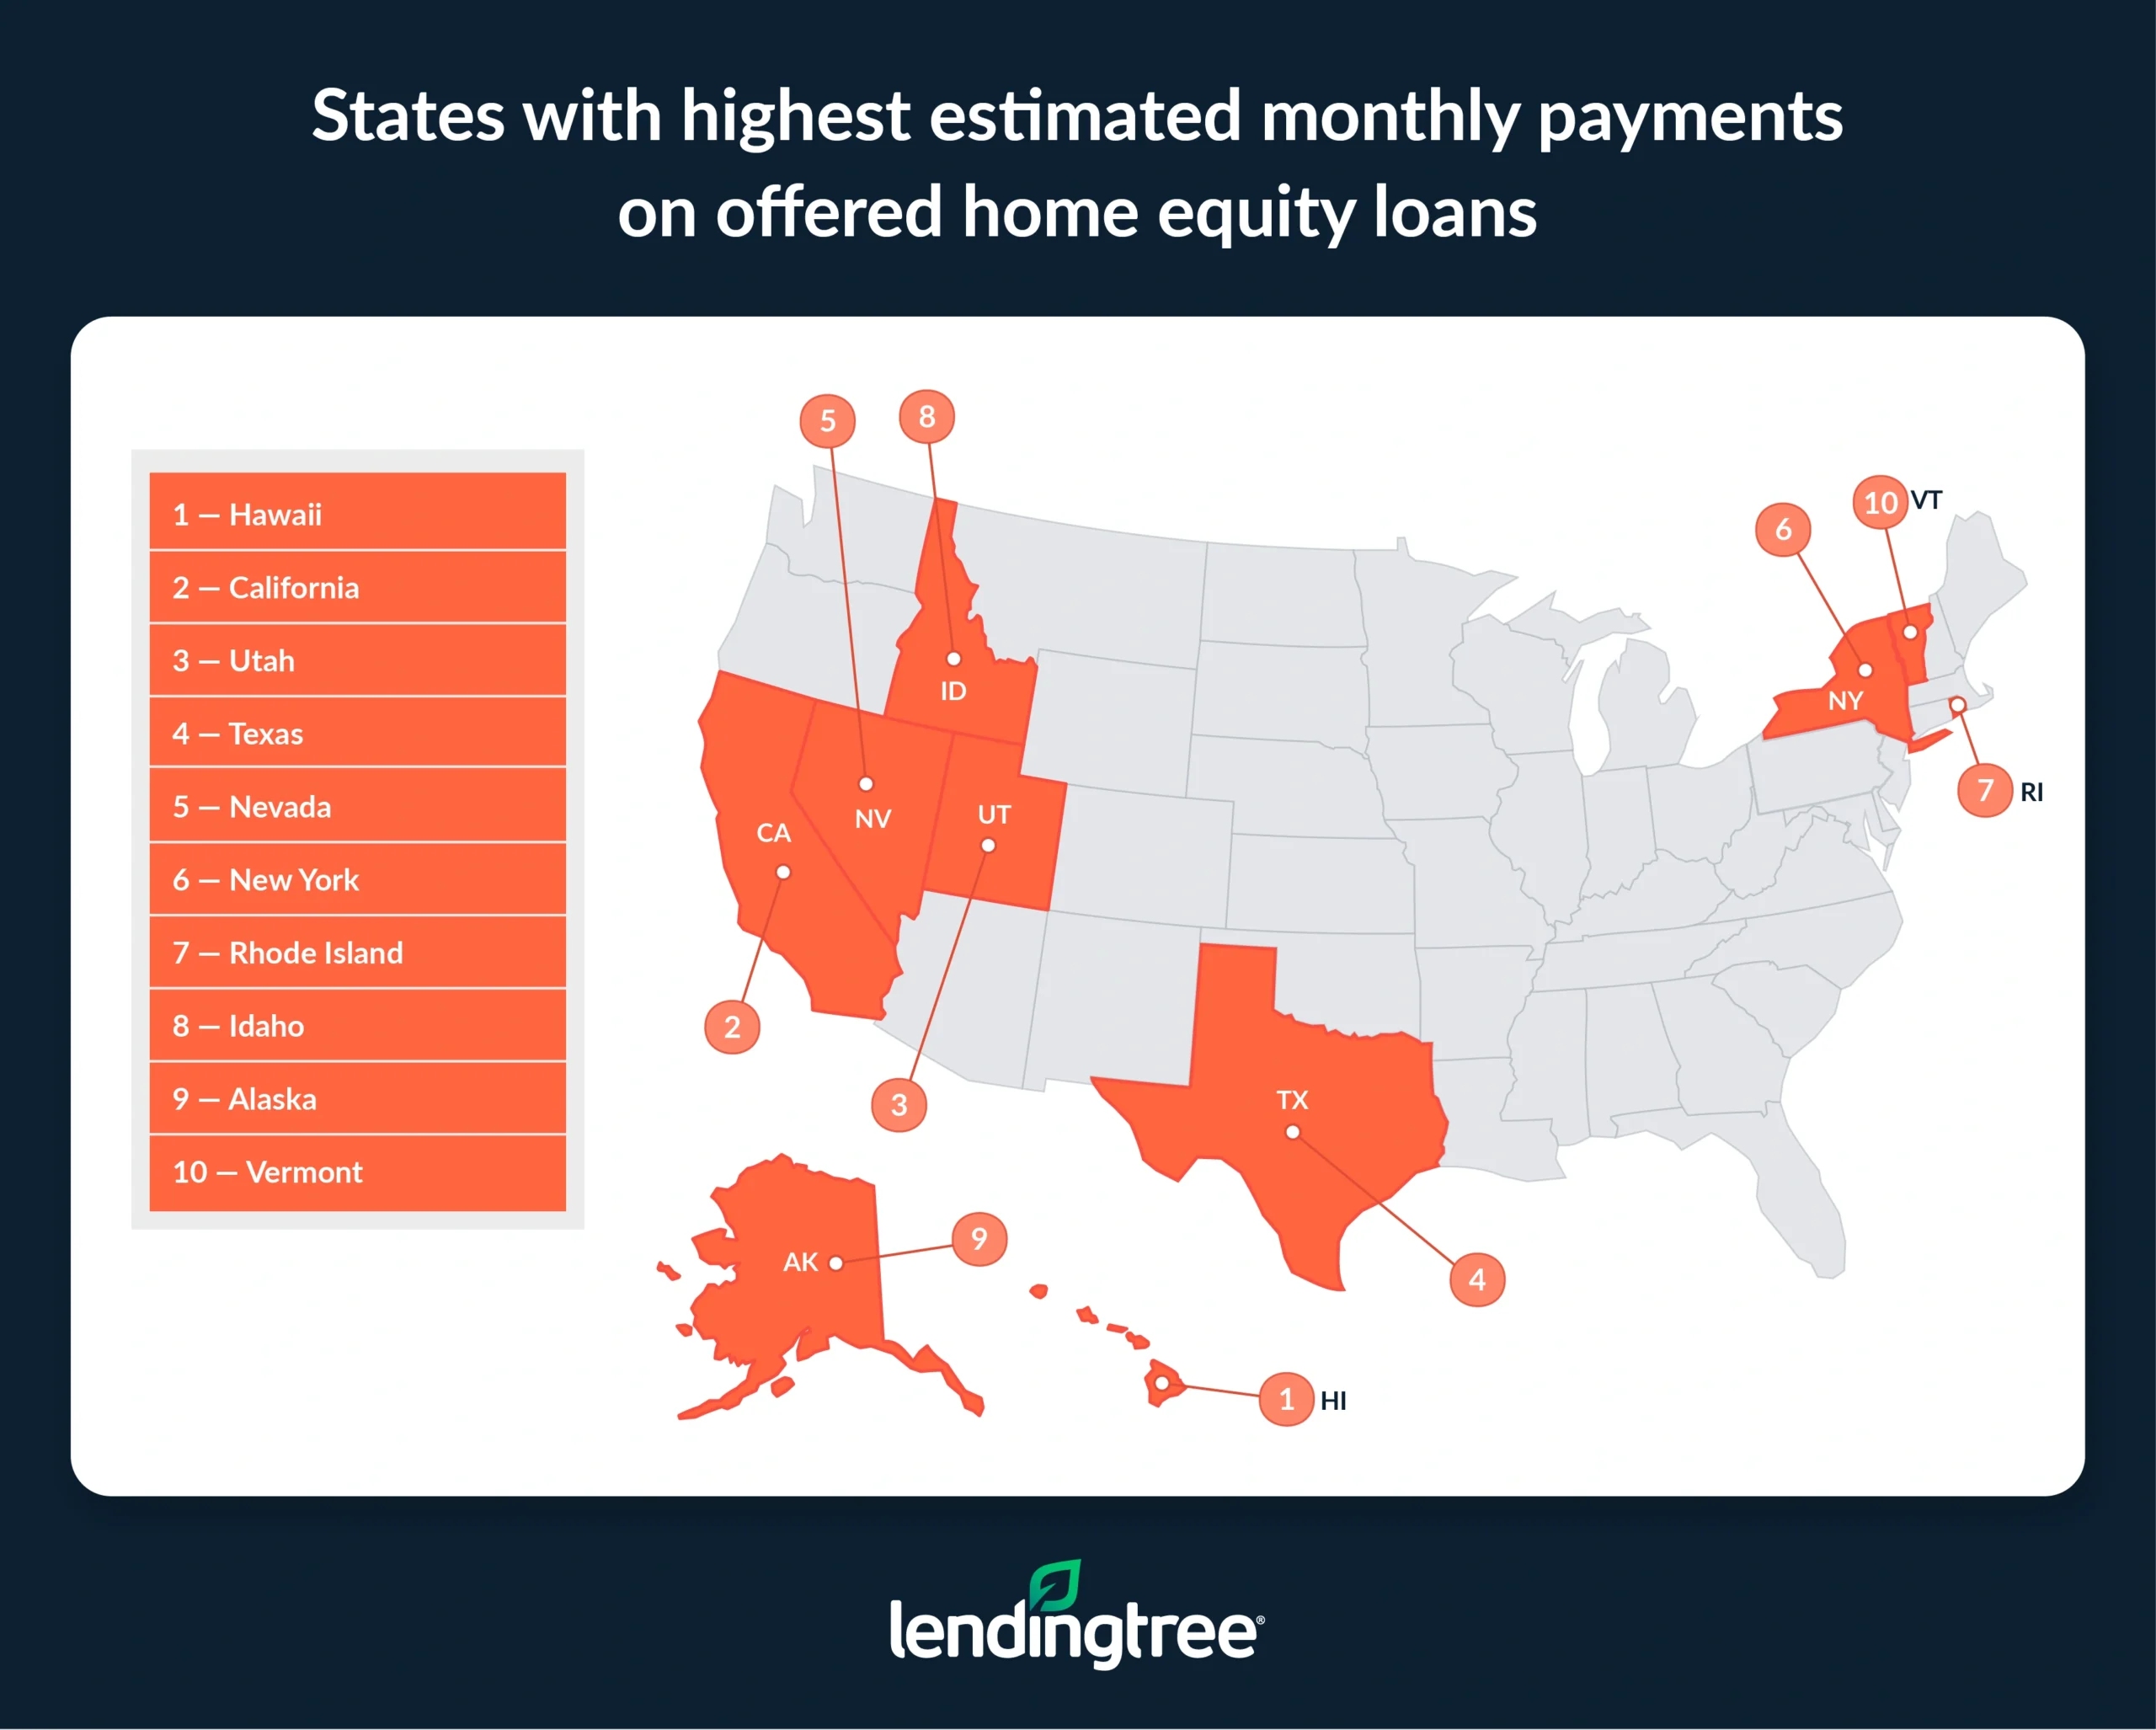
Estimated monthly payments on offered home equity loans depend on the loan amount and interest rate. The average monthly payment on these offers is $1,195, which represents 13.0% of U.S. households’ monthly income on average.
Loan offers highest in Hawaii
By state, home equity loan offers are highest in Hawaii at an average of $493,143. That’s significantly higher than the next highest state, California, where loan offers average $326,923. Utah ($323,702) ranks third.
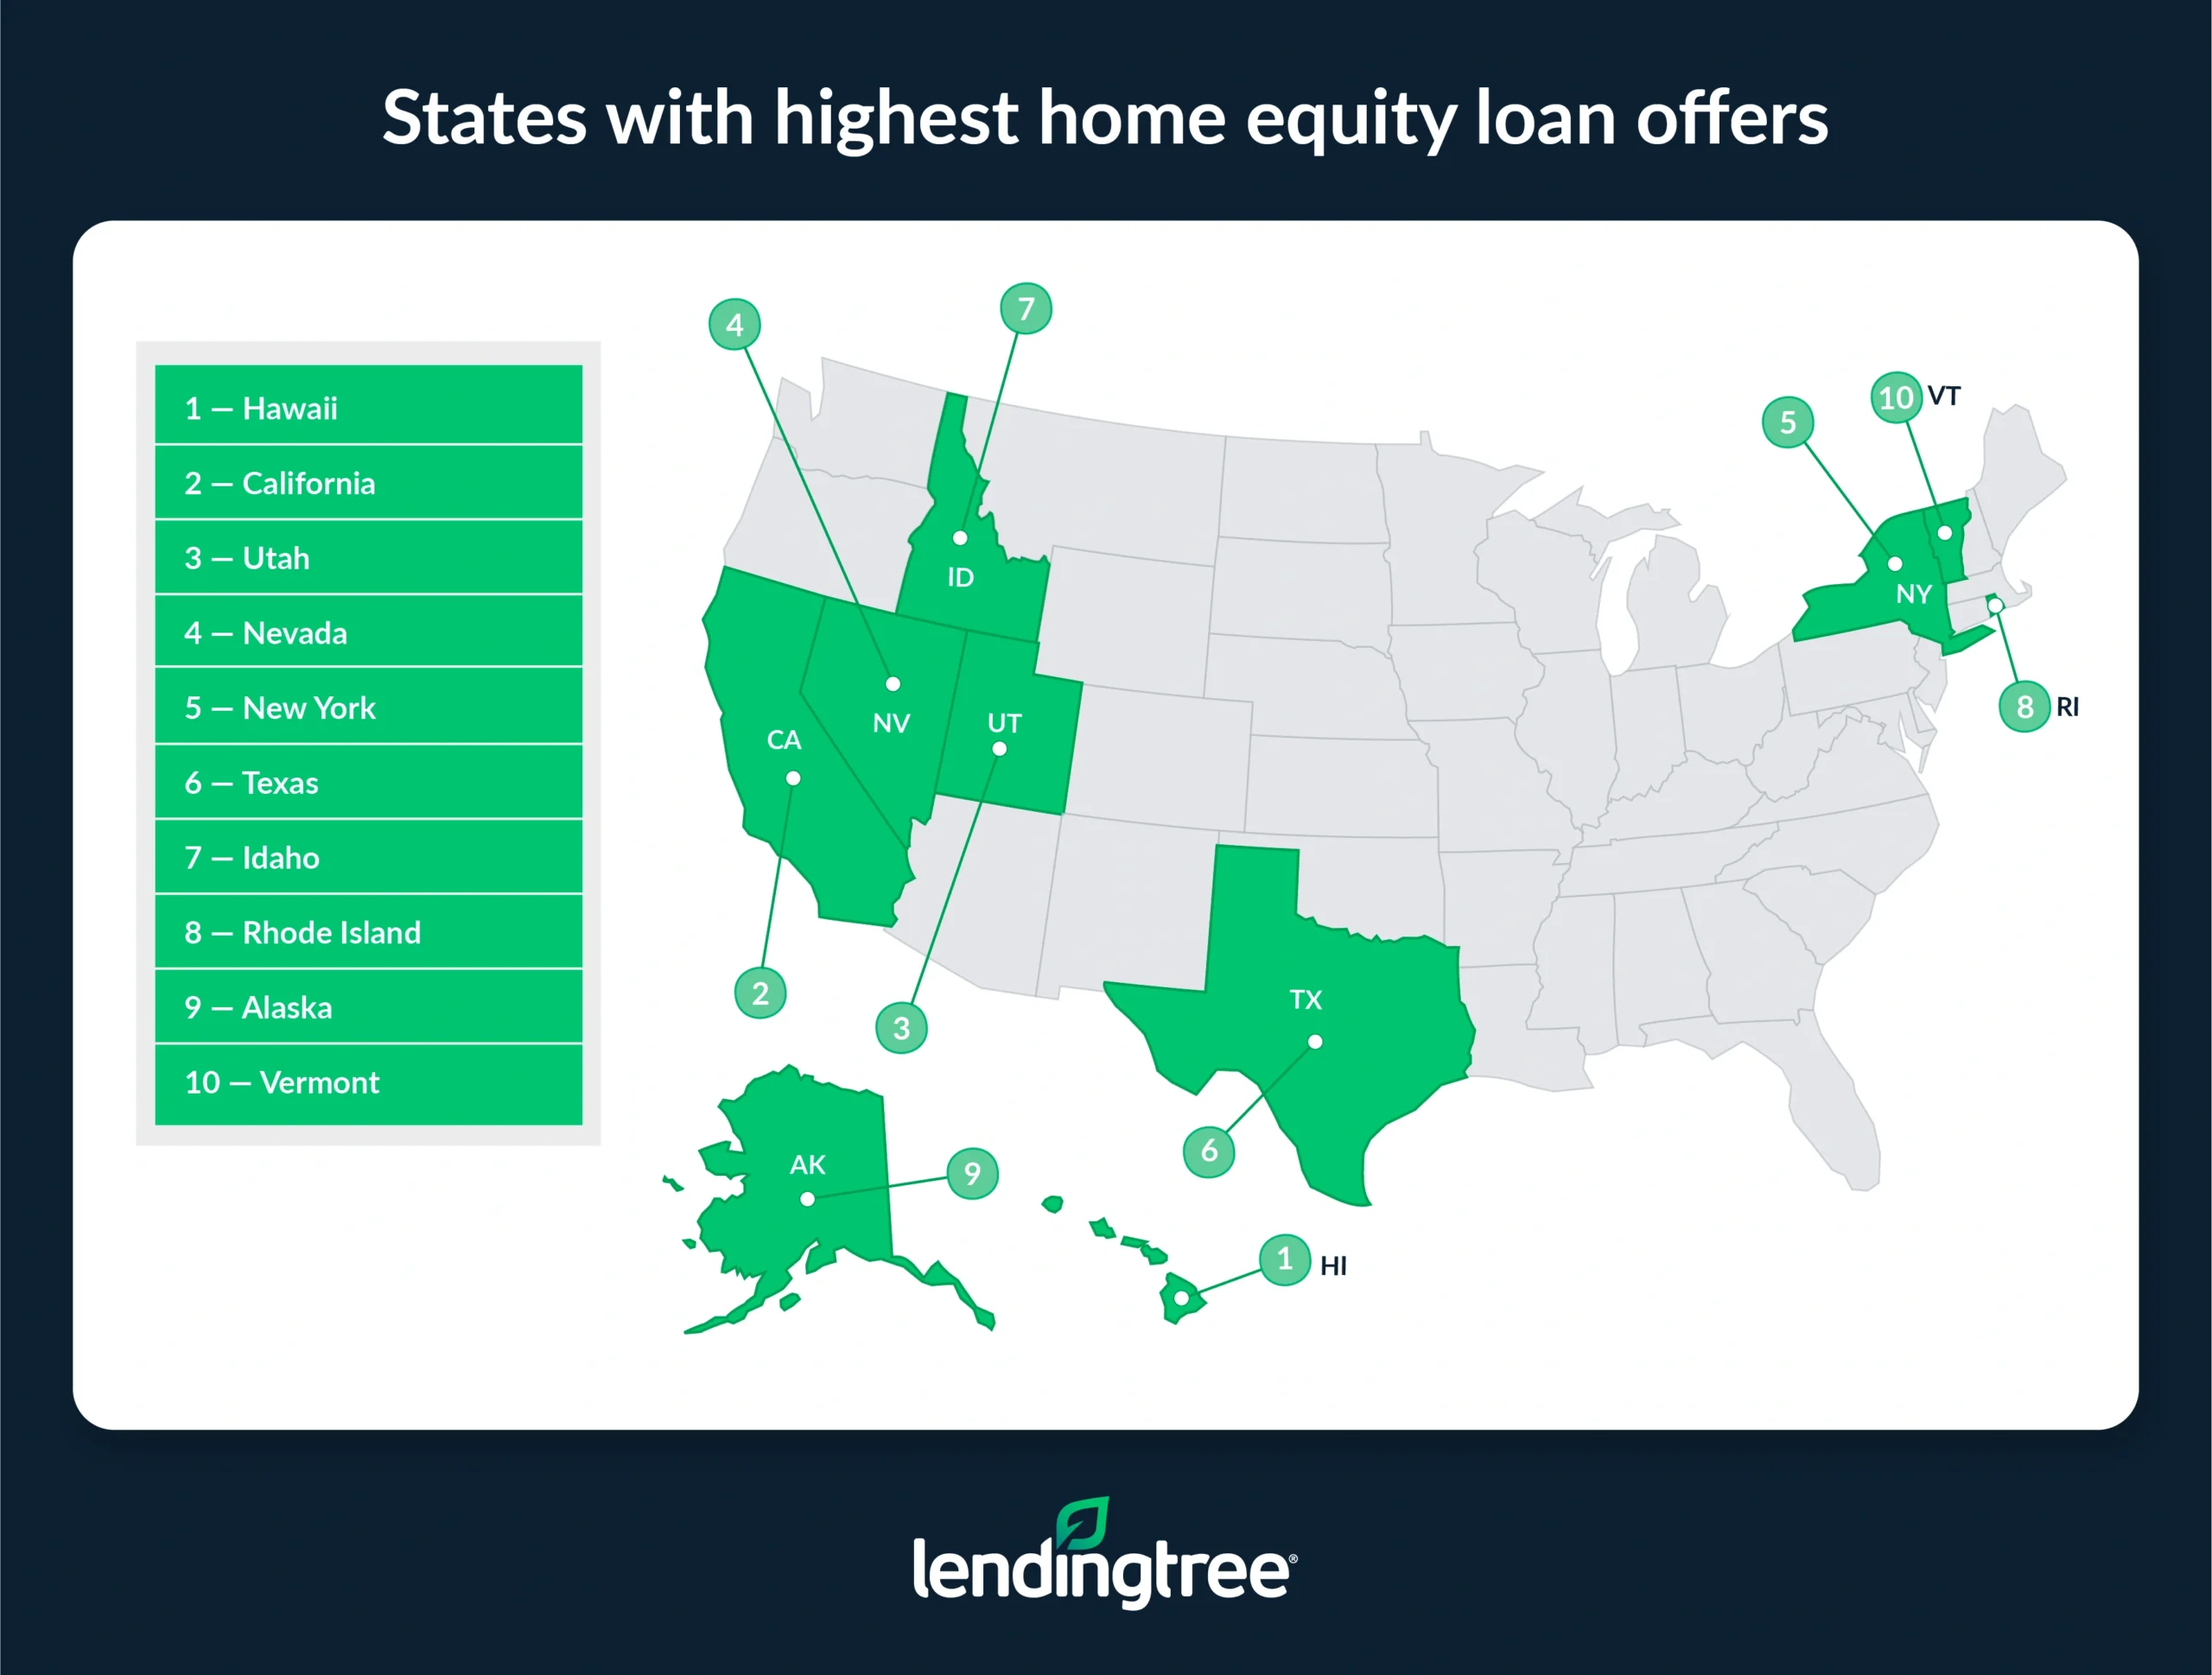
These states saw the biggest jumps in offer amounts between 2023 and 2025 at a massive 323.0%, 258.2% and 227.7%, respectively.
For homeowners in these states looking to capitalize on their equity, Schulz says there are a few things to keep in mind.
“Home equity loans can be great when you’re looking to finance a large, one-time expense with relatively low interest rates,” he says.
“A home remodel is certainly a popular use of these loans because of the potential return on investment. After all, it’s easier to feel good about borrowing against the equity in your home when you know the funds are going toward something that should ultimately help your home become more valuable.”
It’s easier to feel good about borrowing against the equity in your home when you know the funds are going toward something that should ultimately help your home become more valuable.

Naturally, the states with the highest offers also have the highest payment amounts. In Hawaii, the average monthly payment is $4,223. Those figures are $2,740 in California and $2,713 in Utah.
Unsurprisingly, the states with the highest home equity offers also tend to have among the highest median home values. Hawaii leads at $808,200, while California ($695,400) is third. The five states with the highest average loan offers are among the 11 with the highest median values.
West Virginia sees lowest loan offers
Conversely, West Virginia has the lowest home equity loan offers at an average of $64,916. Iowa ($72,817) and Arkansas ($81,645) follow.
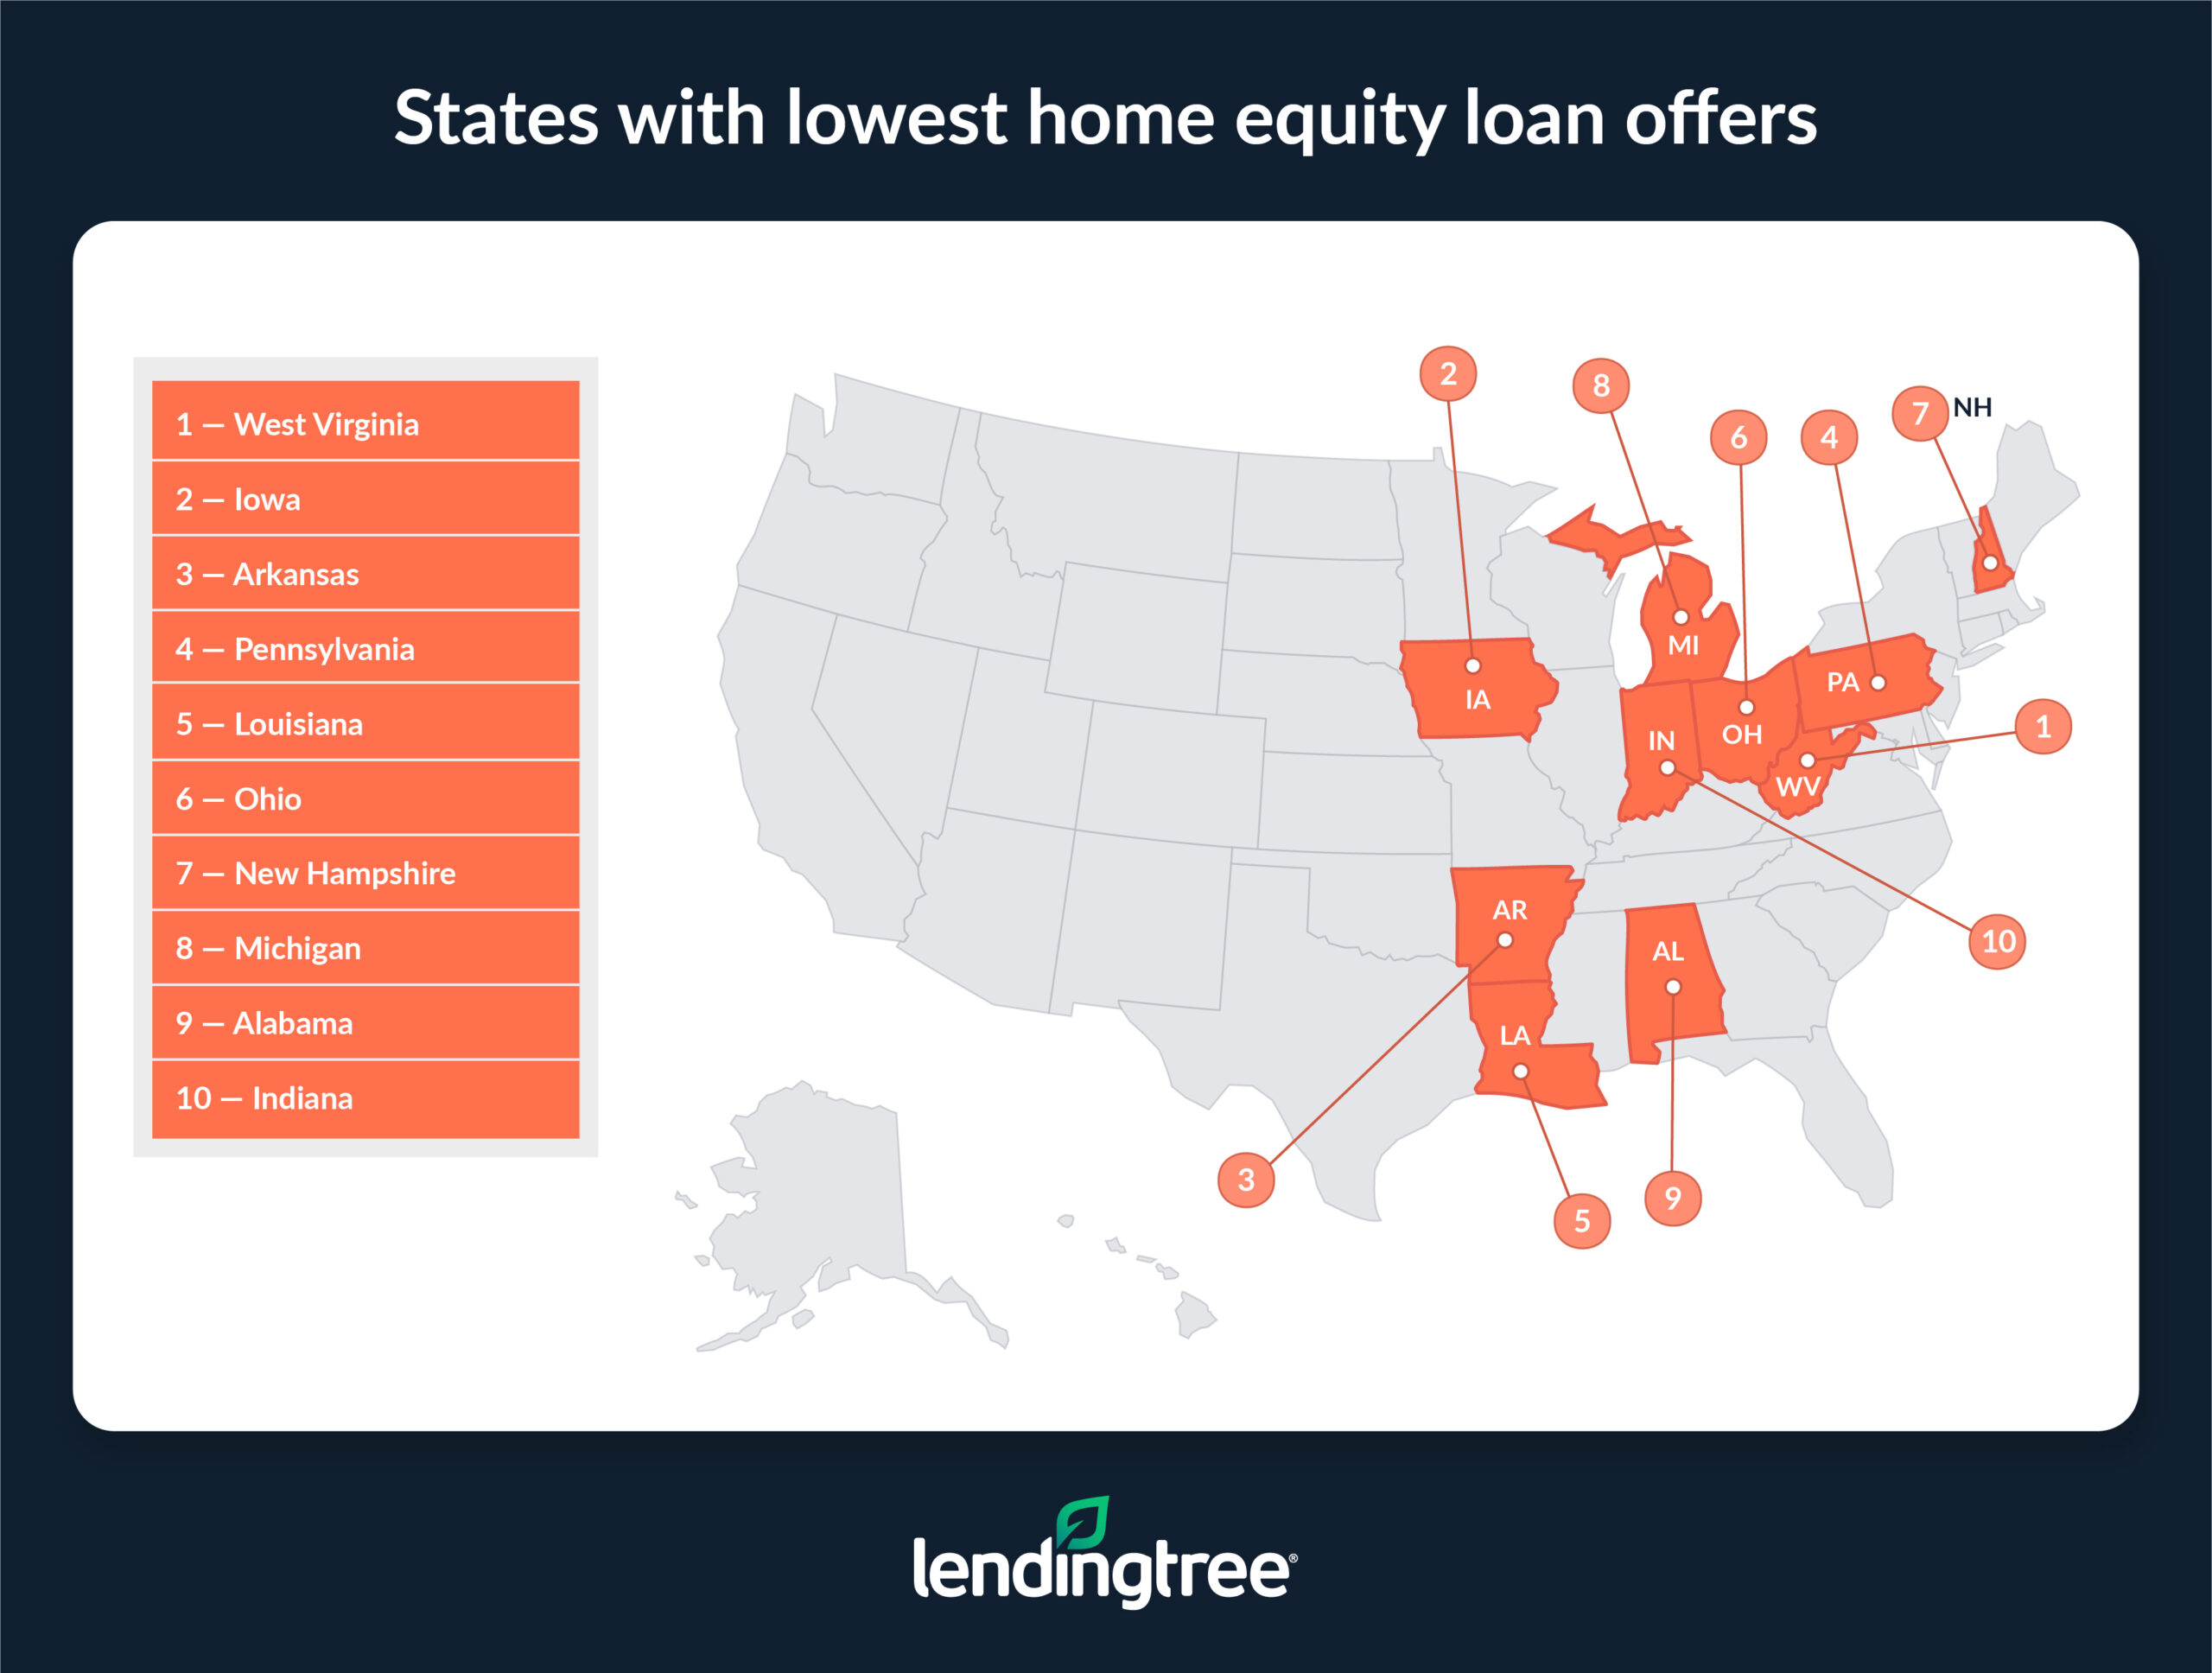
Meanwhile, New Hampshire saw the biggest drop in offer amounts between 2023 and 2025 at 28.8%. Pennsylvania and West Virginia followed at 26.6% and 24.1%, respectively.
The gap in offers is also growing. In 2023, the highest offers were about twice as large as the lowest. Today, Hawaii’s average loan offer is more than seven times that of West Virginia.
West Virginia also ranks lowest for monthly payments ($502) and median home value ($155,600). Iowa and Arkansas have the next lowest average monthly payments at an average of $602 and $663, respectively. Mississippi ($161,400) and Arkansas ($175,300) rank second and third for lowest median home values.
Interest rates vary slightly
Offered interest rates vary less than loan amounts, but they still differ. The average interest rate offered on home equity loans across the U.S. is 7.37%, with West Virginia and New Hampshire tying for the lowest rate at 7.07%.
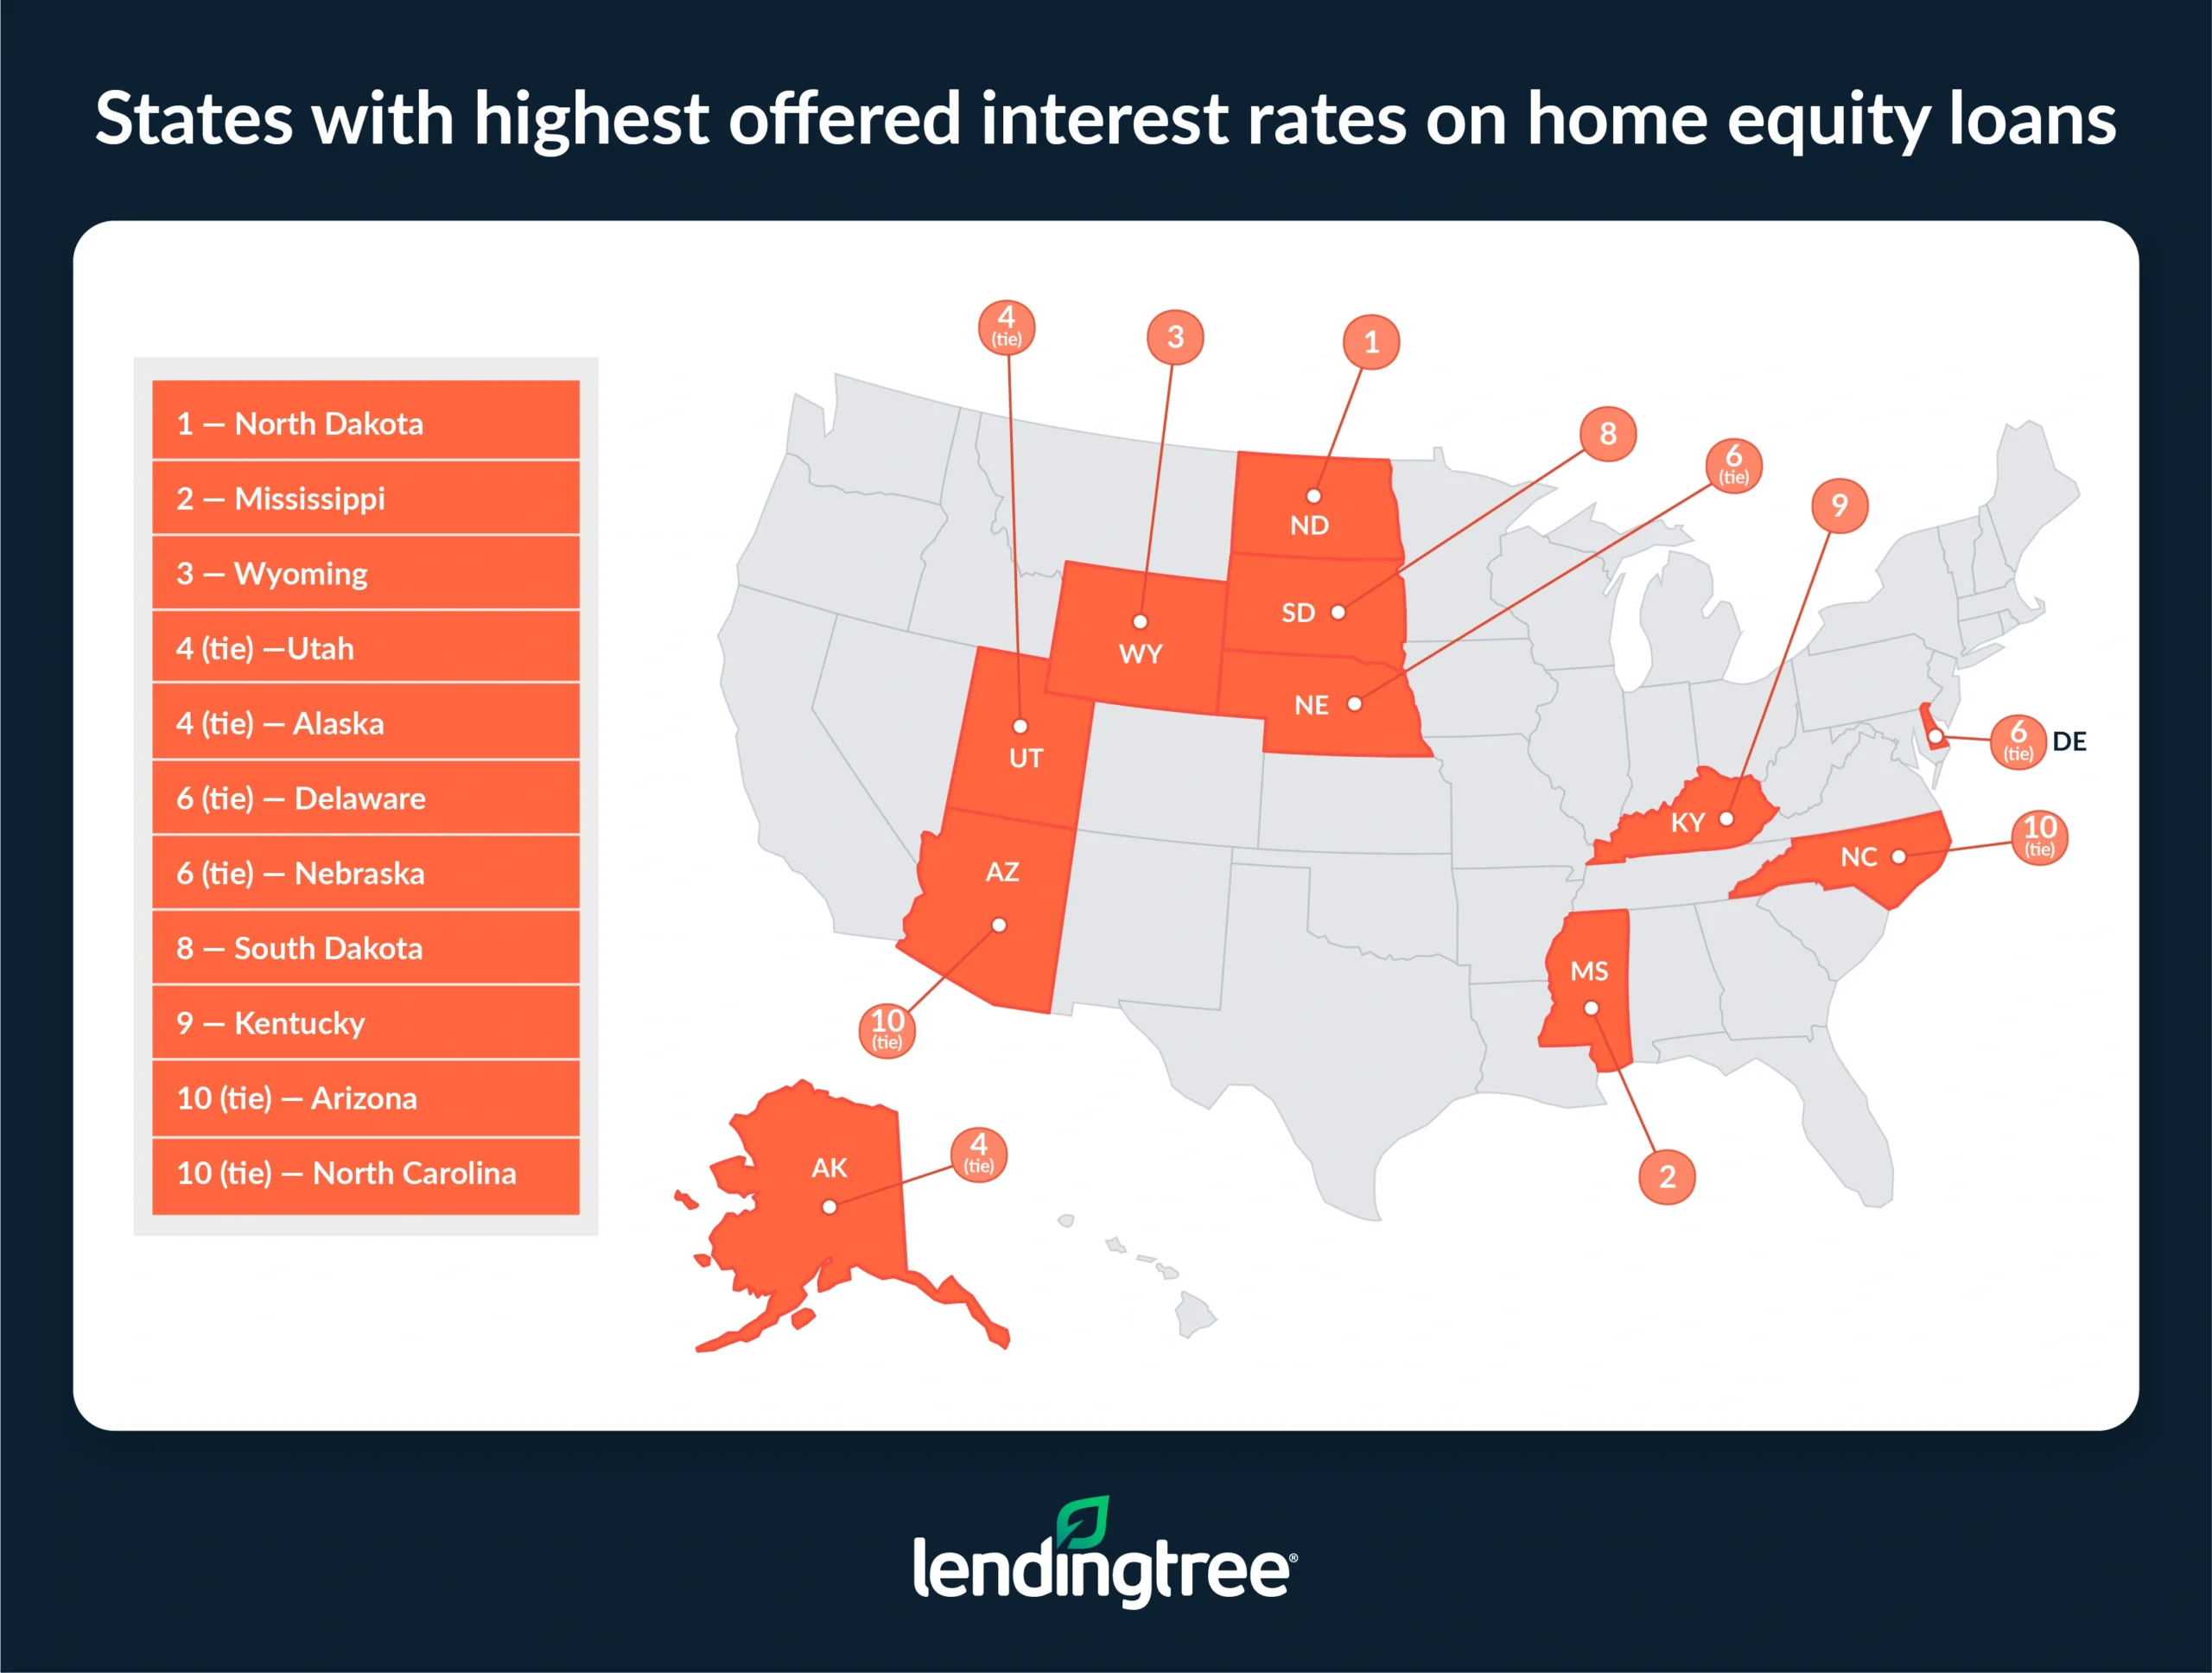
At the other end of the spectrum, North Dakota has the highest rate at 7.94%. Mississippi (7.84%) and Wyoming (7.82%) follow.
Full rankings: States where homeowners are offered the largest/smallest home equity loans
| Rank | State | Avg. offered HEL amount | Avg. offered HEL interest rate | Avg. offered HEL monthly payment |
|---|---|---|---|---|
| 1 | Hawaii | $493,143 | 7.69% | $4,223 |
| 2 | California | $326,923 | 7.51% | $2,740 |
| 3 | Utah | $323,702 | 7.81% | $2,713 |
| 4 | Nevada | $276,482 | 7.65% | $2,374 |
| 5 | New York | $274,731 | 7.60% | $2,248 |
| 6 | Texas | $273,581 | 7.67% | $2,422 |
| 7 | Idaho | $251,795 | 7.60% | $2,138 |
| 8 | Rhode Island | $251,632 | 7.63% | $2,151 |
| 9 | Alaska | $236,571 | 7.81% | $2,050 |
| 10 | Vermont | $227,016 | 7.62% | $1,908 |
| 11 | Montana | $221,888 | 7.61% | $1,893 |
| 12 | Arizona | $221,155 | 7.70% | $1,871 |
| 13 | New Mexico | $207,660 | 7.67% | $1,746 |
| 14 | Washington | $203,700 | 7.34% | $1,697 |
| 15 | Delaware | $195,179 | 7.79% | $1,663 |
| 16 | Wyoming | $189,925 | 7.82% | $1,618 |
| 17 | Massachusetts | $179,263 | 7.15% | $1,460 |
| 18 | South Dakota | $171,139 | 7.73% | $1,469 |
| 19 | Maryland | $168,042 | 7.34% | $1,380 |
| 20 | North Dakota | $165,033 | 7.94% | $1,441 |
| 21 | Tennessee | $156,518 | 7.47% | $1,292 |
| 22 | Kentucky | $154,849 | 7.72% | $1,302 |
| 23 | Nebraska | $153,803 | 7.79% | $1,323 |
| 24 | Missouri | $153,403 | 7.69% | $1,312 |
| 25 | North Carolina | $150,326 | 7.70% | $1,265 |
| 26 | Oregon | $147,358 | 7.20% | $1,199 |
| 27 | South Carolina | $142,548 | 7.37% | $1,168 |
| 28 | Colorado | $140,595 | 7.24% | $1,159 |
| 29 | Mississippi | $140,447 | 7.84% | $1,213 |
| 30 | Kansas | $138,275 | 7.67% | $1,184 |
| 31 | Maine | $130,875 | 7.24% | $1,071 |
| 32 | Oklahoma | $129,864 | 7.48% | $1,076 |
| 33 | Virginia | $124,964 | 7.31% | $1,032 |
| 34 | New Jersey | $117,651 | 7.14% | $948 |
| 35 | Minnesota | $116,438 | 7.25% | $959 |
| 36 | Florida | $114,753 | 7.31% | $935 |
| 37 | Wisconsin | $114,479 | 7.32% | $942 |
| 38 | Connecticut | $111,786 | 7.18% | $906 |
| 39 | Illinois | $109,572 | 7.33% | $908 |
| 40 | Georgia | $109,571 | 7.31% | $891 |
| 41 | Indiana | $98,070 | 7.39% | $808 |
| 42 | Alabama | $96,544 | 7.39% | $800 |
| 43 | Michigan | $96,462 | 7.34% | $788 |
| 44 | New Hampshire | $96,162 | 7.07% | $771 |
| 45 | Ohio | $88,229 | 7.46% | $723 |
| 46 | Louisiana | $87,467 | 7.40% | $730 |
| 47 | Pennsylvania | $86,663 | 7.41% | $710 |
| 48 | Arkansas | $81,645 | 7.29% | $663 |
| 49 | Iowa | $72,817 | 7.38% | $602 |
| 50 | West Virginia | $64,916 | 7.07% | $502 |
Full rankings: Change in home equity loan amounts offered to homeowners
| Rank | State | % change | Avg. offered HEL amount, 2025 | Avg. offered HEL amount, in 2023 |
|---|---|---|---|---|
| 1 | Hawaii | 323.0% | $493,143 | $116,590 |
| 2 | California | 258.2% | $326,923 | $91,262 |
| 3 | Utah | 227.7% | $323,702 | $98,780 |
| 4 | Nevada | 223.0% | $276,482 | $85,608 |
| 5 | Texas | 205.0% | $273,581 | $89,707 |
| 6 | Idaho | 175.7% | $251,795 | $91,343 |
| 7 | Arizona | 165.9% | $221,155 | $83,160 |
| 8 | New Mexico | 165.8% | $207,660 | $78,125 |
| 9 | Alaska | 160.7% | $236,571 | $90,752 |
| 10 | Montana | 135.3% | $221,888 | $94,319 |
| 11 | Wyoming | 119.3% | $189,925 | $86,587 |
| 12 | North Dakota | 118.5% | $165,033 | $75,514 |
| 13 | Washington | 115.5% | $203,700 | $94,543 |
| 14 | South Dakota | 102.6% | $171,139 | $84,476 |
| 15 | Missouri | 99.8% | $153,403 | $76,791 |
| 16 | New York | 93.5% | $274,731 | $141,951 |
| 17 | Nebraska | 92.8% | $153,803 | $79,780 |
| 18 | Rhode Island | 87.7% | $251,632 | $134,089 |
| 19 | Mississippi | 86.7% | $140,447 | $75,228 |
| 20 | Kansas | 77.5% | $138,275 | $77,886 |
| 21 | Vermont | 67.9% | $227,016 | $135,170 |
| 22 | Delaware | 66.6% | $195,179 | $117,151 |
| 23 | Kentucky | 61.8% | $154,849 | $95,679 |
| 24 | Oregon | 58.4% | $147,358 | $93,034 |
| 25 | Oklahoma | 35.7% | $129,864 | $95,731 |
| 26 | Tennessee | 31.7% | $156,518 | $118,850 |
| 27 | Maryland | 31.6% | $168,042 | $127,679 |
| 28 | Massachusetts | 23.0% | $179,263 | $145,788 |
| 29 | North Carolina | 21.2% | $150,326 | $124,080 |
| 30 | South Carolina | 15.8% | $142,548 | $123,068 |
| 31 | Louisiana | 13.9% | $87,467 | $76,810 |
| 32 | Wisconsin | 13.2% | $114,479 | $101,173 |
| 33 | Indiana | 6.3% | $98,070 | $92,271 |
| 34 | Colorado | 5.5% | $140,595 | $133,305 |
| 35 | Virginia | 4.6% | $124,964 | $119,436 |
| 36 | Minnesota | 2.8% | $116,438 | $113,250 |
| 36 | Illinois | 2.8% | $109,572 | $106,545 |
| 38 | Maine | 2.7% | $130,875 | $127,458 |
| 39 | Arkansas | -0.3% | $81,645 | $81,890 |
| 40 | Georgia | -5.4% | $109,571 | $115,778 |
| 41 | Alabama | -5.5% | $96,544 | $102,167 |
| 42 | Florida | -7.6% | $114,753 | $124,247 |
| 43 | Ohio | -8.7% | $88,229 | $96,611 |
| 44 | Iowa | -9.4% | $72,817 | $80,354 |
| 45 | Michigan | -10.7% | $96,462 | $107,967 |
| 46 | New Jersey | -12.7% | $117,651 | $134,817 |
| 47 | Connecticut | -13.7% | $111,786 | $129,574 |
| 48 | West Virginia | -24.1% | $64,916 | $85,551 |
| 49 | Pennsylvania | -26.6% | $86,663 | $118,105 |
| 50 | New Hampshire | -28.8% | $96,162 | $135,064 |
Considering a home equity loan? Top expert tips
Home equity loans can be useful — particularly if you’re sitting on a lot more equity than before. If you’re considering a home equity loan, here are a few things to consider before jumping in:
- Shop around. “Sometimes the oldest advice is the best,” Schulz says. “Taking the time to compare offers from multiple lenders can make a big difference in the terms you receive. That’s important with any loan, but especially with one as big as a home equity loan.”
- Don’t overlook the risks. “Any time you’re using your home as collateral, it shouldn’t be done lightly,” he says. “If you’re not comfortable with that risk, don’t get a home equity loan. That’s OK. There are likely other options available to you that’ll allow you to sleep better at night. That matters.”
- Only take what you need. “It can be flattering to be offered a loan for $100,000, right?” he says. “That doesn’t mean you need it or that you can actually afford it, though. Before you apply for the loan, take the time to crunch the numbers and determine how much money you need to accomplish your goal. For example, if that kitchen remodel is going to cost you $20,000, don’t borrow $50,000 just because you can. It makes a difference.”
Methodology
LendingTree analyzed about 700,000 home equity loans offered to users of the LendingTree platform across the nation’s 50 states from Jan. 1 to May 31, 2025. We calculated the average loan amount offered, the average interest rate and the average monthly payment.
This analysis focuses on home equity loans and doesn’t include home equity lines of credit (HELOCs). The data reflects the state where the property is located rather than the borrower’s state of residence.
View mortgage loan offers from up to 5 lenders in minutes