LendingTree Finds that Google Searches for ‘Homes for Sale’ Could Fall 63% by End of May, Indicating Slowdown in Home Sales

At the beginning of 2020, low mortgage rates and strong home sales data hinted that the housing market was poised for growth. In February, nearly 5.8 million existing homes were sold in the United States, up 7.2% from a year ago. During the same period, 765,000 new homes were sold in the U.S., an increase of 14.3% from February 2019. In January, the number of new homes sold in the United States hit its highest level since 2007.
Things look a lot different today as the coronavirus outbreak has plunged economic markets into turmoil and the economy slows. As a result, Americans are changing their spending habits and tightening their financial belts, with many putting home-shopping on the back burner.
One way to gauge people’s interest in purchasing homes is to measure internet searches, especially because most homebuyers start the process online. With that in mind, LendingTree analyzed Google search data to see how popular the search term “homes for sale” is in 50 of the nation’s largest metros. Google defines search popularity using what LendingTree calls “search-interest values.” These values exist on a scale of 0 to 100; 100 means the search term is at peak popularity.
LendingTree found that while people searching for “homes for sale” grew from 2019 to early 2020, search interest in the term has declined significantly over the past few weeks.
Additionally, LendingTree also calculated what the search popularity may be in the coming weeks. It is difficult to predict how the virus will continue to impact the economy and consumer behavior; however, if the decline in homebuying search interest persists, the average search-interest value across these 50 metros could drop from an average of 90.3 at its peak this year to 32.5 by the end of May. Ultimately, this could be an indicator of a significant slowdown in home sales.
Key findings
- Searches for “homes for sale” have fallen across all 50 of the metros analyzed in LendingTree’s study. The average decline was 32% from each metro’s 2020 peak value.
- Tucson, Ariz., Columbus, Ohio and San Diego have seen the largest drops in search interest. The average decline in these metros was 45% of their peak 2020 values, bringing their search-interest values down to 43, 48 and 57, respectively.
- Charlotte, N.C., Raleigh, N.C. and Austin, Texas, have seen the smallest declines. In these three metros, the popularity of the search term has fallen only 19% from its peak value, with current search-interest values of 71, 70 and 73, respectively.
- If the impact of COVID-19 remains substantial over the next two months, then searches could fall an average of 63% across all metros from their 2019 values. This will result in an average search-interest value of 32.5, and likely signify a large decline in home sales across the 50 metros LendingTree analyzed.
- By the end of May, Tucson, Ariz., Columbus, Ohio and Phoenix will likely see the largest declines in search interest. Search interest might plummet 89% from its May 2019 value in these metros. Conversely, Austin, St. Louis and Raleigh could see a small, yet still significant, decline of 35%.
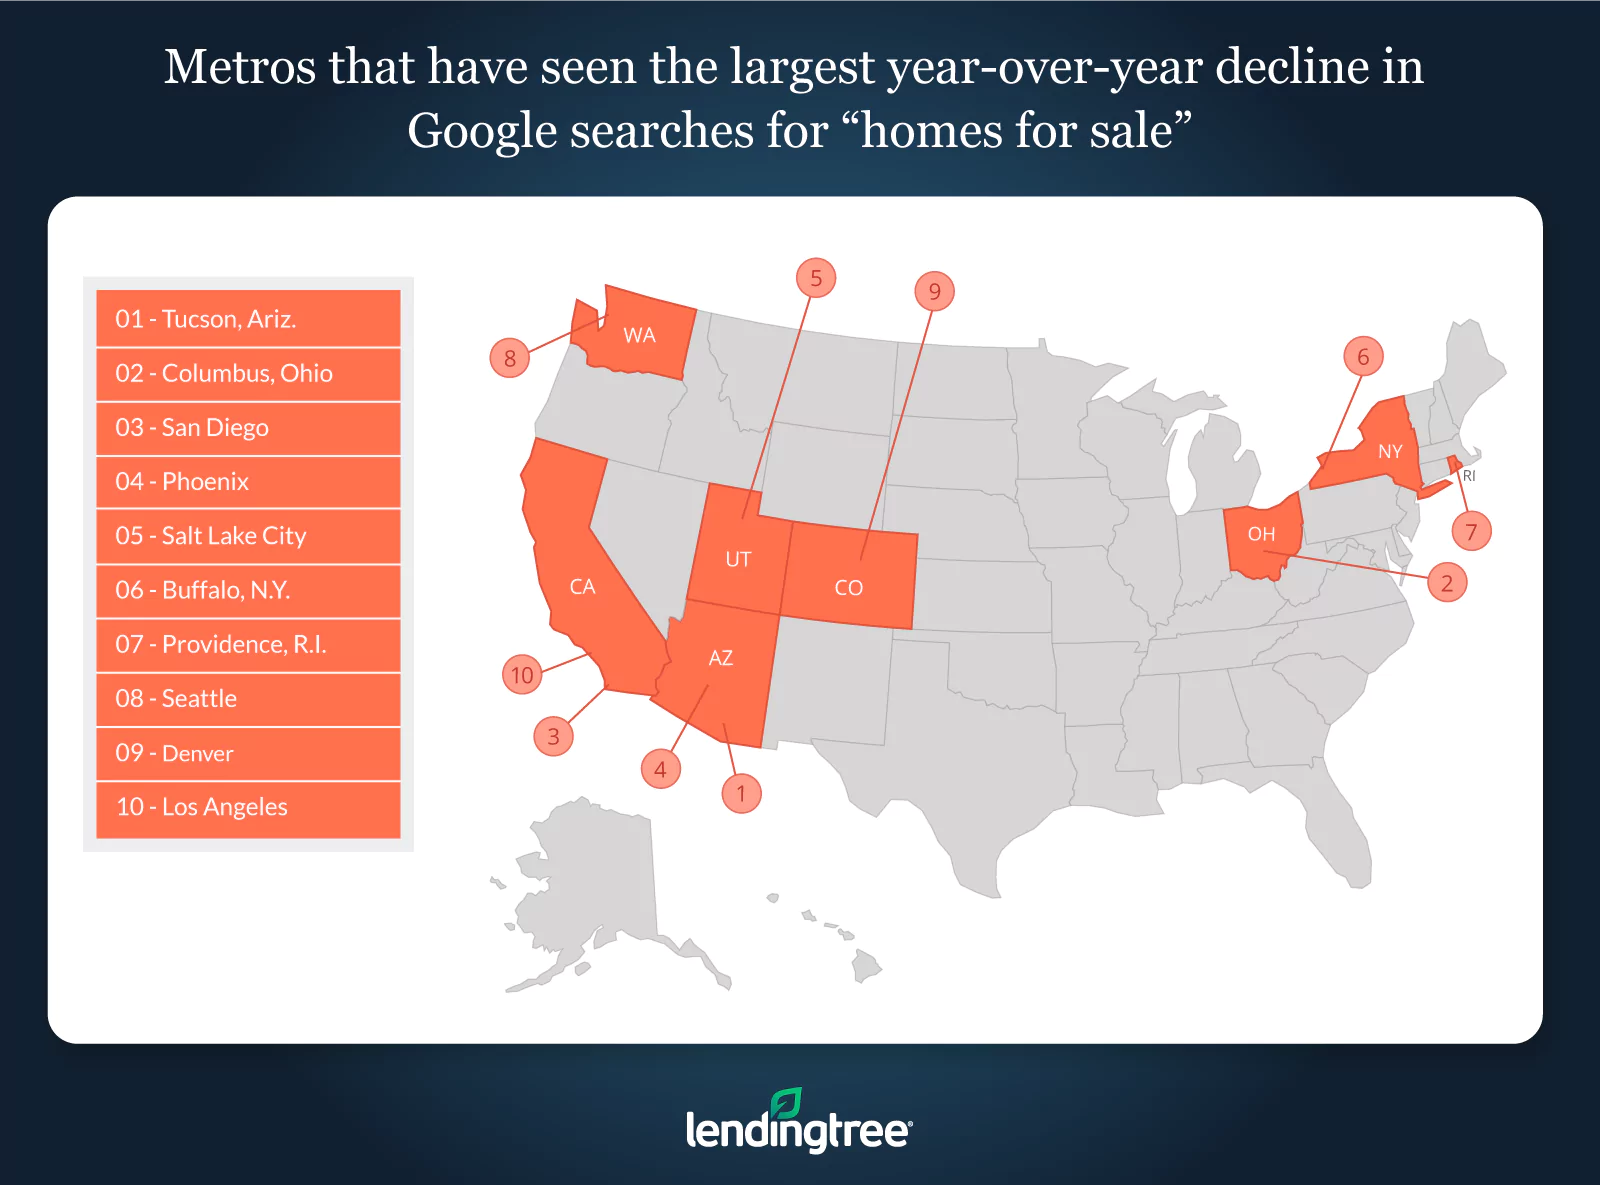
Metros that have seen the largest year-over-year decline in Google searches for ‘homes for sale’
No. 1: Tucson, Ariz.
- Peak 2020 search-interest value: 83
- Year-over-year % growth in searches from 2019 to peak 2020 value: 10.7%
- % decline from 2020 peak to present: -48.2%
No. 2: Columbus, Ohio
- Peak 2020 search-interest value: 85
- Year-over-year % growth in searches from 2019 to peak 2020 value: 4.9%
- % decline from 2020 peak to present: -43.5%
No. 3: San Diego
- Peak 2020 search-interest value: 100
- Year-over-year % growth in searches from 2019 to peak 2020 value: 25%
- % decline from 2020 peak to present: -43%
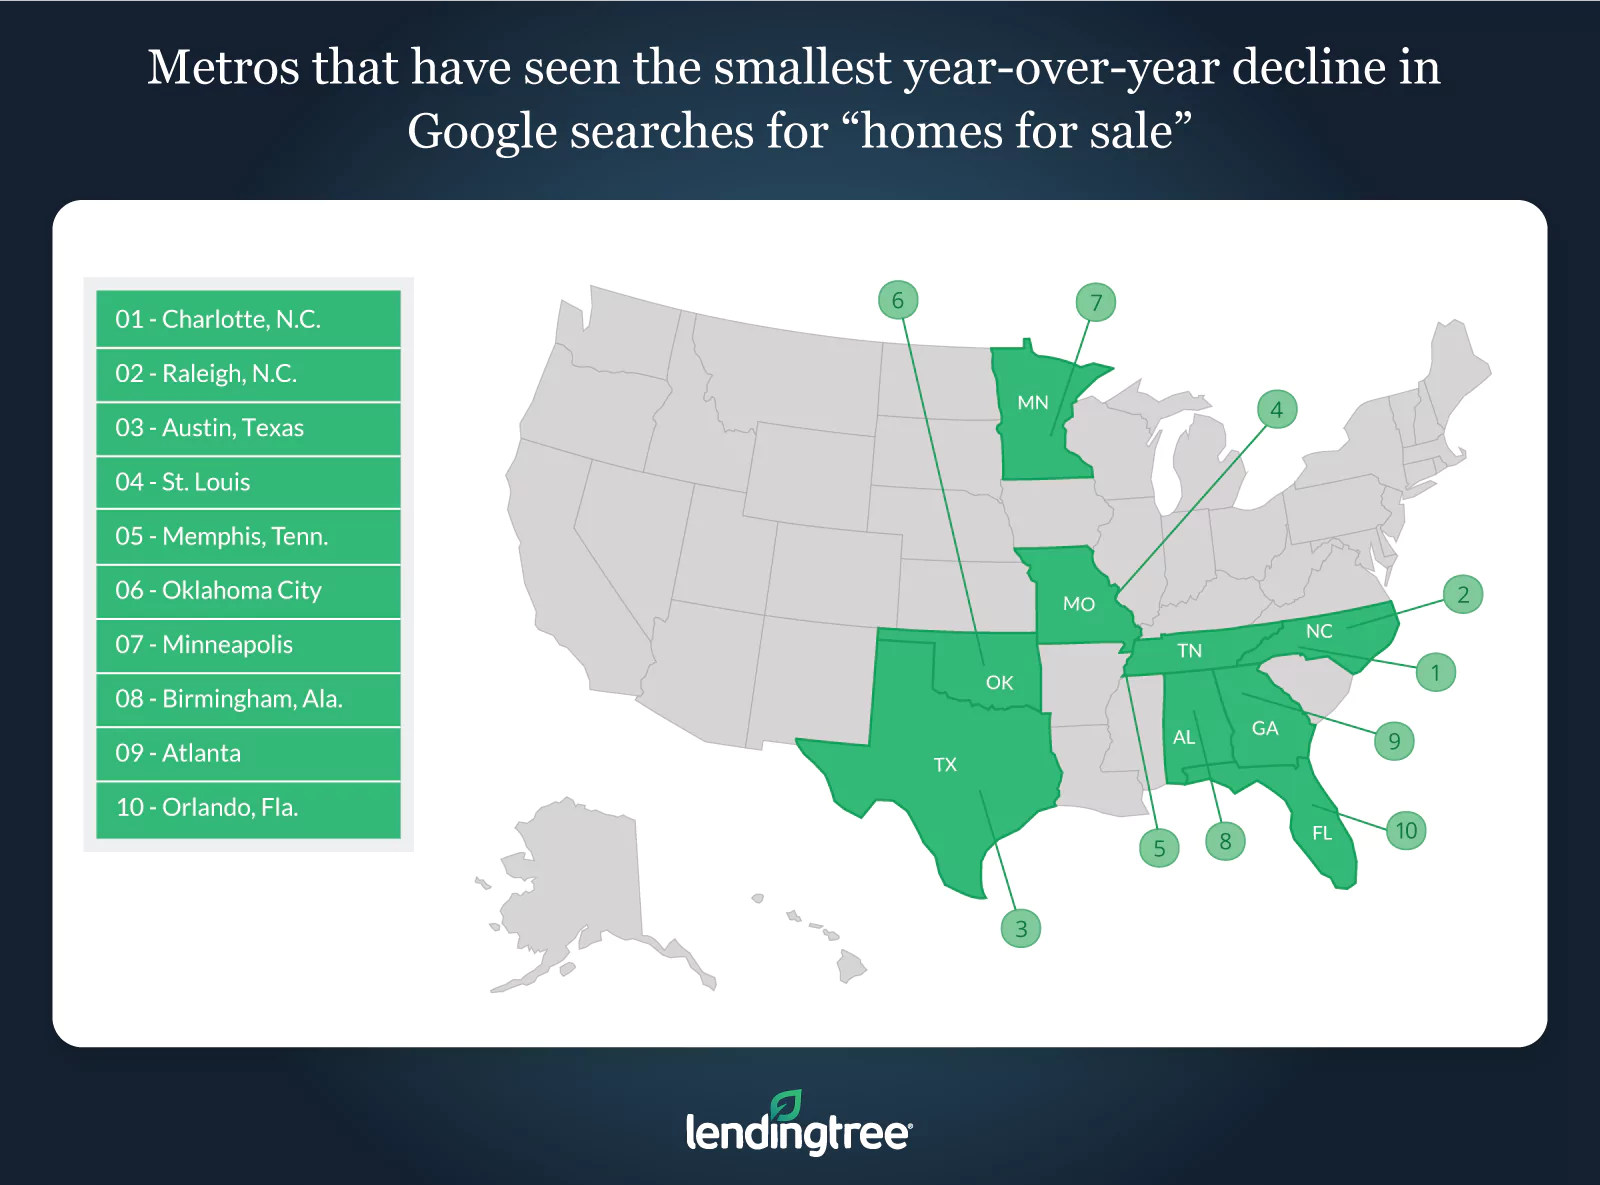
Metros that have seen the smallest year-over-year decline in Google searches for ‘homes for sale’
No. 1: Charlotte, N.C.
- Peak 2020 search-interest value: 87
- Year-over-year % growth in searches from 2019 to peak 2020 value: 1.2%
- % decline from 2020 peak to present: -18.4%
No. 2: Raleigh, N.C.
- Peak 2020 search-interest value: 86
- Year-over-year % growth in searches from 2019 to peak 2020 value: 4.9%
- % decline from 2020 peak to present: -18.6%
No. 3: Austin, Texas
- Peak 2020 search-interest value: 91
- Year-over-year % growth in searches from 2019 to peak 2020 value: 15.2%
- % decline from 2020 peak to present: -19.8%
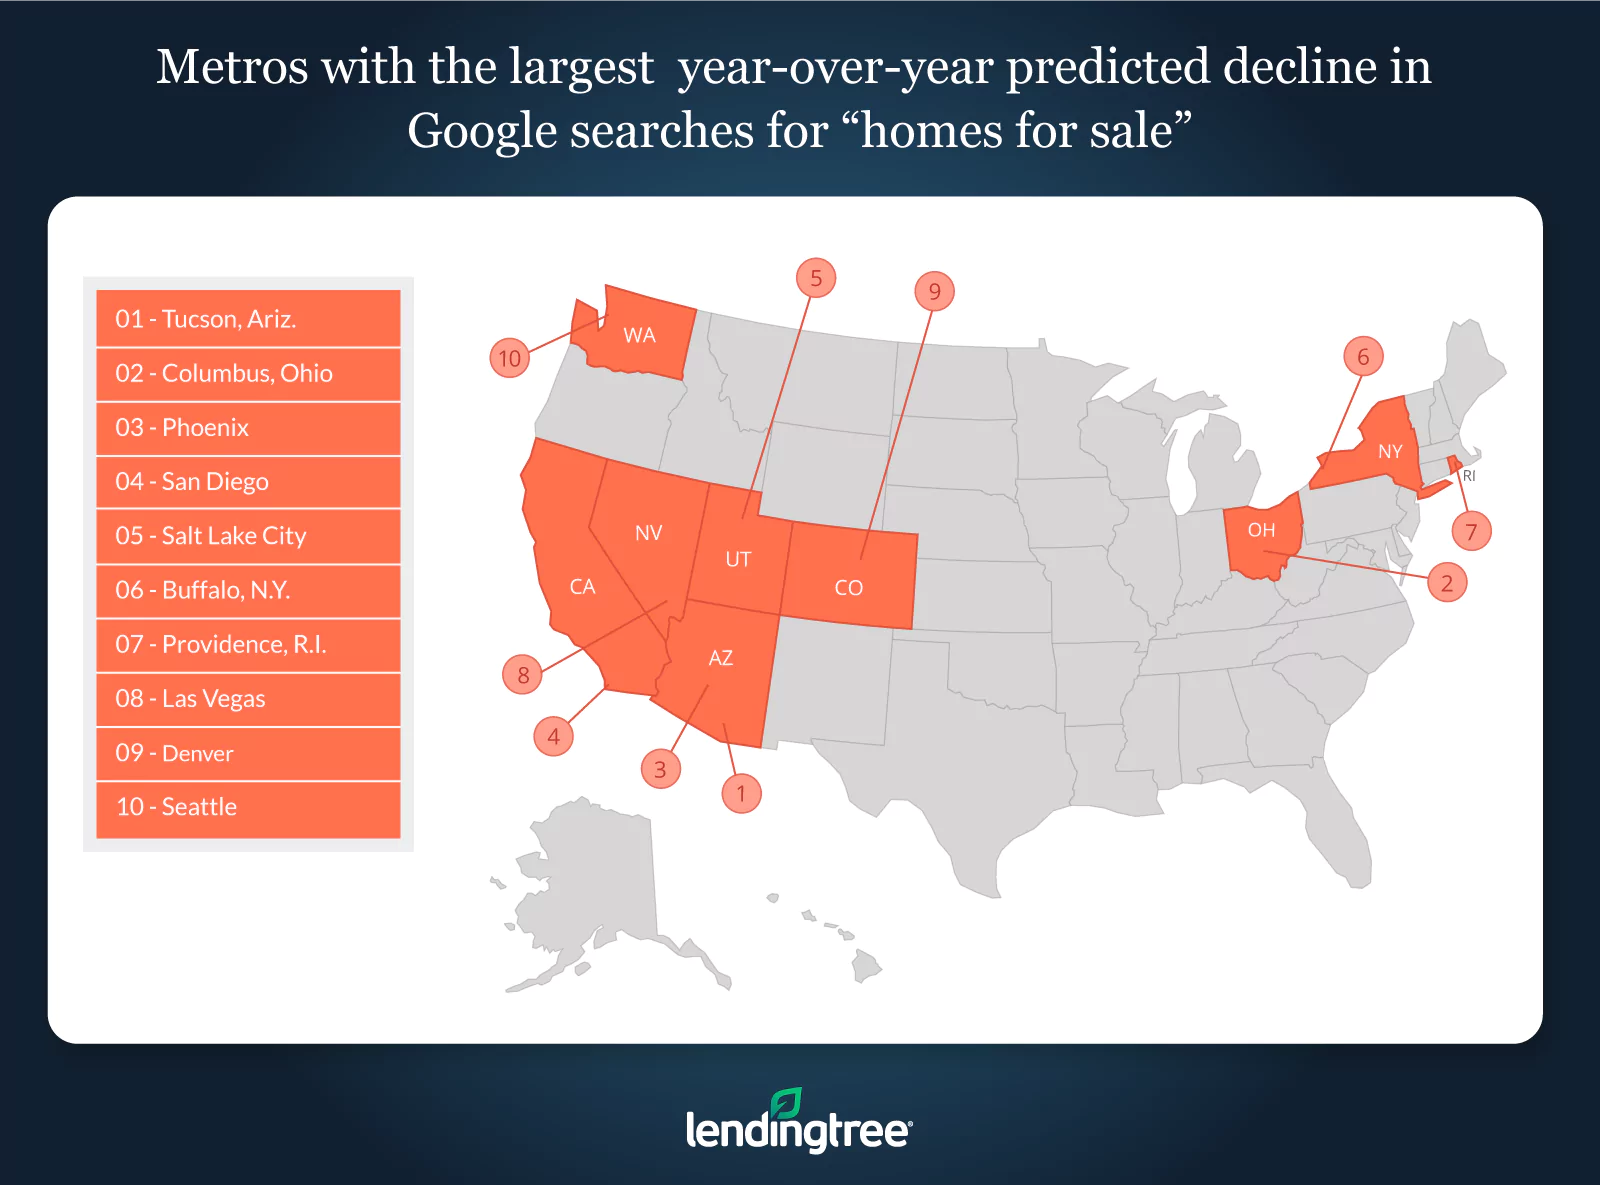
Metros that have the largest year-over-year predicted decline in Google searches for ‘homes for sale’
No. 1: Tucson, Ariz.
- Predicted end of May 2020 search-interest value: 3
- Predicted decline from end of May 2019 to end of May 2020: -96%
No. 2: Columbus, Ohio
- Predicted end of May 2020 search-interest value: 11
- Predicted decline from end of May 2019 to end of May 2020: -87%
No. 3: Phoenix
- Predicted end of May 2020 search-interest value: 14
- Predicted decline from end of May 2019 to end of May 2020: -85%
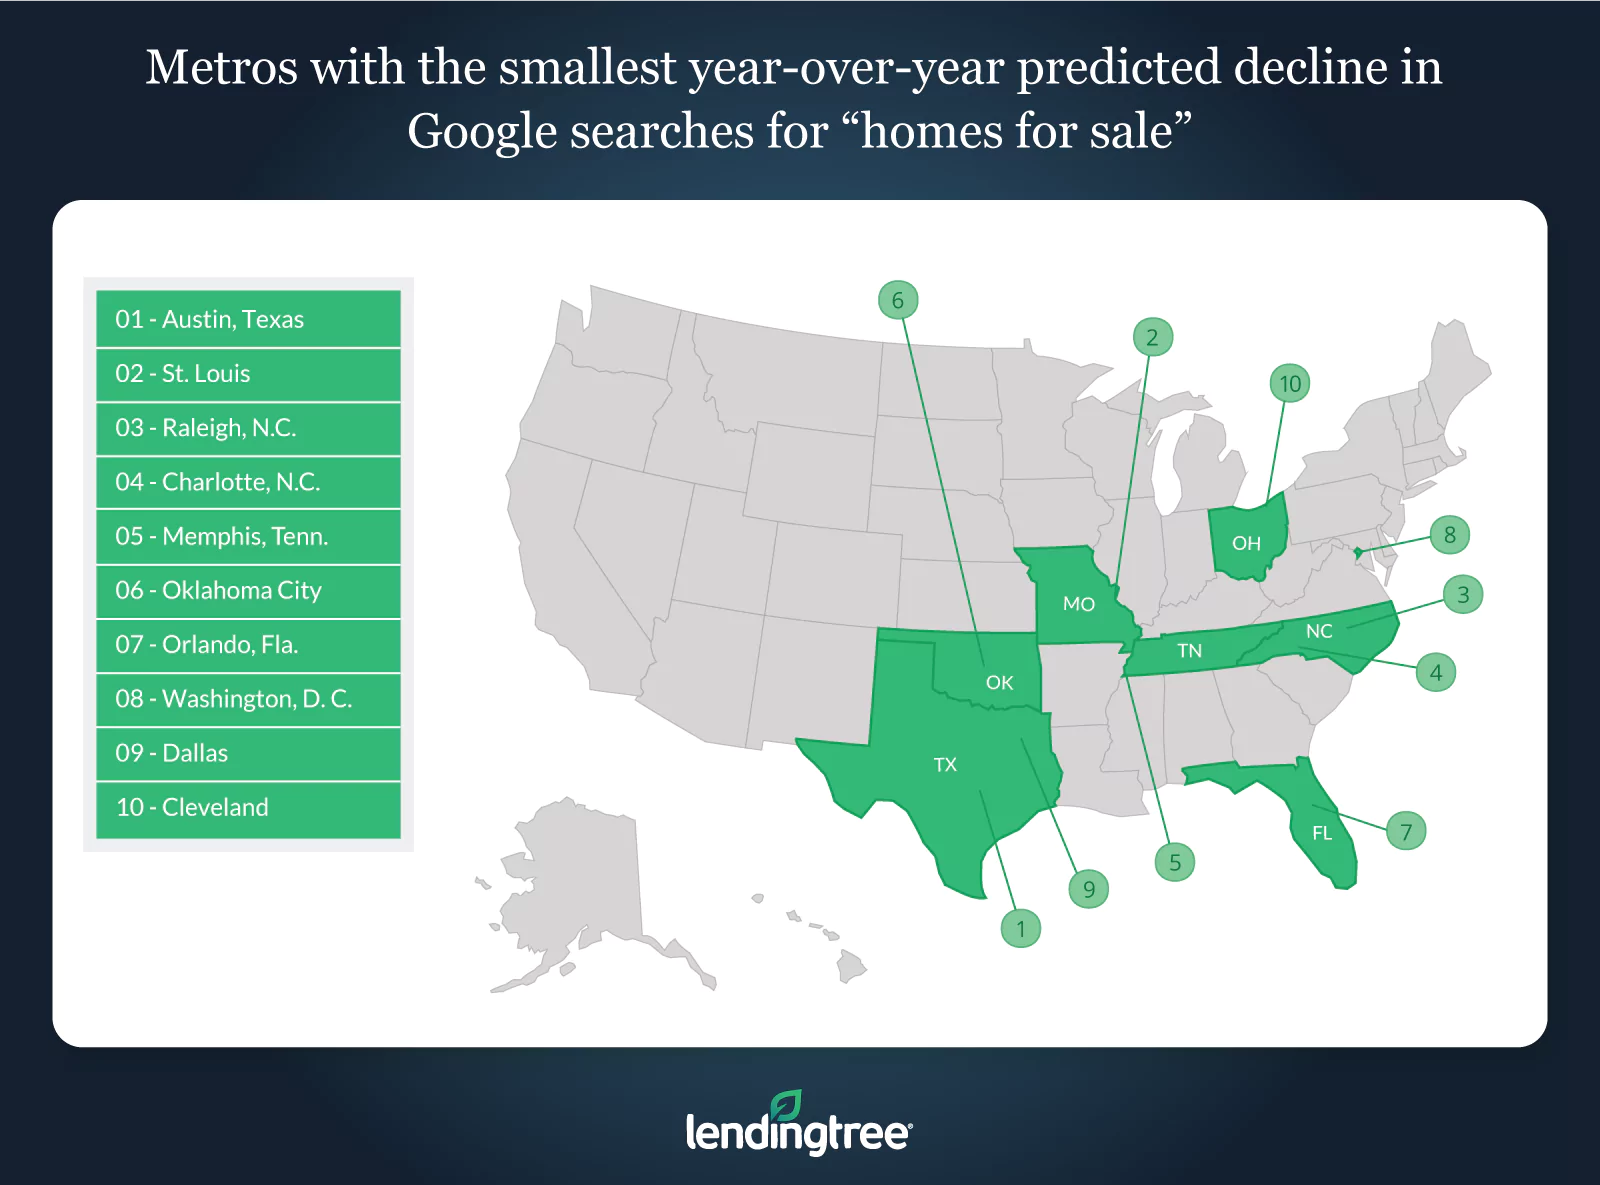
Metros that have the smallest year-over-over predicted decline in Google searches for ‘homes for sale’
No. 1: Austin, Texas
- Predicted end of May 2020 search-interest value: 55
- Predicted decline from end of May 2019 to end of May 2020: -28%
No. 2: St. Louis, Mo.
- Predicted end of May 2020 search-interest value: 47
- Predicted decline from end of May 2019 to end of May 2020: -36%
No. 3: Raleigh, N.C.
- Predicted end of May 2020 search-interest value: 54
- Predicted decline from end of May 2019 to end of May 2020: -43%
Methodology
The data for this piece comes from Google Trends. The “search-interest numbers/values” are defined by Google in the following way: “Numbers represent search interest relative to the highest point on the chart for the given region and time. A value of 100 is the peak popularity for the term. A value of 50 means that the term is half as popular. A score of 0 means there was not enough data for this term.”
To determine how far search interest could fall, LendingTree calculated the percent decline from 2020’s peak search-interest value to its present value as of March 15, 2020. By assuming that 2020’s peak value would decline by double that amount, LendingTree was able to estimate the search-interest value for the end of May 2020.
LendingTree research analyst Jacob Channel contributed to this study.
View mortgage loan offers from up to 5 lenders in minutes