US Mortgage Statistics 2026: Debt, Delinquency and Foreclosure Data


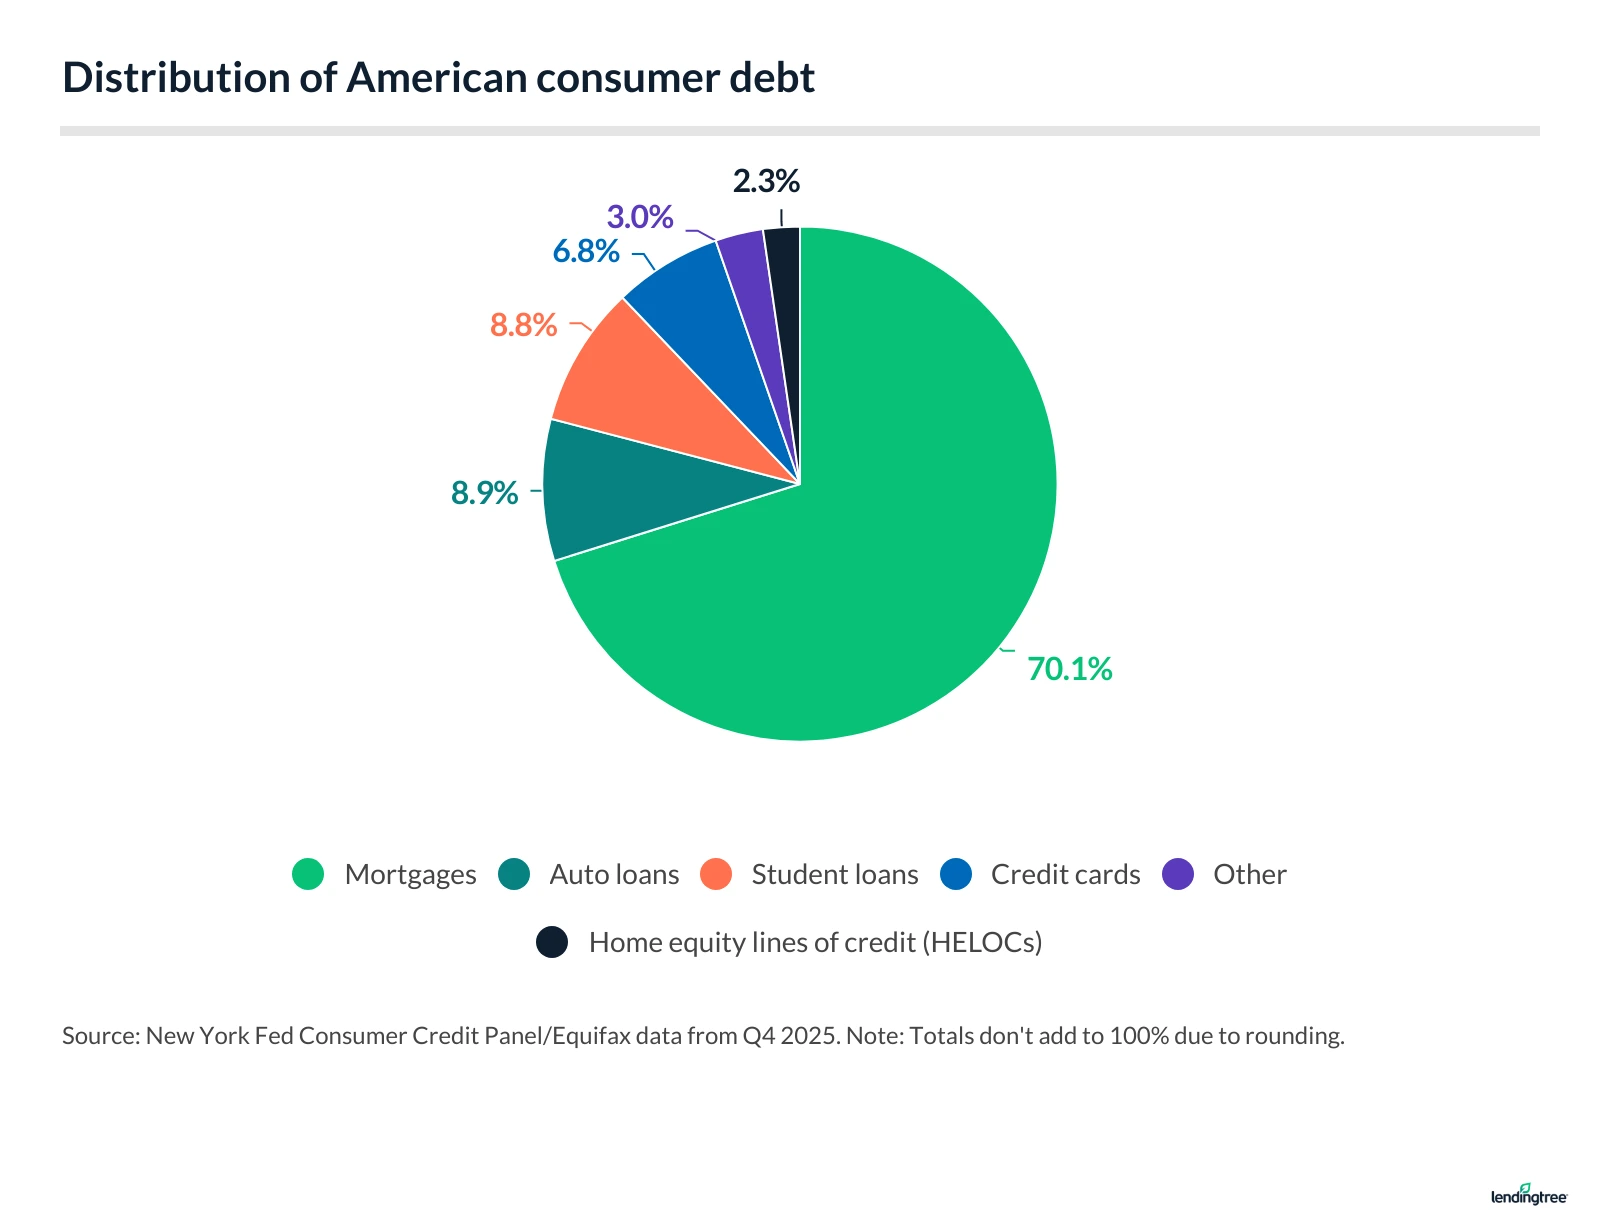
Americans collectively owe $13.17 trillion in mortgage debt, accounting for 70.1% of total U.S. consumer debt. Just 0.92% of mortgage debt is seriously delinquent, indicating that most borrowers are keeping up with their payments.
This page examines total mortgage debt, the number and size of mortgages, and key loan performance metrics such as delinquency and foreclosure rates.
- Americans owe $13.17 trillion in mortgage debt, accounting for 70.1% of total U.S. consumer debt.
- There are 86.94 million mortgage accounts, with an average balance of $151,484 per mortgage account.
- 0.92% of U.S. mortgage debt is seriously delinquent.
- 227,360 consumers experienced a new foreclosure in 2025, up from 174,100 in 2024.
Outstanding mortgage debt
Outstanding U.S. mortgage debt has climbed by $3.6 trillion since the fourth quarter of 2019, reaching $13.17 trillion in Q4 2025 — the latest available data. This steady growth reflects both rising home prices and continued borrowing activity over the past several years.
Mortgages now account for 70.1% of total U.S. consumer debt, confirming that mortgages remain the single largest financial obligation for American households.
At the same time, the number of active mortgage accounts rose to 86.94 million in Q4 2025, up from 80.94 million in Q4 2019, while the average mortgage balance increased to $151,484 per account, from $118,075.
Outstanding mortgages: 10-year look
| Quarter | Accounts* (millions) | Balance ($ trillions) | Avg. balance per account |
|---|---|---|---|
| Q4 2025 | 86.94 | $13.17 | $151,484 |
| Q4 2024 | 85.10 | $12.61 | $148,120 |
| Q4 2023 | 84.17 | $12.25 | $145,539 |
| Q4 2022 | 83.42 | $11.92 | $142,927 |
| Q4 2021 | 80.96 | $10.93 | $135,005 |
| Q4 2020 | 80.60 | $10.04 | $124,603 |
| Q4 2019 | 80.94 | $9.56 | $118,075 |
| Q4 2018 | 79.35 | $9.12 | $114,984 |
| Q4 2017 | 79.99 | $8.88 | $111,039 |
| Q4 2016 | 79.90 | $8.48 | $106,133 |
| Q4 2015 | 80.61 | $8.25 | $102,332 |
Mortgage delinquencies: Rates and trends over time
Less than 1.00% — 0.92%, to be exact — of U.S. mortgage balances are seriously delinquent, meaning payments are at least 90 days past due.
This Q4 2025 figure is up from 0.70% in Q4 2024 and continues a stretch of year-over-year Q4 increases since 2022, when the percentage was 0.43%.
Seriously delinquent rate: 10-year look
| Quarter | Seriously delinquent rate |
|---|---|
| Q4 2025 | 0.92% |
| Q4 2024 | 0.70% |
| Q4 2023 | 0.57% |
| Q4 2022 | 0.43% |
| Q4 2021 | 0.46% |
| Q4 2020 | 0.62% |
| Q4 2019 | 1.07% |
| Q4 2018 | 1.06% |
| Q4 2017 | 1.27% |
| Q4 2016 | 1.57% |
| Q4 2015 | 2.18% |
Today, mortgages are one of the most stable categories of consumer debt. By contrast, the share of credit card borrowers in serious delinquency reached 12.70% in Q4 2025, suggesting that financial stress is more concentrated in unsecured borrowing.
Mortgage foreclosure: Rates and trends over time
In 2025, 227,360 consumers experienced a new foreclosure, a 30.6% increase from 174,100 in 2024. This rise suggests that foreclosure activity is beginning to pick up after a period of relative stability.
Number of new foreclosures: 10-year look
| Year | Foreclosures |
|---|---|
| 2025 | 227,360 |
| 2024 | 174,100 |
| 2023 | 150,820 |
| 2022 | 122,140 |
| 2021 | 38,040 |
| 2020 | 129,000 |
| 2019 | 277,560 |
| 2018 | 284,360 |
| 2017 | 314,220 |
| 2016 | 339,200 |
| 2015 | 404,180 |
However, despite the year-over-year increase, the total remains well below historical levels, at 43.7% below the 404,180 foreclosures recorded in 2015.
Source
- Federal Reserve Bank of New York: Quarterly Report on Household Debt and Credit (Q4 2025), released in February 2026
View mortgage loan offers from up to 5 lenders in minutes