West Virginia, Great Plains See Largest Car Loan Demand Changes Amid Coronavirus Crisis


Demand for car loans dropped more than 25% in late March — when indexed to the week beginning Jan. 5, 2020 — as the coronavirus pandemic upended how much time many Americans spent commuting.
But in late May, our index that analyzed the number of people completing query forms for car loans on LendingTree showed that demand was 92% higher than during the first week of 2020, led by West Virginia and the states within the Great Plains.
LendingTree researchers used this index to rank areas based on the difference between the highest and lowest demand points from the week of Jan. 5 to the week of July 26. Here’s what we learned.
- West Virginia saw the largest difference between the highest and lowest demand points in this period. On our car loan index, demand rose to 360 in mid-May after falling to 47 in early February — a variation of 313 points.
- The Great Plains region (Montana, North Dakota, South Dakota and Wyoming) saw the second largest difference of 261 index points. The lowest point for auto demand here (we combined states to make regions due to small sample sizes) was in early January, while the highest point for demand was the week of May 24.
- Indiana had the third most dramatic change in our auto loan index. In late March, demand for auto loans fell to an index score of 87. That figure jumped to 344 by early June, a difference of 257.
- At the bottom of the list is Oregon, which had a score of 50 in mid-March, with levels recovering to a score of 128 at its peak in early June.
- Florida and Texas round out the bottom three with nearly identical scores. Both saw a demand dip in late March before a strong recovery in late May.
Where demand for car loans saw the greatest change
No. 1: West Virginia
The home of the Mountaineers saw its car loan index drop to 47 in the first full week of February, more than a month before most states saw their lowest point.
But its peak score of 360 in May was the highest index score in the nation — and it happened a week before the national average hit its highest point of 192.
The difference of 313 points makes the graph of its car loan index data resemble the mountains that West Virginia is famous for.
No. 2: Great Plains
Montana, North Dakota, South Dakota and Wyoming together had the second largest revival of car loan demand with a difference of 261 points.
The lowest point here was at the beginning of the year — the second full week of January — with an index score of 78. Compared with other states and regions, this low score is not as impressive, as nine areas scored 50 or below.
However, the Great Plains took second because its car loan demand soared to 339 in May, which is the third highest index score total after West Virginia and Indiana.
No. 3: Indiana
With the second-highest peak of 344 but a low point of only 87, Indiana had the third most dramatic change in its auto loan index, a difference of 257.
The Hoosier State hit its low point in late March, which tracks with the national trend, but it was slightly slower to hit its high, which it did in early June.
Where demand for car loans saw the smallest change
No. 44: Oregon
Car loan demand in Oregon hit a low of 50 in mid-March and recovered by a margin of only 78 points, reaching an index of 128 at its peak in early June.
An earlier LendingTree study showed that residents of Portland buy some of the oldest used cars in the country, which could contribute to its low score here.
Nos. 43 and 42: Florida and Texas
The auto loan markets in the Sunshine and Lone Star states both dropped to an index score of 72, slightly deeper than the lowest national average of 74 in late March as the economic effects of COVID-19 rang through the country.
These states saw their index scores rise by 102 and 105 points, respectively, in May, bringing Florida to a score of 174 and Texas to a score of 177. It’s worth noting that in Texas, even auto debt is bigger.
National demand for car loans
The COVID-19 pandemic quelled national demand for car loans to its lowest index point of 74 the week of March 22. At that time, 19 of the 44 places we analyzed saw their lowest individual scores.
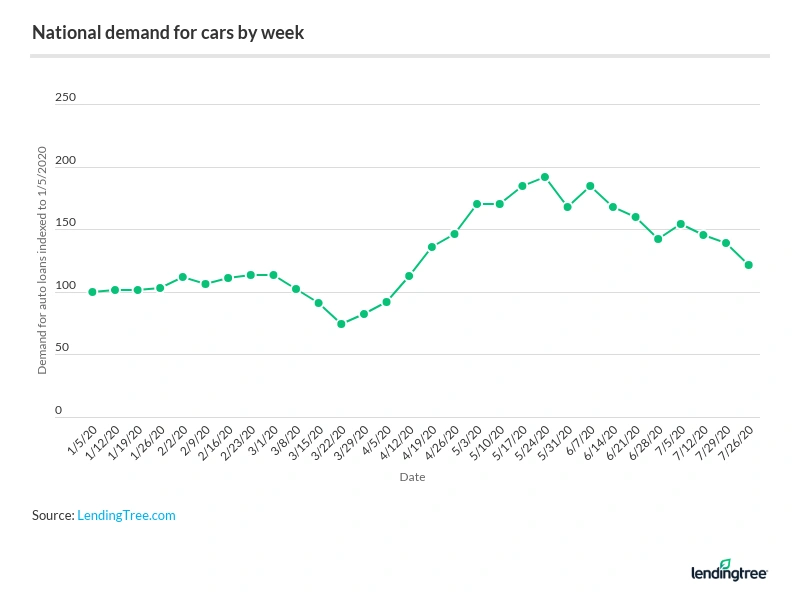
But there are signs that things are looking up for the industry, helped by automaker incentives and lower auto loan interest rates. Demand rebounded to a peak of 192 in the week of May 24, and 10 areas registered increases of more than 200 index points.
The index score was sitting in the 120s at the end of July.
Methodology
Our researchers analyzed the number of people completing query forms for car loans on LendingTree. We counted the number of completed query forms for every week of the year, indexed those values to values from the week of Jan. 5, 2020, and ranked areas based on the difference between the highest and lowest demand points. In some instances, we combined states to make regions due to small sample sizes. The data covers the period from the week of Jan. 5 to the week of July 26.
Get auto loan offers from up to 5 lenders in minutes