Only 27% of Gen Z Workers Earn Enough to Live Alone Comfortably — and in Many Metros, It’s Even Worse


It’s a long-held rule of thumb that you shouldn’t spend more than 30% of your income before taxes on housing costs. A LendingTree analysis of government data shows that only about 1 in 4 Gen Z workers can meet that standard. And in some metros, that number falls to 1 in 10.
It shouldn’t be surprising that Gen Z workers (ages 18 to 27 in 2024, the year of the data we analyzed) fall short of that standard far more often than their older counterparts. Young people typically make less money than older people, and it’s certainly nothing new that teens and 20-somethings sometimes need to lean on roommates, partners and even Mom and Dad for help with housing. Still, our analysis illuminates how tall a task Gen Z faces today if they want to live comfortably on their own instead.
We defined “earning enough to live alone comfortably” as being able to afford a one-bedroom apartment in your area without spending more than 30% of your gross income. While our analysis revealed that most Americans were able to do so, few Gen Zers could say the same.
Key findings
- Just over 1 in 4 full-time Gen Z workers nationwide earn enough to live alone comfortably, but the share is much lower in many large metros. Across the U.S., living comfortably without financial help from a partner, friend or relative requires earning $52,040 a year, and only 26.9% of Gen Z workers meet that threshold. In Oxnard, Calif. (9.6%), Miami (10.0%) and Orlando, Fla. (10.7%), only about 1 in 10 Gen Z workers make enough to live alone comfortably.
- Gen Z full-time workers are less than half as likely as workers in older generations to earn enough to live alone comfortably. In 2024, a majority of Gen Xers (60.9%), millennials (56.9%) and baby boomers (55.6%) earned a comfortable living, compared to just 26.9% of Gen Z workers.
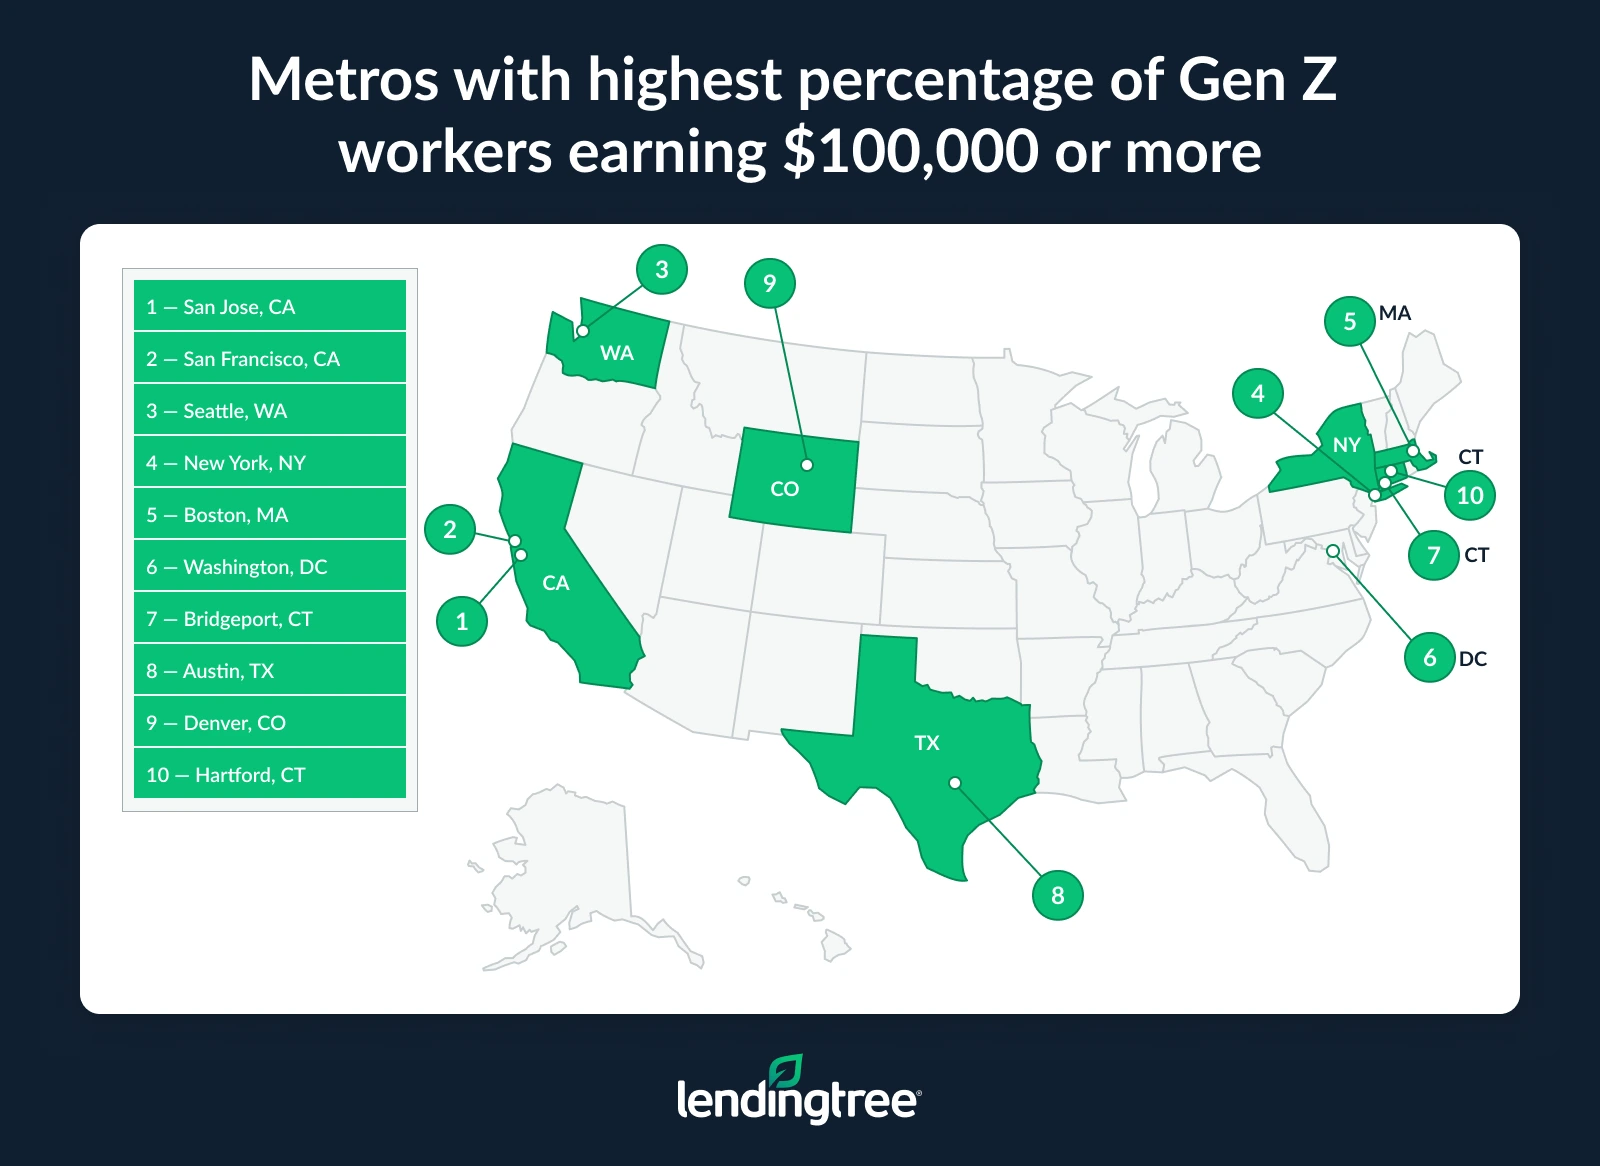
- Nationally, fewer than 1 in 20 full-time Gen Z workers earn $100,000 or more, but the share is far higher in select West and Northeast metros. Across the U.S., 4.9% of full-time Gen Z workers earn at least $100,000, compared with nearly 3 in 10 (29.5%) in San Jose, Calif., the highest share among major metros. San Francisco (20.8%) and Seattle (15.3%) also rank near the top, while New York (13.0%) is the only Northeast metro where more than 1 in 10 Gen Z workers earn six figures.
- Information and finance offer the clearest paths to six-figure pay for Gen Z workers. 16.3% of full-time Gen Z workers in information earn at least $100,000, the highest share of any industry. That’s followed by finance, insurance and real estate (12.4%) and professional and business services (11.2%). By comparison, arts, entertainment, hospitality and food services (1.1%), personal and community services (1.9%), and retail (2.5%) trail far behind.
Few full-time Gen Z workers earn enough to live alone comfortably
Our analysis showed that someone needs to earn $52,040 a year to live comfortably without financial help from a partner, friend or relative. However, just 26.9% of Gen Z workers earn that much. That’s a far smaller percentage than we see among older Americans, which we’ll get into later.
Diving deeper into the Gen Z data, we found huge discrepancies among metros. Our analysis showed that housing costs and affordability can vary wildly among different areas, and also underscored how acute the problem is for Gen Z workers, even when they work full time.
In Oxnard, Calif., a coastal city northwest of Los Angeles, just 9.6% of Gen Z workers can afford to live alone comfortably. That’s the lowest percentage among the nation’s 100 largest metros, though three Florida metros — Miami (10.0%), Orlando (10.7%) and Cape Coral (10.8%) — aren’t far behind.
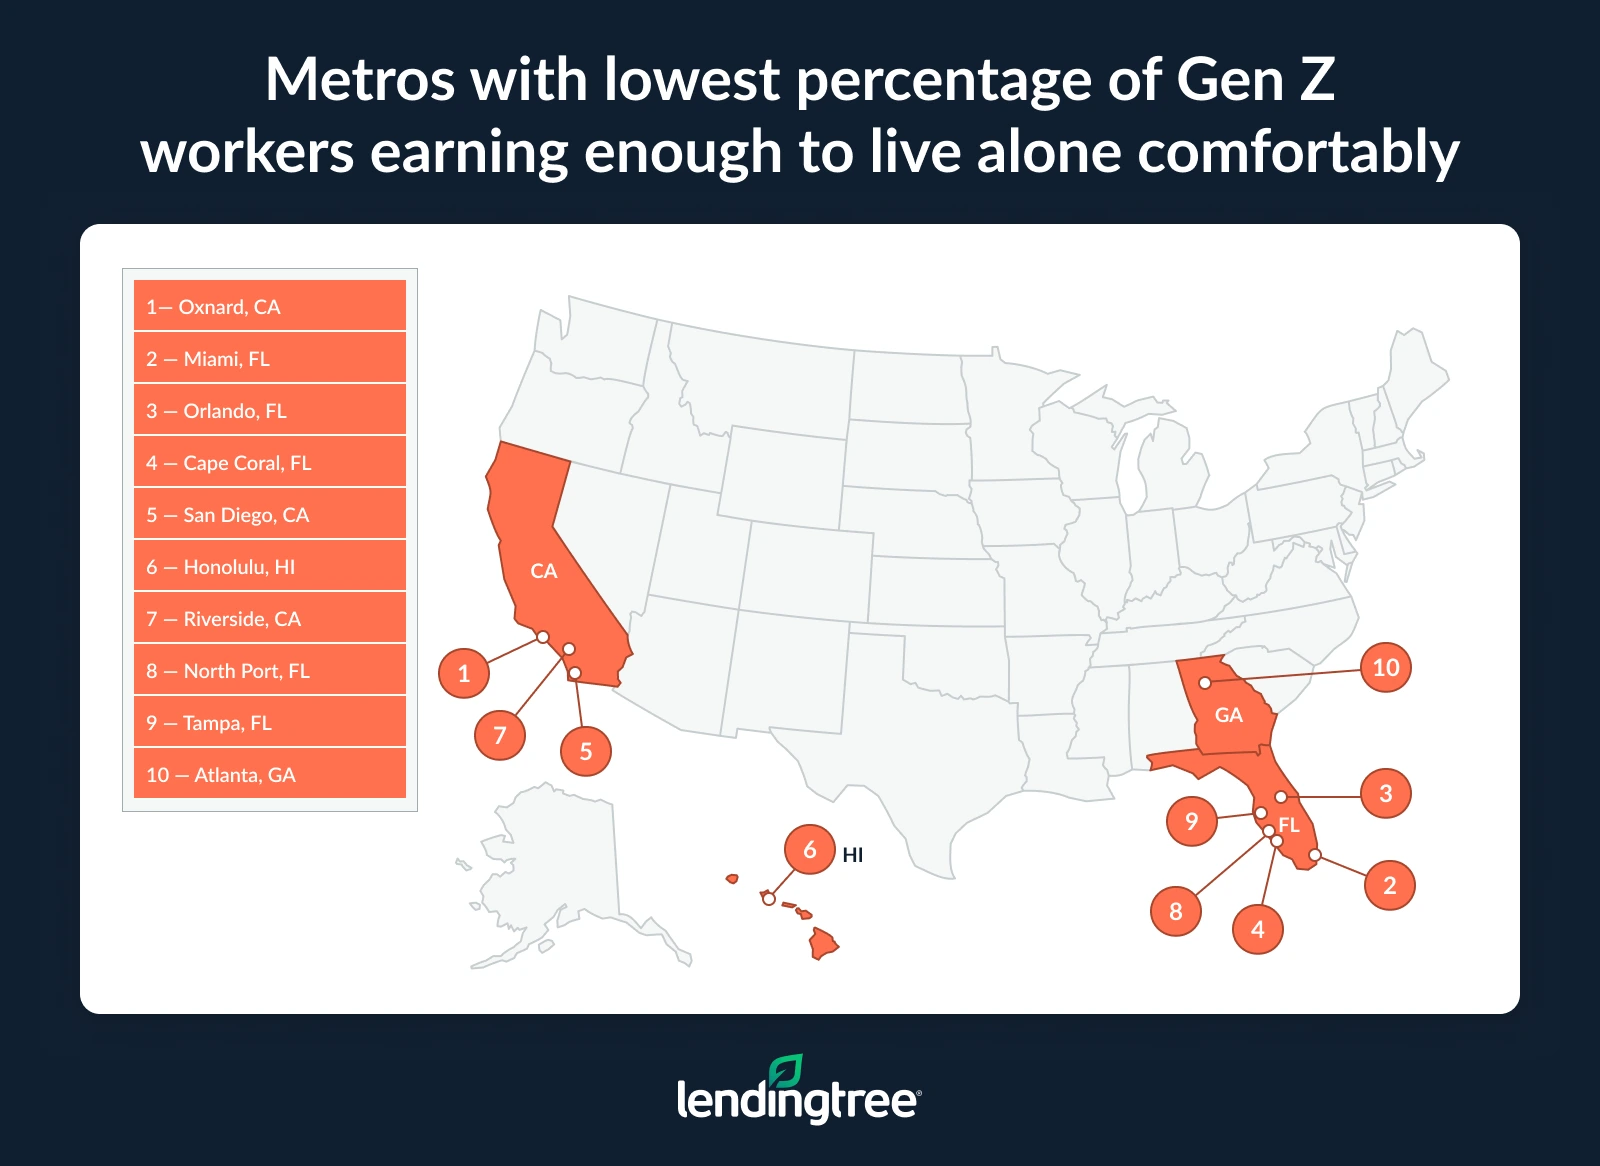
There are 18 metros in which 20% or fewer of Gen Z workers earn enough to be able to live alone comfortably. More than half of those are in California or Florida.
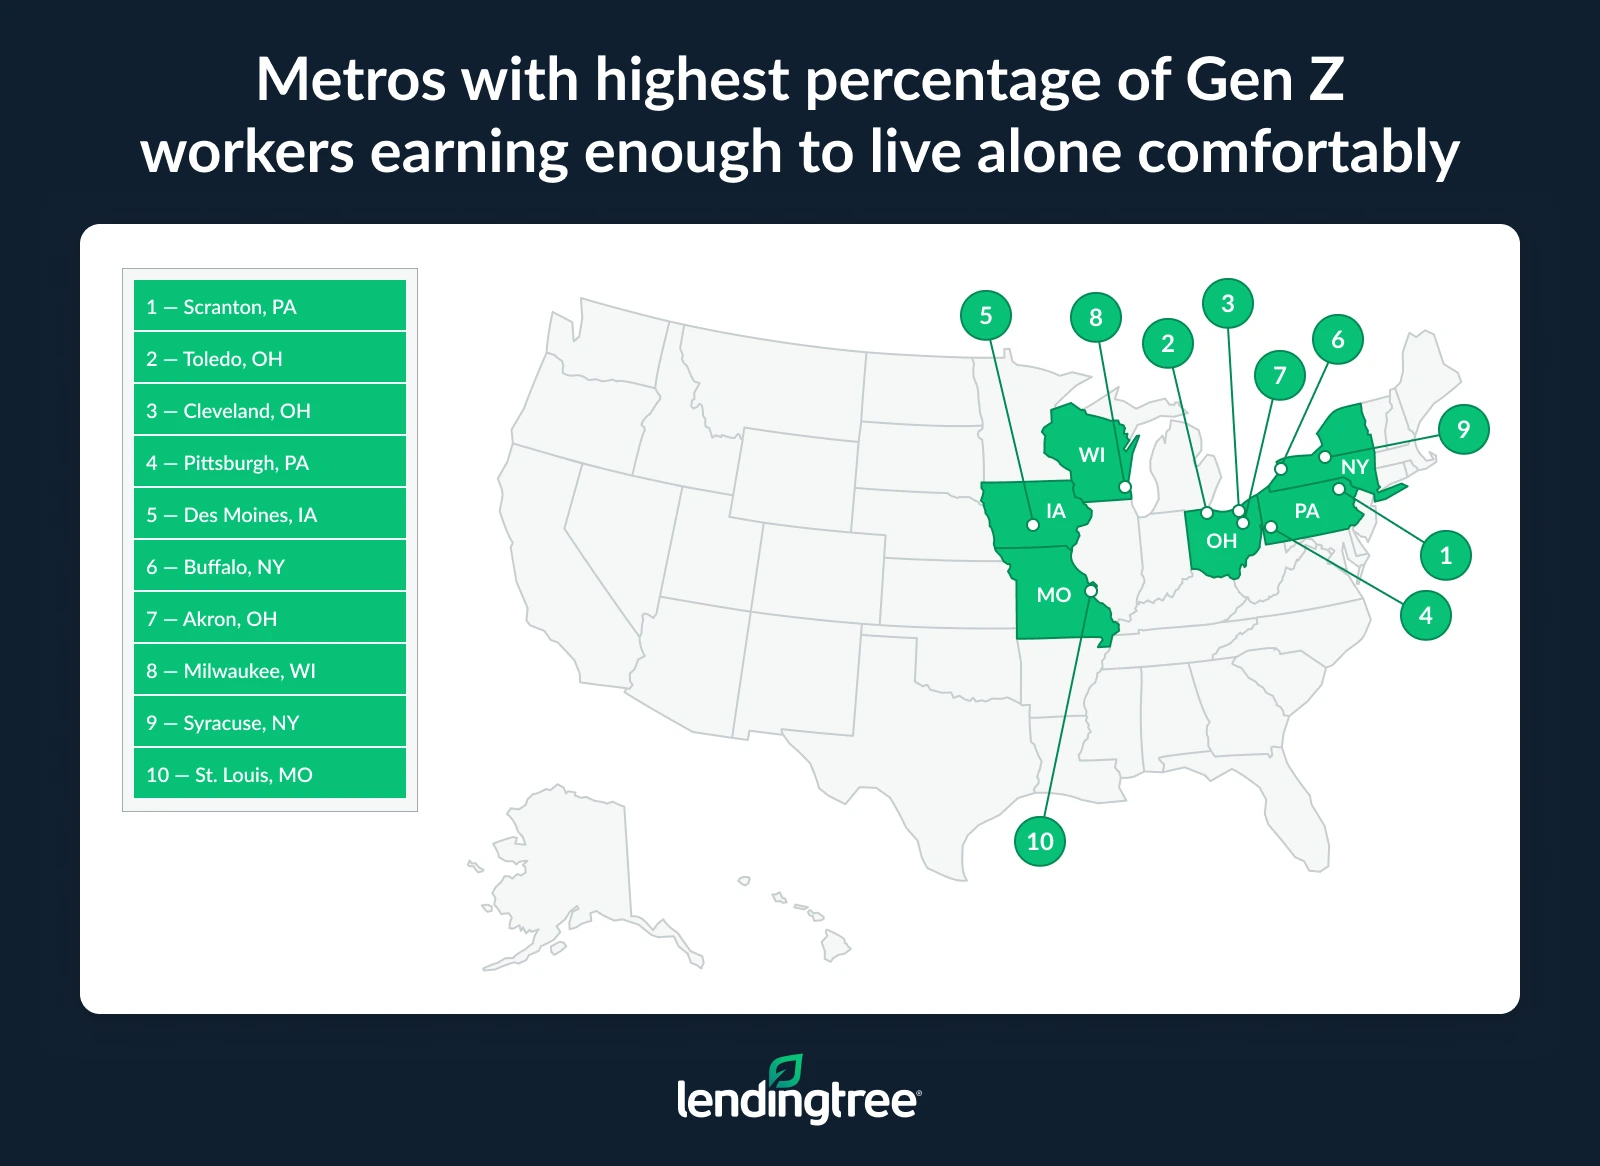
The situation for Gen Z isn’t nearly as dire elsewhere. In 14 of the nation’s 100 biggest metros, at least half of Gen Z workers can afford to live alone comfortably. Scranton, Pa., has the highest percentage at 72.0%, with two Ohio metros — Toledo (64.9%) and Cleveland (59.4%) — in second and third place, respectively. Five of the seven metros with the highest percentages are in Pennsylvania or Ohio.
We also see a wide variance in affordability when we zoom in on just the nation’s five biggest metros. Los Angeles (17.2%) has the smallest percentage of Gen Z workers who can afford to live alone comfortably, while Chicago has the highest at 32.8%. In the nation’s largest metro, New York City, 29.4% of Gen Z workers can afford to live alone comfortably. In Dallas and Houston, the percentages are 25.4% and 24.5%, respectively.
Percentage of full-time Gen Z workers earning enough to live alone comfortably (by metro)
| Rank | Metro | Annual salary/wages needed to live alone comfortably | Estimated full-time Gen Z workers earning enough to live alone comfortably | Estimated full-time Gen Z workers | % earning enough to live alone comfortably |
|---|---|---|---|---|---|
| 1 | Oxnard, CA | $78,640 | 4,053 | 42,012 | 9.6% |
| 2 | Miami, FL | $70,520 | 31,856 | 318,936 | 10.0% |
| 3 | Orlando, FL | $66,280 | 18,421 | 171,629 | 10.7% |
| 4 | Cape Coral, FL | $65,200 | 5,280 | 48,901 | 10.8% |
| 5 | San Diego, CA | $81,440 | 29,753 | 203,647 | 14.6% |
| 6 | Honolulu, HI | $64,320 | 10,368 | 67,454 | 15.4% |
| 7 | Riverside, CA | $62,960 | 38,854 | 244,524 | 15.9% |
| 8 | North Port, FL | $67,480 | 6,383 | 39,665 | 16.1% |
| 9 | Tampa, FL | $62,920 | 29,457 | 181,442 | 16.2% |
| 10 | Atlanta, GA | $64,200 | 63,482 | 385,360 | 16.5% |
| 11 | Los Angeles, CA | $72,880 | 106,039 | 617,395 | 17.2% |
| 12 | Las Vegas, NV | $55,440 | 24,094 | 137,664 | 17.5% |
| 13 | Reno, NV | $57,840 | 5,966 | 33,089 | 18.0% |
| 14 | Charleston, SC | $63,000 | 11,316 | 61,079 | 18.5% |
| 15 | Phoenix, AZ | $62,640 | 65,489 | 351,316 | 18.6% |
| 16 | Deltona, FL | $54,640 | 6,253 | 33,217 | 18.8% |
| 17 | Boise, ID | $52,960 | 10,966 | 57,199 | 19.2% |
| 18 | Columbia, SC | $46,880 | 11,112 | 56,152 | 19.8% |
| 19 | Palm Bay, FL | $58,120 | 6,358 | 31,057 | 20.5% |
| 19 | Jacksonville, FL | $56,120 | 20,233 | 98,496 | 20.5% |
| 21 | Lakeland, FL | $48,880 | 9,108 | 43,350 | 21.0% |
| 22 | Colorado Springs, CO | $59,840 | 13,142 | 62,423 | 21.1% |
| 23 | Sacramento, CA | $63,960 | 22,306 | 104,411 | 21.4% |
| 24 | Portland, OR | $62,960 | 28,886 | 133,016 | 21.7% |
| 24 | Stockton, CA | $55,840 | 8,370 | 38,524 | 21.7% |
| 26 | Washington, DC | $73,200 | 80,200 | 367,984 | 21.8% |
| 27 | Charlotte, NC | $58,040 | 43,574 | 195,569 | 22.3% |
| 28 | Nashville, TN | $57,960 | 36,474 | 156,955 | 23.2% |
| 28 | Bridgeport, CT | $68,200 | 12,253 | 52,708 | 23.2% |
| 30 | Kiryas Joel, NY | $54,040 | 8,729 | 37,321 | 23.4% |
| 31 | San Antonio, TX | $48,760 | 42,931 | 181,094 | 23.7% |
| 32 | San Francisco, CA | $87,200 | 52,545 | 217,624 | 24.1% |
| 33 | Fresno, CA | $48,080 | 14,363 | 59,281 | 24.2% |
| 34 | Houston, TX | $50,920 | 113,426 | 462,181 | 24.5% |
| 35 | Denver, CO | $68,520 | 53,143 | 213,445 | 24.9% |
| 36 | Salt Lake City, UT | $55,400 | 28,219 | 111,550 | 25.3% |
| 37 | Dallas, TX | $58,920 | 145,104 | 571,783 | 25.4% |
| 38 | Memphis, TN | $45,560 | 17,953 | 69,654 | 25.8% |
| 39 | New Haven, CT | $54,160 | 7,340 | 27,906 | 26.3% |
| 40 | Greensboro, NC | $41,760 | 11,138 | 41,905 | 26.6% |
| 41 | Richmond, VA | $54,400 | 20,921 | 77,476 | 27.0% |
| 42 | Ogden, UT | $52,680 | 12,220 | 44,840 | 27.3% |
| 42 | Virginia Beach, VA | $53,960 | 33,003 | 120,857 | 27.3% |
| 44 | Seattle, WA | $72,560 | 69,426 | 250,509 | 27.7% |
| 45 | Boston, MA | $69,880 | 93,689 | 325,054 | 28.8% |
| 46 | Austin, TX | $62,240 | 51,358 | 177,842 | 28.9% |
| 47 | Raleigh, NC | $58,840 | 27,681 | 94,650 | 29.2% |
| 47 | Provo, UT | $51,720 | 18,057 | 61,919 | 29.2% |
| 49 | New York, NY | $68,320 | 299,096 | 1,016,537 | 29.4% |
| 50 | San Jose, CA | $98,600 | 32,568 | 110,201 | 29.6% |
| 51 | Greenville, SC | $45,280 | 19,229 | 63,413 | 30.3% |
| 52 | Philadelphia, PA | $54,120 | 108,393 | 345,021 | 31.4% |
| 53 | Baltimore, MD | $53,040 | 51,660 | 164,230 | 31.5% |
| 54 | Allentown, PA | $49,640 | 15,882 | 50,097 | 31.7% |
| 55 | Augusta, GA | $43,160 | 10,896 | 34,258 | 31.8% |
| 56 | Tucson, AZ | $45,280 | 24,073 | 75,187 | 32.0% |
| 56 | Chattanooga, TN | $47,840 | 10,818 | 33,791 | 32.0% |
| 58 | Chicago, IL | $52,400 | 179,724 | 548,063 | 32.8% |
| 59 | El Paso, TX | $35,720 | 21,771 | 63,273 | 34.4% |
| 60 | Jackson, MS | $41,040 | 11,874 | 34,025 | 34.9% |
| 61 | New Orleans, LA | $42,840 | 17,056 | 48,516 | 35.2% |
| 62 | Winston-Salem, NC | $42,960 | 15,103 | 41,684 | 36.2% |
| 63 | Birmingham, AL | $42,880 | 22,928 | 62,996 | 36.4% |
| 64 | Columbus, OH | $46,640 | 50,392 | 137,517 | 36.6% |
| 65 | Knoxville, TN | $42,080 | 19,593 | 52,906 | 37.0% |
| 66 | Kansas City, MO | $45,960 | 56,530 | 152,207 | 37.1% |
| 66 | Bakersfield, CA | $40,560 | 17,070 | 46,037 | 37.1% |
| 68 | Grand Rapids, MI | $43,120 | 32,424 | 86,347 | 37.6% |
| 69 | Spokane, WA | $45,040 | 12,980 | 32,622 | 39.8% |
| 70 | Albuquerque, NM | $39,720 | 22,485 | 55,628 | 40.4% |
| 71 | Indianapolis, IN | $43,480 | 59,010 | 145,256 | 40.6% |
| 72 | Baton Rouge, LA | $38,640 | 23,328 | 57,036 | 40.9% |
| 73 | Oklahoma City, OK | $37,000 | 40,980 | 94,769 | 43.2% |
| 74 | Detroit, MI | $40,720 | 106,093 | 243,375 | 43.6% |
| 75 | Omaha, NE | $43,840 | 32,797 | 75,112 | 43.7% |
| 76 | Minneapolis, MN | $49,760 | 99,567 | 226,766 | 43.9% |
| 77 | Little Rock, AR | $38,240 | 22,431 | 50,878 | 44.1% |
| 78 | Hartford, CT | $47,360 | 26,484 | 59,239 | 44.7% |
| 79 | Tulsa, OK | $36,840 | 32,736 | 70,502 | 46.4% |
| 80 | Fayetteville, AR | $39,080 | 20,412 | 43,840 | 46.6% |
| 80 | Providence, RI | $41,680 | 41,458 | 88,889 | 46.6% |
| 82 | Louisville, KY | $39,520 | 36,484 | 77,188 | 47.3% |
| 83 | Cincinnati, OH | $39,840 | 71,413 | 150,013 | 47.6% |
| 84 | Dayton, OH | $37,760 | 25,541 | 53,086 | 48.1% |
| 85 | Albany, NY | $45,480 | 25,663 | 52,627 | 48.8% |
| 86 | Wichita, KS | $31,960 | 21,441 | 43,827 | 48.9% |
| 87 | Worcester, MA | $41,960 | 23,927 | 47,651 | 50.2% |
| 88 | Harrisburg, PA | $38,800 | 19,138 | 37,932 | 50.5% |
| 89 | Rochester, NY | $38,600 | 29,886 | 57,993 | 51.5% |
| 90 | McAllen, TX | $28,160 | 28,863 | 55,825 | 51.7% |
| 91 | St. Louis, MO | $37,200 | 88,108 | 165,204 | 53.3% |
| 92 | Syracuse, NY | $39,880 | 20,442 | 38,276 | 53.4% |
| 93 | Milwaukee, WI | $40,600 | 53,295 | 99,476 | 53.6% |
| 94 | Akron, OH | $33,480 | 21,143 | 38,777 | 54.5% |
| 95 | Buffalo, NY | $36,280 | 34,088 | 61,104 | 55.8% |
| 96 | Des Moines, IA | $38,680 | 32,092 | 57,416 | 55.9% |
| 97 | Pittsburgh, PA | $35,600 | 75,901 | 128,552 | 59.0% |
| 98 | Cleveland, OH | $34,960 | 78,378 | 132,029 | 59.4% |
| 99 | Toledo, OH | $29,880 | 21,081 | 32,477 | 64.9% |
| 100 | Scranton, PA | $29,920 | 15,752 | 21,884 | 72.0% |
Gen Z full-time workers far less likely to earn enough to live alone comfortably
While affordability is a nationwide issue, our data reveals that Gen Z workers are far less likely than any other generation to afford living alone comfortably.
As mentioned, just 26.9% of Gen Z workers nationally earn enough to afford a typical one-bedroom rental without spending more than 30% of their gross income. However, their older counterparts are all at least twice as likely to reach that standard, including 60.9% of Gen Xers ages 44 to 59, 56.9% of millennials aged 28 to 43 and 55.6% of baby boomers ages 60 to 78.
Percentage of full-time workers earning enough to live alone comfortably (by generation)
| Generation | Estimated full-time workers earning enough to live alone comfortably | Estimated full-time workers | % earning enough to live alone comfortably |
|---|---|---|---|
| Gen Zers | 5,368,193 | 19,920,148 | 26.9% |
| Millennials | 29,732,686 | 52,296,813 | 56.9% |
| Gen Xers | 26,929,576 | 44,216,535 | 60.9% |
| Baby boomers | 9,290,221 | 16,715,801 | 55.6% |
It’s noteworthy that while Gen Z is far less likely than the other three age groups to be able to afford to live alone comfortably, there’s little difference among millennials, Gen Xers and baby boomers. Only about five percentage points separate the most likely from the least likely among those generations to be able to afford to live alone comfortably.
That could be seen as encouraging news for Gen Zers. It suggests that even as housing costs continue to rise, most workers eventually reach an income level where they’re able to afford to live alone comfortably.
Nationally, fewer than 1 in 20 full-time Gen Z workers earn $100,000 or more
For many Americans, $100,000 is a magic number when it comes to salary, with many thinking that if their salary hit that mark, they’d be in great shape.
Unfortunately, Gen Z full-time workers are about five times less likely to earn $100,000 than full-time workers of other generations. In 2024, at least 1 in 5 millennials (22.8%), Gen Xers (28.8%) and baby boomers (25.4%) earned six figures, compared with fewer than 1 in 20 Gen Zers (4.9%).
Percentage of full-time workers earning $100,000+ (by generation)
| Generation | Estimated full-time workers earning $100K+ | Estimated full-time workers | % earning $100K+ |
|---|---|---|---|
| Gen Zers | 973,106 | 19,920,148 | 4.9% |
| Millennials | 11,928,912 | 52,296,813 | 22.8% |
| Gen Xers | 12,753,098 | 44,216,535 | 28.8% |
| Baby boomers | 4,246,267 | 16,715,801 | 25.4% |
Still, some Gen Zers have already reached that magic number. The largest concentration of Gen Z six-figure earners can be found in tech hubs along the coasts. For example, nearly 3 in 10 (29.5%) Gen Zers in San Jose, Calif., make $100,000 or more a year. That’s the highest share among major metros, with San Francisco (20.8%) and Seattle (15.3%) next in line. New York (13.0%) is the only other metro where more than 1 in 10 Gen Z workers earn six figures.
That said, six-figure pay among young workers has risen sharply since 2019. Nationally, the share of full-time workers ages 18 to 27 earning $100,000 or above more than doubled from 2.1% in 2019 to 4.9% in 2024. Growth was most pronounced in metros such as San Jose (10.4 points), New York (7.3) and Seattle (7.0).
However, our analysis shows that six-figure pay doesn’t always translate into comfortable living for Gen Zers in high-cost metros. In San Jose, just 29.6% of Gen Zers can afford to live alone comfortably. Fewer than 1 in 3 Gen Z workers meet our affordability standards in New York (29.4%), Seattle (27.7%) and San Francisco (24.1%) as well.
For most of the rest of the nation, a Gen Z worker earning $100,000 is a rarity. In 78 of the 100 biggest metros, fewer than 5% of Gen Z workers earn six figures, including 16 in which 2% or fewer do. In Wichita, Kan., just 0.4% of Gen Z workers earn $100K — fewer than 1 out of every 200. Things aren’t much better in Tucson, Ariz., and Columbia, S.C., both at 1.0%.
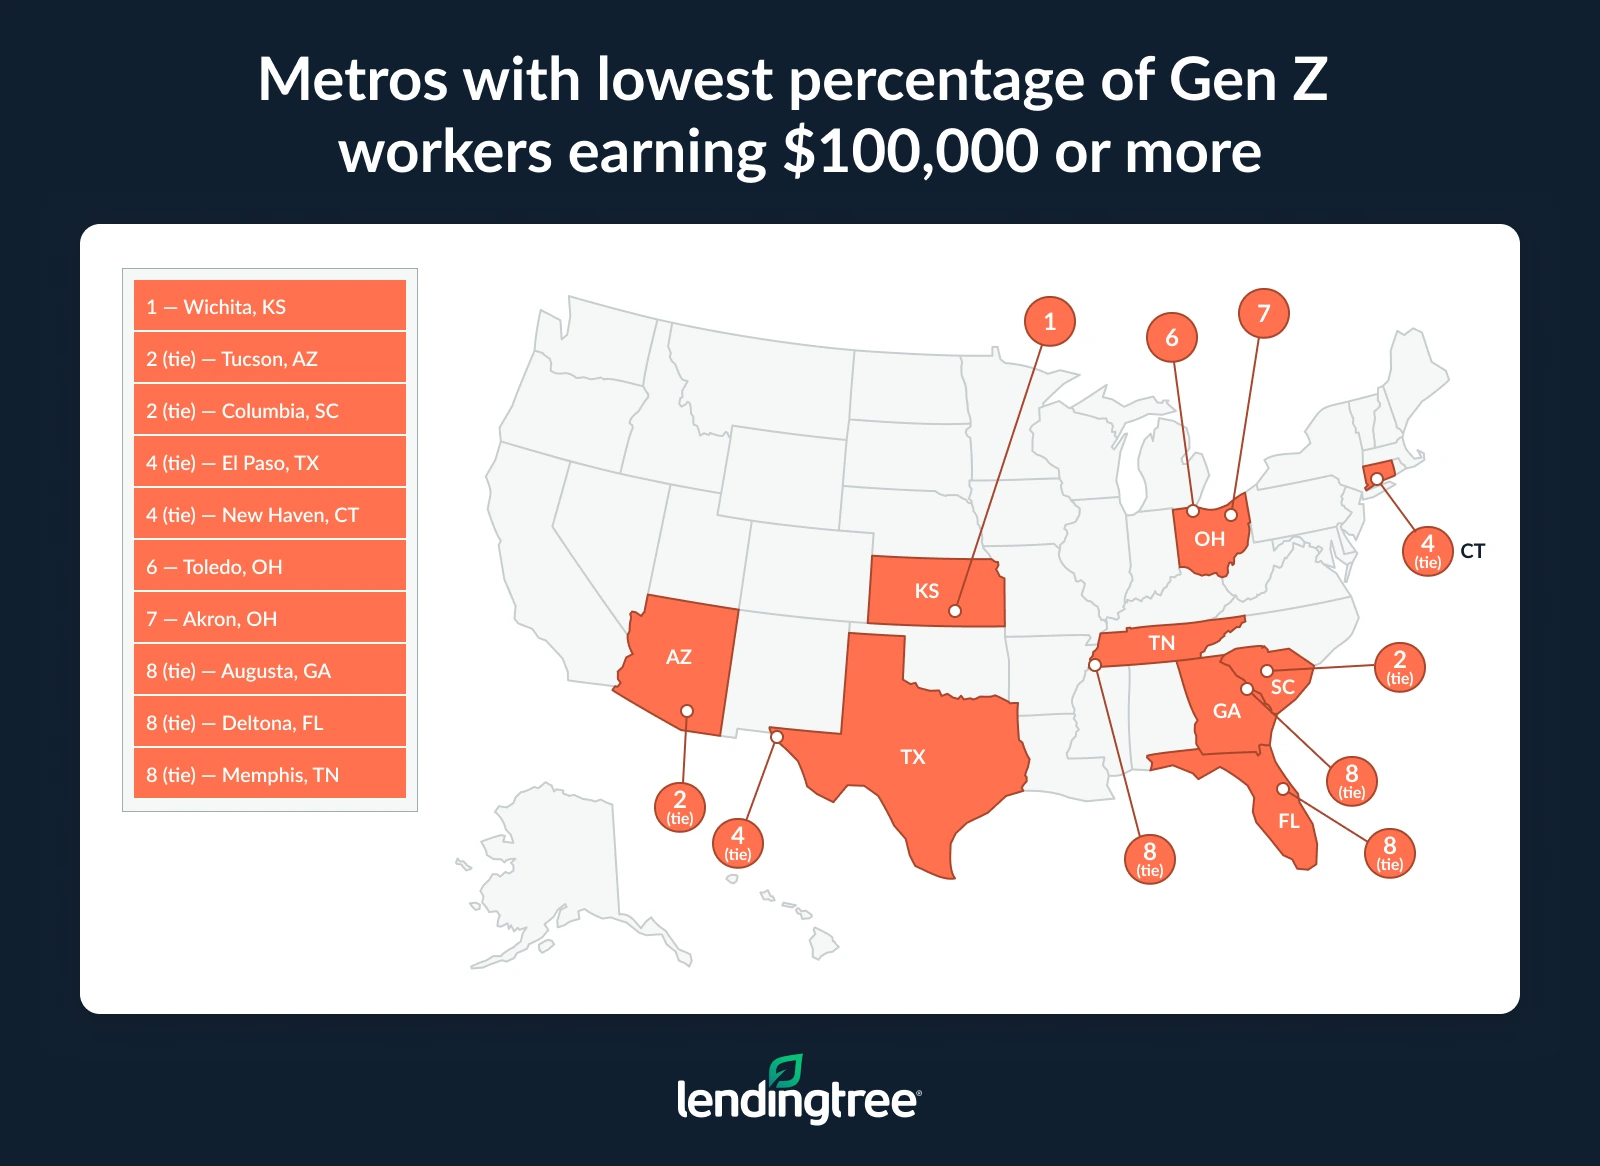
Still, lower incomes in these areas don’t necessarily mean greater struggles when it comes to affordability. For example, nearly half of Gen Z workers in Wichita (48.9%) earn enough to live alone comfortably. In Omaha, Neb., just 2.0% of Gen Zers make $100,000-plus a year, but 43.7% of Gen Z workers can afford to live comfortably. Tucson doesn’t fare quite as well — only 32.0% can live alone affordably, despite just 1.0% earning $100,000 or more — but that 32% is still well above the national average.
Percentage of full-time Gen Z workers earning $100,000+ (by metro)
| Rank | Metro | Estimated full-time Gen Z workers earning $100K+ | Estimated full-time Gen Z workers | % earning $100K+ |
|---|---|---|---|---|
| 1 | San Jose, CA | 32,491 | 110,201 | 29.5% |
| 2 | San Francisco, CA | 45,169 | 217,624 | 20.8% |
| 3 | Seattle, WA | 38,452 | 250,509 | 15.3% |
| 4 | New York, NY | 132,172 | 1,016,537 | 13.0% |
| 5 | Boston, MA | 31,412 | 325,054 | 9.7% |
| 6 | Washington, DC | 35,077 | 367,984 | 9.5% |
| 7 | Bridgeport, CT | 4,876 | 52,708 | 9.3% |
| 8 | Austin, TX | 15,730 | 177,842 | 8.8% |
| 9 | Denver, CO | 18,645 | 213,445 | 8.7% |
| 10 | Hartford, CT | 5,061 | 59,239 | 8.5% |
| 11 | Los Angeles, CA | 49,304 | 617,395 | 8.0% |
| 12 | San Diego, CA | 16,180 | 203,647 | 7.9% |
| 13 | Jackson, MS | 2,286 | 34,025 | 6.7% |
| 14 | Stockton, CA | 2,379 | 38,524 | 6.2% |
| 15 | North Port, FL | 2,425 | 39,665 | 6.1% |
| 16 | Charlotte, NC | 11,643 | 195,569 | 6.0% |
| 17 | Philadelphia, PA | 20,334 | 345,021 | 5.9% |
| 18 | Chicago, IL | 30,683 | 548,063 | 5.6% |
| 19 | Baltimore, MD | 8,962 | 164,230 | 5.5% |
| 20 | Oxnard, CA | 2,214 | 42,012 | 5.3% |
| 20 | Dallas, TX | 30,042 | 571,783 | 5.3% |
| 22 | Sacramento, CA | 5,419 | 104,411 | 5.2% |
| 23 | Pittsburgh, PA | 6,242 | 128,552 | 4.9% |
| 24 | Atlanta, GA | 18,184 | 385,360 | 4.7% |
| 25 | Detroit, MI | 11,253 | 243,375 | 4.6% |
| 25 | Buffalo, NY | 2,789 | 61,104 | 4.6% |
| 25 | Bakersfield, CA | 2,127 | 46,037 | 4.6% |
| 25 | Salt Lake City, UT | 5,117 | 111,550 | 4.6% |
| 29 | Colorado Springs, CO | 2,787 | 62,423 | 4.5% |
| 30 | Louisville, KY | 3,432 | 77,188 | 4.4% |
| 30 | Rochester, NY | 2,578 | 57,993 | 4.4% |
| 30 | Houston, TX | 20,133 | 462,181 | 4.4% |
| 33 | Provo, UT | 2,658 | 61,919 | 4.3% |
| 33 | Minneapolis, MN | 9,762 | 226,766 | 4.3% |
| 35 | Cleveland, OH | 5,529 | 132,029 | 4.2% |
| 35 | Columbus, OH | 5,810 | 137,517 | 4.2% |
| 35 | Milwaukee, WI | 4,159 | 99,476 | 4.2% |
| 38 | St. Louis, MO | 6,749 | 165,204 | 4.1% |
| 38 | Honolulu, HI | 2,796 | 67,454 | 4.1% |
| 38 | Tampa, FL | 7,391 | 181,442 | 4.1% |
| 38 | Portland, OR | 5,471 | 133,016 | 4.1% |
| 42 | Kiryas Joel, NY | 1,485 | 37,321 | 4.0% |
| 42 | Allentown, PA | 2,011 | 50,097 | 4.0% |
| 42 | Fayetteville, AR | 1,769 | 43,840 | 4.0% |
| 45 | Raleigh, NC | 3,693 | 94,650 | 3.9% |
| 46 | Fresno, CA | 2,245 | 59,281 | 3.8% |
| 46 | Cincinnati, OH | 5,766 | 150,013 | 3.8% |
| 46 | Phoenix, AZ | 13,520 | 351,316 | 3.8% |
| 49 | Kansas City, MO | 5,524 | 152,207 | 3.6% |
| 49 | Albuquerque, NM | 2,000 | 55,628 | 3.6% |
| 51 | Syracuse, NY | 1,345 | 38,276 | 3.5% |
| 51 | Riverside, CA | 8,548 | 244,524 | 3.5% |
| 51 | New Orleans, LA | 1,678 | 48,516 | 3.5% |
| 51 | Chattanooga, TN | 1,167 | 33,791 | 3.5% |
| 55 | Baton Rouge, LA | 1,937 | 57,036 | 3.4% |
| 55 | Miami, FL | 10,756 | 318,936 | 3.4% |
| 55 | Knoxville, TN | 1,782 | 52,906 | 3.4% |
| 55 | Des Moines, IA | 1,932 | 57,416 | 3.4% |
| 59 | Palm Bay, FL | 1,040 | 31,057 | 3.3% |
| 59 | Orlando, FL | 5,723 | 171,629 | 3.3% |
| 61 | Albany, NY | 1,708 | 52,627 | 3.2% |
| 61 | Birmingham, AL | 2,036 | 62,996 | 3.2% |
| 61 | Charleston, SC | 1,972 | 61,079 | 3.2% |
| 61 | Worcester, MA | 1,503 | 47,651 | 3.2% |
| 65 | Grand Rapids, MI | 2,701 | 86,347 | 3.1% |
| 65 | Tulsa, OK | 2,196 | 70,502 | 3.1% |
| 65 | Indianapolis, IN | 4,498 | 145,256 | 3.1% |
| 65 | Nashville, TN | 4,848 | 156,955 | 3.1% |
| 69 | Lakeland, FL | 1,311 | 43,350 | 3.0% |
| 69 | Spokane, WA | 985 | 32,622 | 3.0% |
| 71 | Little Rock, AR | 1,495 | 50,878 | 2.9% |
| 71 | Virginia Beach, VA | 3,449 | 120,857 | 2.9% |
| 73 | Greenville, SC | 1,749 | 63,413 | 2.8% |
| 74 | Richmond, VA | 2,114 | 77,476 | 2.7% |
| 74 | Harrisburg, PA | 1,012 | 37,932 | 2.7% |
| 76 | McAllen, TX | 1,448 | 55,825 | 2.6% |
| 76 | Boise, ID | 1,470 | 57,199 | 2.6% |
| 78 | Scranton, PA | 542 | 21,884 | 2.5% |
| 78 | Providence, RI | 2,192 | 88,889 | 2.5% |
| 80 | Cape Coral, FL | 1,129 | 48,901 | 2.3% |
| 80 | Reno, NV | 753 | 33,089 | 2.3% |
| 82 | Winston-Salem, NC | 935 | 41,684 | 2.2% |
| 82 | Jacksonville, FL | 2,166 | 98,496 | 2.2% |
| 84 | Dayton, OH | 1,092 | 53,086 | 2.1% |
| 85 | San Antonio, TX | 3,652 | 181,094 | 2.0% |
| 85 | Omaha, NE | 1,493 | 75,112 | 2.0% |
| 87 | Greensboro, NC | 718 | 41,905 | 1.7% |
| 87 | Las Vegas, NV | 2,323 | 137,664 | 1.7% |
| 87 | Oklahoma City, OK | 1,569 | 94,769 | 1.7% |
| 90 | Ogden, UT | 732 | 44,840 | 1.6% |
| 91 | Memphis, TN | 1,057 | 69,654 | 1.5% |
| 91 | Deltona, FL | 498 | 33,217 | 1.5% |
| 91 | Augusta, GA | 502 | 34,258 | 1.5% |
| 94 | Akron, OH | 552 | 38,777 | 1.4% |
| 95 | Toledo, OH | 403 | 32,477 | 1.2% |
| 96 | New Haven, CT | 320 | 27,906 | 1.1% |
| 96 | El Paso, TX | 669 | 63,273 | 1.1% |
| 98 | Columbia, SC | 570 | 56,152 | 1.0% |
| 98 | Tucson, AZ | 762 | 75,187 | 1.0% |
| 100 | Wichita, KS | 162 | 43,827 | 0.4% |
Information, finance offer clearest paths to six-figure pay for Gen Z workers
Six-figure-earning Gen Zers are rare in most any field. However, our analysis found three fields in which more than 10% of Gen Zers are earning $100,000 or more a year.
Topping that list is the information industry, a broad field that includes publishing, motion picture and sound recording, broadcasting, telecommunications and web search portals. About 1 in 6 (16.3%) full-time Gen Z workers in information earn at least $100,000, the highest share of any industry. Finance, insurance and real estate (12.4%) and professional and business services (11.2%) are next on the list.
At the bottom of the list: arts, entertainment, hospitality and food services (1.1%), personal and community services (1.9%) and retail (2.5%). Personal and community services includes businesses ranging from wedding planning to religious and social-advocacy organizations.
Percentage of full-time Gen Z workers earning $100,000+ (by industry)
| Rank | Industry | Estimated full-time Gen Z workers earning $100K+ | Estimated full-time Gen Z workers | % earning $100K+ |
|---|---|---|---|---|
| 1 | Information | 54,064 | 331,545 | 16.3% |
| 2 | Finance, insurance and real estate | 131,578 | 1,059,047 | 12.4% |
| 3 | Professional and business services | 280,285 | 2,495,186 | 11.2% |
| 4 | Manufacturing | 122,900 | 1,954,348 | 6.3% |
| 5 | Wholesale trade | 15,176 | 331,719 | 4.6% |
| 6 | Public sector and government | 30,372 | 678,988 | 4.5% |
| 6 | Transportation, warehousing and utilities | 46,807 | 1,048,253 | 4.5% |
| 8 | Agriculture, natural resources and mining | 13,622 | 306,575 | 4.4% |
| 9 | Education and health services | 106,001 | 4,025,117 | 2.6% |
| 10 | Retail trade | 62,682 | 2,506,711 | 2.5% |
| 11 | Personal and community services | 17,154 | 924,486 | 1.9% |
| 12 | Arts, entertainment, hospitality and food services | 21,877 | 2,037,113 | 1.1% |
Living comfortably might require you get a little uncomfortable first
It’s easy to feel powerless and adrift when you’re just getting started in your career. However, there are things you can do to make a difference in your ability to live comfortably. It’s all about controlling what you can control, even when it might feel a little scary. Here are some things to try:
- Negotiate salary. This may be the most important thing you can do to help yourself get ahead. It can be nerve-wracking, but you should negotiate your salary every time you change jobs or receive a promotion at your current job. Whenever you secure a higher salary at one job, you’re raising your floor for salaries at future jobs, so do your homework to understand your worth compared to others in your industry, and don’t settle for less just because the company says they can’t go any higher. (To improve your chances of success, keep a running list of your accomplishments, so when the time comes to sing your own praises, you’ll have a whole list of things to brag about.)
- Haggle over rent, too. It won’t always work, but it’s always worth asking. That is true whether you’re new to a place or are a long-term tenant facing a rent increase. For example, if it makes sense for you, consider asking if you could lower your monthly payments by signing a longer lease. Landlords love stability, and longer leases provide just that. Above all, remember this: Finding a new tenant is a headache. It takes time and money that the landlord would prefer not to spend. Assuming you’ve been easy to work with, they’d likely rather have you stick around, and they might even be willing to knock a couple of bucks off your rent each month to make it happen.
- Stay flexible. This report makes it clear that where you live and the industry you work in can make a real difference in your ability to live comfortably. Of course, that doesn’t mean that you have to go and find an information-industry job in Scranton. However, it does mean that being open to new locations and different types of job opportunities can make a difference.
- Minimize your high-interest debt load. Keeping your housing costs at less than 30% of your overall income can certainly be a challenge. Some have even debated whether that’s a realistic rule of thumb anymore, given how high housing costs have soared. What isn’t in dispute, however, is that avoiding high-interest debt can make it easier to manage whatever other costs you might face. Sure, it can be far easier said than done, but it should certainly be a goal. If you’re struggling with credit card debt, a 0% balance transfer credit card can be a powerful weapon, as can a low-interest personal loan. You can also consider calling your credit card issuer and asking for a lower rate on your credit card. That works way more often than you’d realize.
Methodology
LendingTree analysts used U.S. Census Bureau 2019 and 2024 American Community Survey (ACS) microdata with one-year estimates via IPUMS USA to analyze wages among young, full-time workers across the 100 most populated U.S. metros with available data.
The analysis was limited to employed, full-time workers who usually worked 35 or more hours per week and reported valid annual wage and salary income. All estimates were calculated using IPUMS person weights.
For 2024-only analyses, Gen Z workers were defined as those ages 18 to 27. For change-over-time analyses, LendingTree examined workers ages 18 to 27 in each year analyzed to ensure consistent age cohorts across years.
Workers were classified as earning $100,000 or more if their reported annual wage and salary income was at least $100,000.
To estimate whether workers earned enough to live alone comfortably, LendingTree calculated a metro-specific income threshold using the 30% rent affordability rule. For each metro, analysts used U.S. Census Bureau 2024 data on gross monthly rent for a one-bedroom apartment, multiplied the monthly rent by 12 to estimate annual rent and divided the result by 0.30 to estimate the minimum annual income needed for rent to account for no more than 30% of income.
The results were used to calculate, by metro or industry:
- Percentage of full-time workers earning enough to live comfortably by generation, 2024
- Percentage of full-time Gen Z workers earning enough to live alone comfortably, 2024
- Percentage of full-time workers earning $100,000 by generation, 2024
- Percentage of full-time Gen Z workers earning $100,000 or more, 2024
- Change in the percentage of full-time workers ages 18-27 earning $100,000 or more, 2019-24
- Percentage of full-time Gen Z workers earning $100,000 or more by industry, 2024
Get debt consolidation loan offers from up to 5 lenders in minutes
Recommended Articles
62% of Gen Zers Feel Pressured to Keep Up With the Joneses, As Many Overspend Into Debt
More Than Half of Gen Zers and Millennials Have a Side Hustle, 80% of Whom Say They’re More Reliant on the Extra Money Due to the Current Economy
How Gen Zers Use Their Credit Cards, From Balances and Limits to On-Time Payments