Full-Service Restaurant Tips With a Card Average Nearly 20%; Delaware Tips Most, While California Is Stingiest


July 18, 2025, update: The initial version of this study inaccurately used U.S. Department of Agriculture (USDA) data to estimate states’ percentages of away-from-home food spending that goes toward tips. Utilizing Toast, we’ve updated the tipping data by state.
Americans who tipped with a card or digital payment at full-service restaurants gave an average of nearly 20% in the first quarter of 2025.
Delaware had the biggest tippers overall, according to data from payment technology company Toast, while California was stingiest. Meanwhile, government data shows Americans spend a far bigger portion of their food budget on dining out than decades ago.
Here’s more of what we found.
The Toast data doesn’t include cash tips. It also only includes the averages on transactions in which tips were included, rather than all restaurant transactions.
Key findings
- The average tip at full-service restaurants with a card or digital payment is nearly 20%. The average was 19.4% in the first quarter of 2025. The average was lower at quick-service restaurants (15.8%), but that’s perhaps higher than one might expect at these restaurants, where tipping typically isn’t as common.
- Delaware leads in total tipping rates, while California is last. Delaware tipped a U.S.-best average of 22.1% when considering full-service and quick-service restaurants. It had the nation’s highest tip average at full-service restaurants (22.6%) and the third-highest at quick-service restaurants (18.4%). Meanwhile, California ranked last in full-service (17.8%) and total tips (17.3%), while having the third-lowest average at quick-service restaurants (14.8%).
- Americans increasingly dine out. In 2000, spending on food consumed away from home accounted for an average of 49.4% of food budgets. By 2023 — the most recent year for which data was available — that share had risen to 55.7%, indicating a significant shift in consumer behavior.
- The District of Columbia has the highest per-capita spending on dining out, while Illinois has seen the fastest growth. Those in the nation’s capital spend an estimated $10,291 per person annually on food purchased to be consumed away from home. That’s far higher than second-place Nevada at $6,752. Meanwhile, Illinois has seen the most significant increase in dining-out expenditures, climbing 13.5 points from 42.4% of the state’s total food spending in 2000 to 55.9% in 2023.
Full-service restaurant tip average nears 20%
Americans spend an enormous amount of money each year on tips. The development of mobile payment technologies has made it easier to tip in virtually any situation, including many in which tips traditionally haven’t been customary.
Of course, tipping is nothing new in restaurants. According to the latest Restaurant Trends Report from Toast — a payments technology company used in about 140,000 locations as of March 2025 — Americans are tipping an average of 19.4% in full-service restaurants and 15.8% in quick-service restaurants when using a card or digital payment. (Cash tips aren’t factored in.)
Average restaurant tips
| Avg., full-service restaurants | 19.4% |
| Avg., quick-service restaurants | 15.8% |
It should be no surprise that Americans spend the most on tips at full-service restaurants. While 15% was the standard tip amount for many years, those days appear long gone, as Toast data shows the average tip at full-service restaurants has hovered between 19% and 20% since at least 2018.
The Toast data makes clear, however, that people aren’t limiting their tipping to full-service places. They also give significant tips at limited-service or quick-service restaurants — such as Chipotle, Starbucks and Pizza Hut. The average tip given at these locations — 15.8% — was only a few points lower than that at full-service establishments.
That’s great news for workers at those places. However, tipping isn’t traditionally as common at quick-service restaurants as at full-service ones. Toast data from Q1 2024 showed that 75% of full-service restaurant visitors tipped with a card or a digital payment, while just 49% of quick-service customers did the same. Again, the percentage of those who tip is likely higher in both places because the above data doesn’t factor in cash tips. However, it’s still likely the case that quick-service restaurant visitors are significantly more likely to forgo tips than their counterparts at full-service establishments.
Delaware leads nation in tipping rate, while California ranks last
For the most part, we don’t see massive differences in tipping tendencies from state to state. All but a few states’ residents average between 19% and 22% when it comes to tipping at full-service restaurants and between 15% and 18% tips at quick-service restaurants.
However, a few states stand out. When including full- and quick-service restaurants, Delaware had the nation’s highest average tip at 22.1%. That’s a full percentage point higher than any other state, with West Virginia (21.0%), New Hampshire (20.9%) and Indiana (20.7%) having the next highest overall averages.
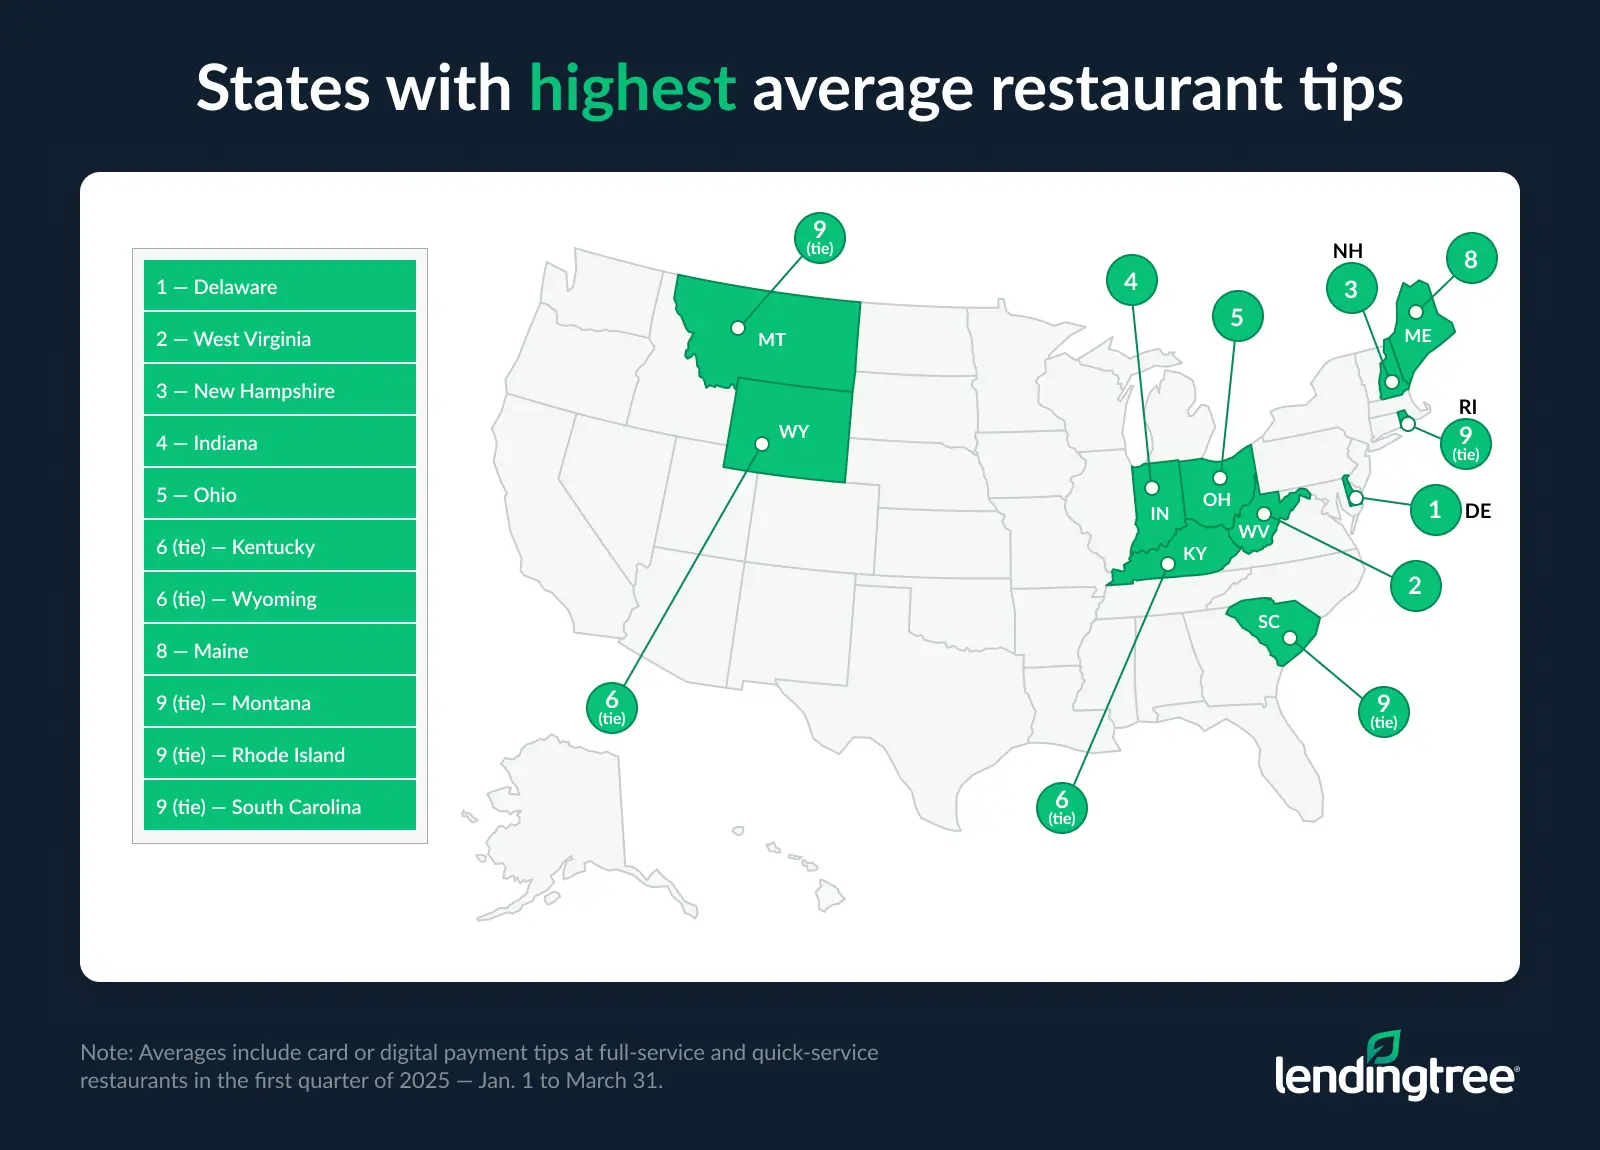
Delaware also had the highest average tip at full-service restaurants (22.6%), edging out New Hampshire, Maine and West Virginia. Meanwhile, Wyoming averaged the highest tip percentage at quick-service restaurants (18.9%), with West Virginia, Delaware and Iowa not far behind.
California dominated the bottom of the list. When factoring in full-service and quick-service restaurants, the state tipped just 17.3% — nearly five points lower than Delaware. Washington state (17.8%) and Florida and Nevada (both 18.2%) weren’t far behind.
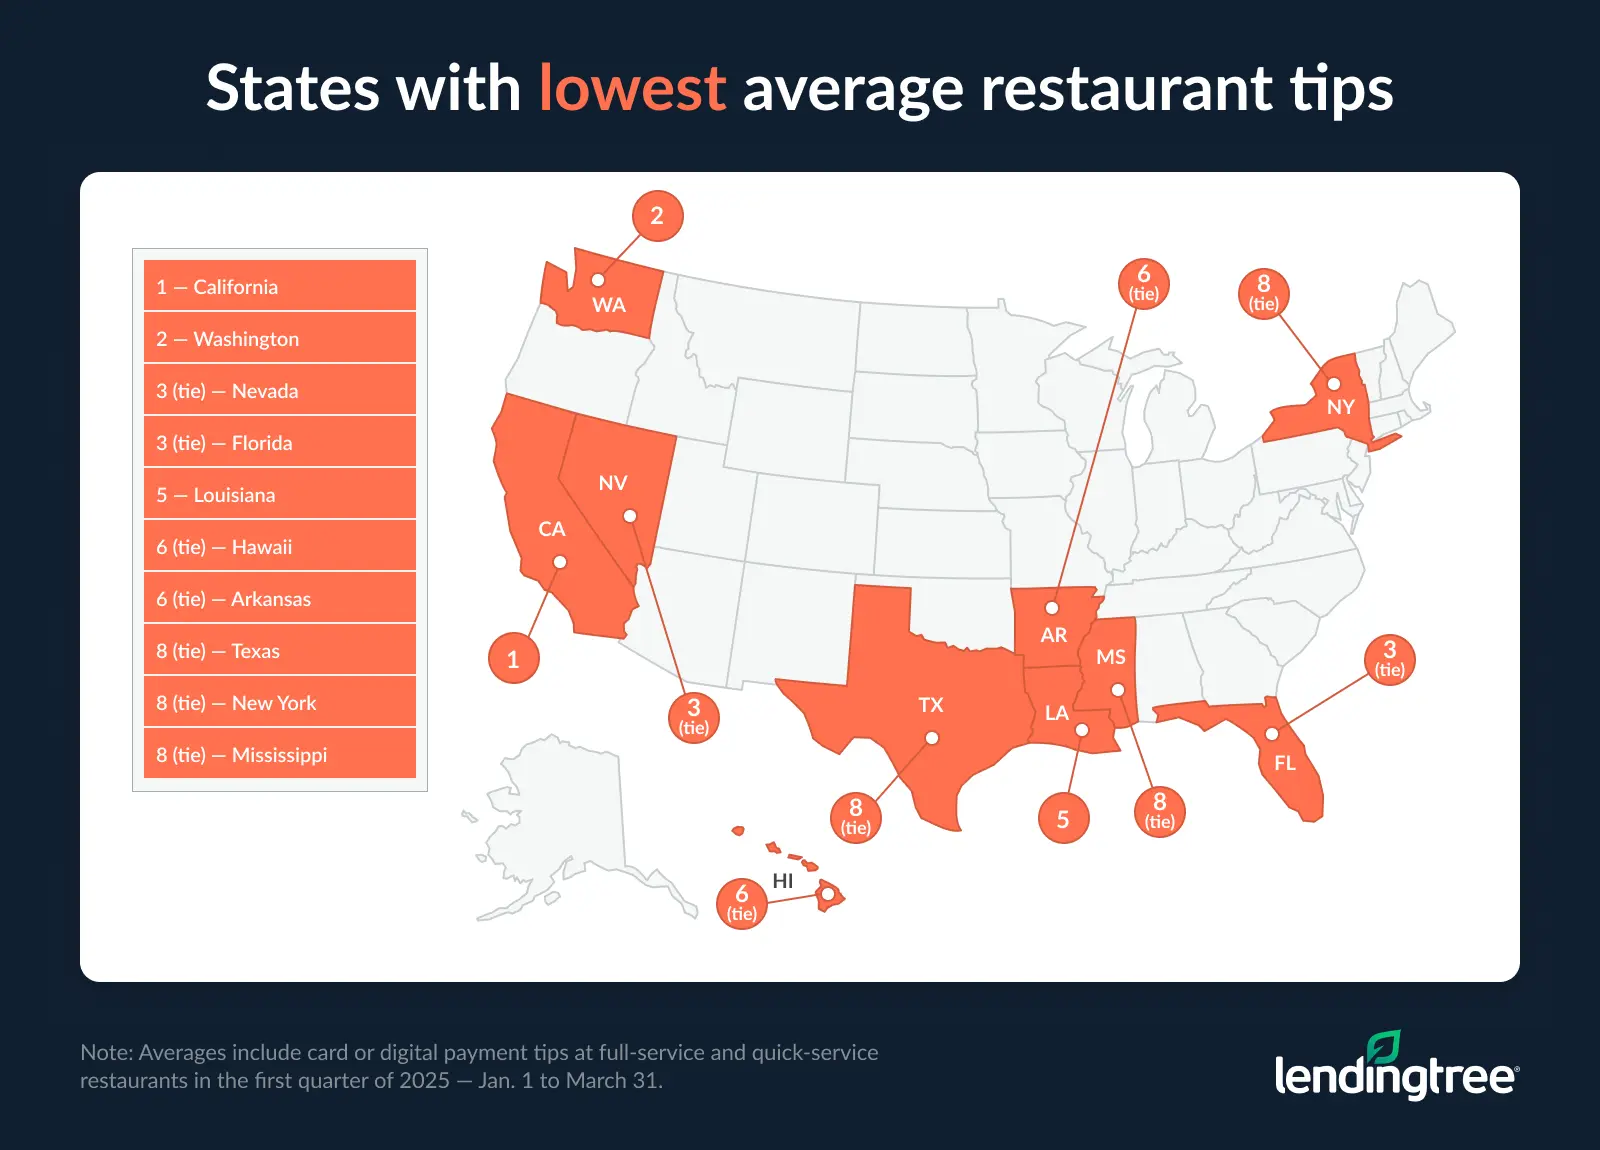
California tipped the least at full-service restaurants (17.8%), with Washington state, Florida and Nevada again close behind. At quick-service restaurants, California’s average tips ranked third-worst at 14.8%. New Jersey (13.9%) and Massachusetts (14.7%) had lower averages, and their neighbors in Connecticut (15.1%) and New York (15.2%) weren’t far behind.
Full rankings: Tipping rates by state
| Rank | State | Avg., restaurants | Avg., full-service restaurants | Avg., quick-service restaurants |
|---|---|---|---|---|
| 1 | Delaware | 22.1% | 22.6% | 18.4% |
| 2 | West Virginia | 21.0% | 21.4% | 18.7% |
| 3 | New Hampshire | 20.9% | 21.8% | 15.4% |
| 4 | Indiana | 20.7% | 21.2% | 17.1% |
| 5 | Ohio | 20.6% | 21.1% | 17.7% |
| 6 | Wyoming | 20.5% | 20.7% | 18.9% |
| 6 | Kentucky | 20.5% | 20.9% | 17.8% |
| 8 | Maine | 20.4% | 21.5% | 16.2% |
| 9 | Montana | 20.2% | 20.8% | 17.5% |
| 9 | South Carolina | 20.2% | 20.7% | 17.1% |
| 9 | Rhode Island | 20.2% | 21.2% | 15.6% |
| 12 | Wisconsin | 20.1% | 20.5% | 17.7% |
| 12 | Pennsylvania | 20.1% | 20.7% | 16.1% |
| 14 | Iowa | 20.0% | 20.3% | 18.0% |
| 14 | Michigan | 20.0% | 20.6% | 16.2% |
| 16 | Nebraska | 19.9% | 20.3% | 16.9% |
| 16 | Missouri | 19.9% | 20.4% | 16.8% |
| 16 | Kansas | 19.9% | 20.6% | 15.6% |
| 19 | Vermont | 19.5% | 20.2% | 16.4% |
| 19 | Idaho | 19.5% | 20.3% | 16.2% |
| 19 | Massachusetts | 19.5% | 20.3% | 14.7% |
| 22 | North Carolina | 19.4% | 19.9% | 17.0% |
| 22 | Alaska | 19.4% | 19.7% | 17.0% |
| 22 | Colorado | 19.4% | 19.9% | 16.7% |
| 22 | Tennessee | 19.4% | 20.0% | 16.5% |
| 22 | Maryland | 19.4% | 19.9% | 15.9% |
| 27 | North Dakota | 19.3% | 19.8% | 17.0% |
| 27 | Alabama | 19.3% | 19.9% | 16.6% |
| 27 | South Dakota | 19.3% | 19.8% | 16.4% |
| 27 | Oklahoma | 19.3% | 19.9% | 15.9% |
| 27 | Virginia | 19.3% | 19.9% | 15.7% |
| 27 | Connecticut | 19.3% | 19.9% | 15.1% |
| 33 | Minnesota | 19.2% | 19.8% | 16.0% |
| 33 | Arizona | 19.2% | 19.8% | 15.7% |
| 33 | Illinois | 19.2% | 19.6% | 15.6% |
| 36 | Oregon | 19.1% | 19.7% | 17.3% |
| 36 | New Mexico | 19.1% | 19.5% | 16.8% |
| 38 | Utah | 18.9% | 19.8% | 15.2% |
| 39 | Georgia | 18.8% | 19.3% | 16.1% |
| 39 | New Jersey | 18.8% | 19.4% | 13.9% |
| 41 | Mississippi | 18.7% | 19.1% | 16.5% |
| 41 | Texas | 18.7% | 19.1% | 16.1% |
| 41 | New York | 18.7% | 19.2% | 15.2% |
| 44 | Arkansas | 18.6% | 19.3% | 16.0% |
| 44 | Hawaii | 18.6% | 19.0% | 15.4% |
| 46 | Louisiana | 18.5% | 19.0% | 16.0% |
| 47 | Nevada | 18.2% | 18.7% | 15.7% |
| 47 | Florida | 18.2% | 18.5% | 15.6% |
| 49 | Washington | 17.8% | 18.3% | 15.6% |
| 50 | California | 17.3% | 17.8% | 14.8% |
The government data used in this report distinguishes between spending at locations where food is purchased for consumption at home and spending at locations where food is purchased for consumption away from home.
- Locations where food is typically purchased to be consumed at home include (but aren’t limited to) grocery stores, convenience stores, warehouse clubs, mail-order and home-delivery food services.
-
Locations where food is typically purchased to be consumed away from home include (but aren’t limited to) full-service restaurants, limited-service restaurants (often fast food places), drinking establishments, hotels, motels and vending machines.
In this portion of this report, our focus is on the latter, which we refer to as away-from-home food spending.
Americans are increasingly dining out
July 18, 2025, update: This portion of our June 10, 2025, report remains the same.
Whether they’re going to full-service restaurants, fast-food joints, vending machines or somewhere else, people are clearly dining out more.
In 2000, away-from-home food spending made up slightly less than half (49.4%) of Americans’ food budgets. In 2023, the most recent year for which data is available, that share had risen to 55.7%. That marks the highest percentage going back to at least 1997.
% of Americans’ food budgets spent on away-from-home food
| Year | At-home food spending | Away-from-home food spending | Total food budget | % spent on away-from-home food |
|---|---|---|---|---|
| 2023 | $411,194.28 | $516,924.00 | $928,118.28 | 55.7% |
| 2022 | $422,086.31 | $491,775.16 | $913,861.47 | 53.8% |
| 2021 | $430,328.91 | $460,209.53 | $890,538.44 | 51.7% |
| 2020 | $413,256.91 | $386,049.63 | $799,306.54 | 48.3% |
| 2019 | $397,798.47 | $455,372.50 | $853,170.97 | 53.4% |
| 2018 | $388,964.16 | $447,550.25 | $836,514.41 | 53.5% |
| 2017 | $377,144.84 | $437,078.56 | $814,223.40 | 53.7% |
| 2016 | $363,050.31 | $420,249.72 | $783,300.03 | 53.7% |
| 2015 | $352,916.94 | $405,442.41 | $758,359.35 | 53.5% |
| 2014 | $352,467.06 | $383,380.50 | $735,847.56 | 52.1% |
| 2013 | $347,860.88 | $365,936.34 | $713,797.22 | 51.3% |
| 2012 | $344,168.84 | $353,097.69 | $697,266.53 | 50.6% |
| 2011 | $331,058.78 | $343,576.09 | $674,634.87 | 50.9% |
| 2010 | $329,764.41 | $331,166.75 | $660,931.16 | 50.1% |
| 2009 | $322,327.28 | $325,303.28 | $647,630.56 | 50.2% |
| 2008 | $329,685.19 | $338,137.81 | $667,823.00 | 50.6% |
| 2007 | $335,621.69 | $342,307.84 | $677,929.53 | 50.5% |
| 2006 | $332,749.13 | $336,031.97 | $668,781.10 | 50.2% |
| 2005 | $323,175.47 | $325,940.66 | $649,116.13 | 50.2% |
| 2004 | $310,999.50 | $317,090.59 | $628,090.09 | 50.5% |
| 2003 | $306,135.56 | $304,989.47 | $611,125.03 | 49.9% |
| 2002 | $300,040.69 | $295,360.84 | $595,401.53 | 49.6% |
| 2001 | $298,205.88 | $289,715.28 | $587,921.16 | 49.3% |
| 2000 | $294,291.66 | $287,323.84 | $581,615.50 | 49.4% |
Since the percentage of spending on food consumed away from home plunged in 2020 due to the pandemic, there have been three consecutive years of significant growth. That growth has pushed away-from-home food spending levels past prepandemic peaks.
D.C. has highest per-capita dining-out spending, while Illinois has seen massive growth
When it comes to per-capita spending on dining out, no place can match D.C. People in the nation’s capital spent about $3,500 more on dining out than any other state in 2023 — $10,291, compared to second-place Nevada’s $6,752.
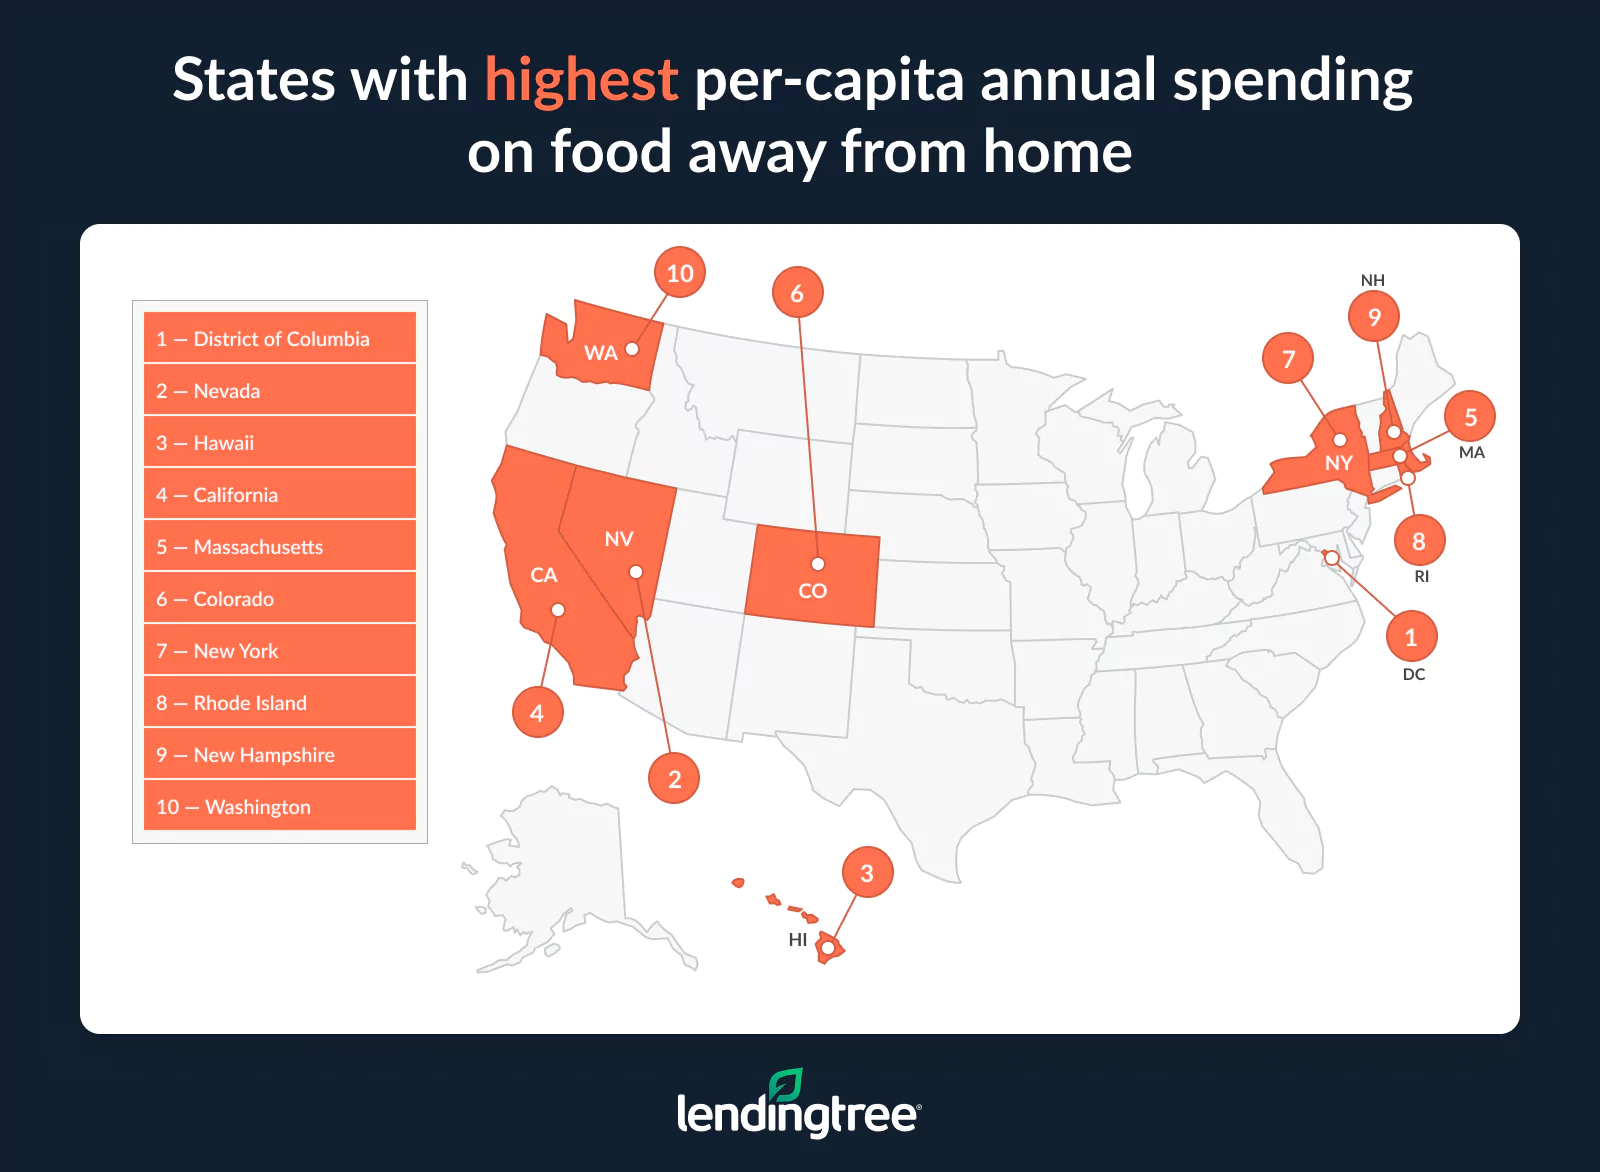
Three of the four top states in per-capita spending on dining out can be found in the West, with Hawaii and California ranking third and fourth behind Nevada. Northeastern states make up much of the rest of the top 10, including Massachusetts, New York, Rhode Island and New Hampshire.
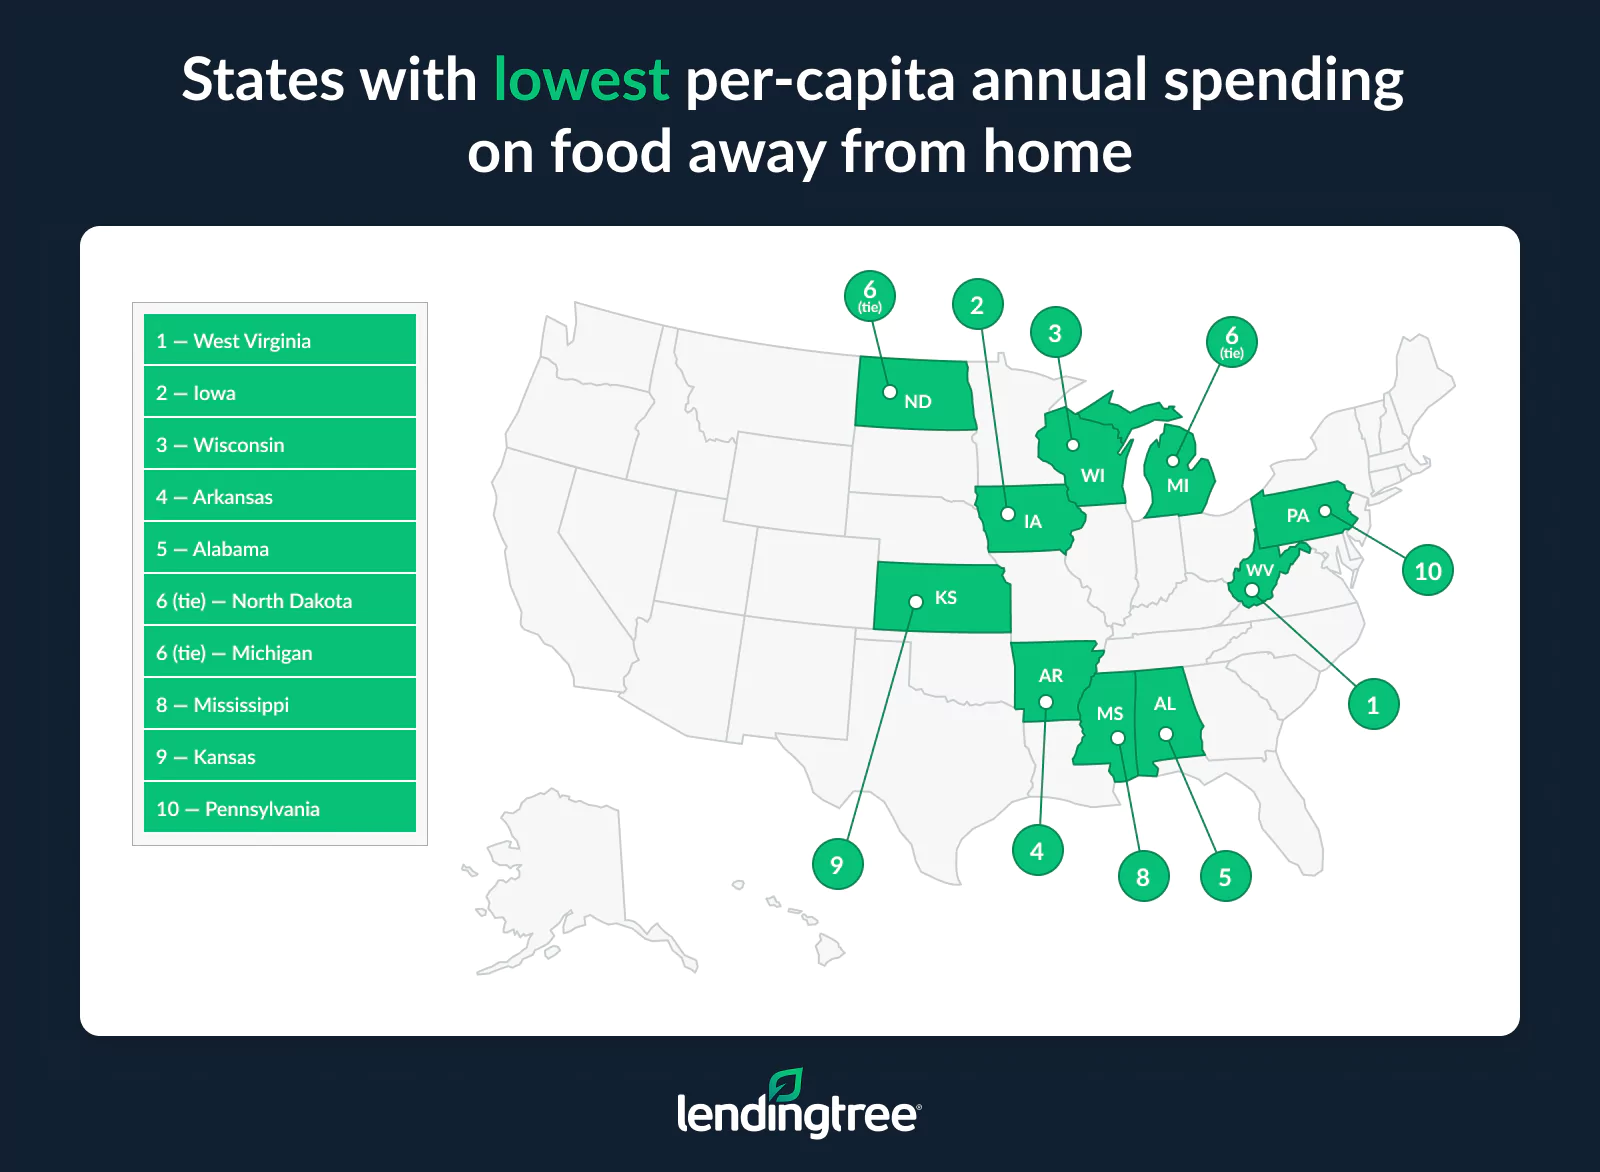
Midwestern and Southern states dominate the bottom of the list. West Virginia residents spend the least per capita on dining out, followed by Iowa, Wisconsin, Arkansas and Alabama.
While Illinois residents don’t make the top 10 for per-capita dining-out spending, they’ve undergone a major shift in their food spending budgets since 2000. Back then, food away from home made up just 42.4% of Illinoisans’ food budgets. In 2023, that number had risen 13.5 points to 55.9%. That’s the biggest shift seen in any state during that period, though six other states — Connecticut, South Carolina, New York, New Jersey, New Hampshire and North Carolina — all saw at least double-digit shifts toward more dining-out spending.
On the flip side, just three places have seen dining-out spending make up a smaller portion of their food budget since 2000: Nevada (down 4.4 points), D.C. (down 2.7) and Rhode Island (down 1.4).
Full rankings: Per-capita annual spending on away-from-home food by state
| Rank | State | Per-capita spend |
|---|---|---|
| 1 | District of Columbia | $10,291 |
| 2 | Nevada | $6,752 |
| 3 | Hawaii | $6,628 |
| 4 | California | $5,072 |
| 5 | Massachusetts | $4,626 |
| 6 | Colorado | $4,579 |
| 7 | New York | $4,424 |
| 8 | Rhode Island | $4,412 |
| 9 | New Hampshire | $4,224 |
| 10 | Washington | $4,182 |
| 11 | Florida | $4,091 |
| 12 | Wyoming | $3,976 |
| 13 | Texas | $3,895 |
| 14 | Oregon | $3,882 |
| 15 | Maine | $3,872 |
| 16 | Alaska | $3,805 |
| 17 | Arizona | $3,781 |
| 18 | Connecticut | $3,776 |
| 19 | New Mexico | $3,751 |
| 20 | Illinois | $3,744 |
| 21 | New Jersey | $3,737 |
| 22 | South Carolina | $3,726 |
| 23 | Tennessee | $3,708 |
| 24 | Delaware | $3,647 |
| 25 | Montana | $3,614 |
| 26 | Georgia | $3,544 |
| 27 | North Carolina | $3,542 |
| 28 | Louisiana | $3,520 |
| 29 | Vermont | $3,506 |
| 30 | Virginia | $3,505 |
| 30 | Maryland | $3,505 |
| 32 | Utah | $3,477 |
| 33 | Ohio | $3,296 |
| 34 | Minnesota | $3,273 |
| 35 | Missouri | $3,252 |
| 36 | Nebraska | $3,185 |
| 37 | Indiana | $3,138 |
| 38 | Idaho | $3,111 |
| 39 | Kentucky | $3,108 |
| 40 | Oklahoma | $3,100 |
| 41 | South Dakota | $3,099 |
| 42 | Pennsylvania | $3,091 |
| 43 | Kansas | $3,031 |
| 44 | Mississippi | $2,927 |
| 45 | Michigan | $2,918 |
| 45 | North Dakota | $2,918 |
| 47 | Alabama | $2,898 |
| 48 | Arkansas | $2,877 |
| 49 | Wisconsin | $2,848 |
| 50 | Iowa | $2,760 |
| 51 | West Virginia | $2,597 |
Full rankings: Change in % of food budget spent on away-from-home food purchases
| Rank | State | % of 2000 food spending | % of 2023 food spending | Point change |
|---|---|---|---|---|
| 1 | Illinois | 42.4% | 55.9% | 13.5 |
| 2 | Connecticut | 42.4% | 54.6% | 12.2 |
| 3 | South Carolina | 43.1% | 54.3% | 11.1 |
| 4 | New York | 47.9% | 58.5% | 10.6 |
| 5 | New Jersey | 45.0% | 55.2% | 10.2 |
| 6 | New Hampshire | 40.3% | 50.4% | 10.1 |
| 7 | North Carolina | 41.2% | 51.3% | 10.1 |
| 8 | Massachusetts | 48.1% | 57.5% | 9.4 |
| 9 | Alabama | 39.6% | 48.5% | 8.9 |
| 10 | Maryland | 42.4% | 50.9% | 8.6 |
| 11 | Texas | 44.0% | 52.6% | 8.5 |
| 12 | Florida | 45.2% | 53.4% | 8.3 |
| 13 | Vermont | 41.9% | 49.7% | 7.8 |
| 14 | Pennsylvania | 41.8% | 49.3% | 7.6 |
| 15 | West Virginia | 41.1% | 48.6% | 7.5 |
| 16 | Nebraska | 39.7% | 46.9% | 7.2 |
| 17 | Delaware | 46.2% | 53.2% | 7.1 |
| 18 | California | 49.6% | 56.7% | 7.0 |
| 19 | Wyoming | 42.9% | 49.8% | 7.0 |
| 20 | Minnesota | 44.1% | 51.0% | 6.9 |
| 21 | Virginia | 42.7% | 49.6% | 6.9 |
| 22 | Kentucky | 43.5% | 50.3% | 6.8 |
| 23 | South Dakota | 41.4% | 47.8% | 6.4 |
| 24 | Louisiana | 44.7% | 51.1% | 6.4 |
| 25 | Maine | 41.6% | 47.6% | 6.0 |
| 26 | Arkansas | 40.6% | 46.5% | 5.9 |
| 27 | Montana | 41.4% | 47.1% | 5.8 |
| 28 | Wisconsin | 40.1% | 45.4% | 5.3 |
| 29 | North Dakota | 41.0% | 46.2% | 5.2 |
| 30 | Indiana | 44.6% | 49.7% | 5.1 |
| 31 | Iowa | 37.8% | 42.7% | 5.0 |
| 32 | Washington | 43.8% | 48.8% | 4.9 |
| 33 | Oklahoma | 46.4% | 51.0% | 4.6 |
| 34 | New Mexico | 47.1% | 51.4% | 4.3 |
| 35 | Mississippi | 44.7% | 49.0% | 4.3 |
| 36 | Tennessee | 48.6% | 52.2% | 3.6 |
| 37 | Idaho | 39.1% | 42.7% | 3.6 |
| 38 | Utah | 41.3% | 44.8% | 3.6 |
| 39 | Missouri | 46.0% | 49.5% | 3.5 |
| 40 | Ohio | 46.9% | 50.3% | 3.4 |
| 41 | Colorado | 48.0% | 50.9% | 2.9 |
| 42 | Georgia | 47.8% | 50.7% | 2.9 |
| 43 | Kansas | 42.5% | 45.2% | 2.7 |
| 44 | Oregon | 44.5% | 47.0% | 2.4 |
| 45 | Arizona | 47.3% | 49.7% | 2.4 |
| 46 | Alaska | 43.2% | 45.5% | 2.3 |
| 47 | Michigan | 43.8% | 46.0% | 2.2 |
| 48 | Hawaii | 60.9% | 61.1% | 0.2 |
| 49 | Rhode Island | 57.7% | 56.3% | -1.4 |
| 50 | District of Columbia | 77.2% | 74.5% | -2.7 |
| 51 | Nevada | 66.0% | 61.5% | -4.4 |
Tips for managing your food budget without going broke
It’s no secret that food has become significantly more expensive over the past few years, and these increases have put a strain on American families. We’ve seen it time and again in LendingTree reports, including those in which people have said fast food has become a luxury and that a growing number of Americans are using buy now, pay later loans to purchase groceries.
Still, as Americans, we love dining out. I know I spend more money on it than I should, and I’m certain I’m not alone. Even as the rising cost of groceries stretches household budgets to the breaking point, we don’t want to give up the fun and excitement — and convenience — of dining out.
How do you balance it all without taking on debt? First of all, you shouldn’t try to cut corners by giving smaller tips. Service industry workers’ livelihoods often depend on customers’ tips, and if you can’t afford to give a standard tip at a restaurant, you probably shouldn’t be there. It isn’t fair to those working hard to provide you with great service.
Here are a few tips for managing your food budget:
- Rewards credit cards are key. If groceries are a big part of your family’s budget and you’re not shopping with a rewards credit card, you’re doing yourself a disservice. The same is true if you spend a lot of money dining out. Countless credit cards offer extra rewards for grocery shopping and/or restaurant spending, and those rewards can help extend your budget. It may not seem like 2% or 3% cash back is that impactful, but it adds up to very real money when you’re earning it consistently for years.
- Shopping around matters. Many of us are creatures of habit when it comes to grocery shopping, buying the same items from the same place week after week. And that can lead to us paying more than we need to for groceries. You don’t need to drive across town to save a quarter on a gallon of milk, but being willing to compare prices from different grocery stores can lead to real savings.
- Take advantage of loyalty programs and app-based deals. Your favorite grocery store and fast-food place probably have apps you can download to find deals and get other perks you wouldn’t find elsewhere. I know I’ve earned free meals many times from restaurants that I frequent. You might even get a free entree on your birthday for giving them your email address. Of course, as with any rewards program, you don’t want to overspend just to get rewards. That’s a recipe for trouble.
- Budget for it. If you’re passionate about something and you spend a lot of money on it, it should be part of your budget. That’s the case with dining out. Doing so makes you accountable to yourself and your family for what you spend, but it also provides the information you need to adjust your spending if you stray a little off track one month.
Methodology
July 18, 2025, update: This has been adjusted to reflect utilizing the Toast data.
To highlight tipping rates by state, we used the Q1 2025 Restaurant Trends Report from Toast. Toast breaks down the tipping rates by all restaurants, full-service restaurants and quick-service restaurants. Averages include card or digital payment tips in the first quarter of 2025 — Jan. 1 to March 31. Cash tips aren’t included.
Additionally, we analyzed 2023 U.S. Department of Agriculture (USDA) Economic Research Service (ERS) National Food Expenditure Series data. Specifically, we compared total spending on food at home and food away from home. Population data is via the U.S. Census Bureau.
Get debt consolidation loan offers from up to 5 lenders in minutes