Best — and Worst — Large Metros for Homeownership
In the face of persistently steep house prices and relatively high mortgage rates, buying a home in today’s housing market can be tough. And buying is only part of the battle — once you buy, you’ll likely have to face new challenges that come with being a homeowner.
That said, the long-term benefits of homeownership are often substantial, and (even if it’s not always a cakewalk) being a homeowner can be well worth it.
LendingTree analyzed data from the U.S. Census Bureau American Community Survey to find which of the nation’s largest metropolitan areas are the best for homeowners. Specifically, we ranked the nation’s 50 largest metros based on nine equally weighted categories:
- Five-year median home value appreciation
- Median household income for owner-occupied homes
- Homeownership rate
- Median annual taxes for owner-occupied homes
- Median ratio of housing costs to household income for owner-occupied homes
- Share of occupied households with one or fewer occupants per room
- Share of occupied households without complete plumbing facilities
- Share of occupied households without complete kitchen facilities
- Share of occupied households with no phone service available
To learn why we chose these variables, see the methodology.
Key findings
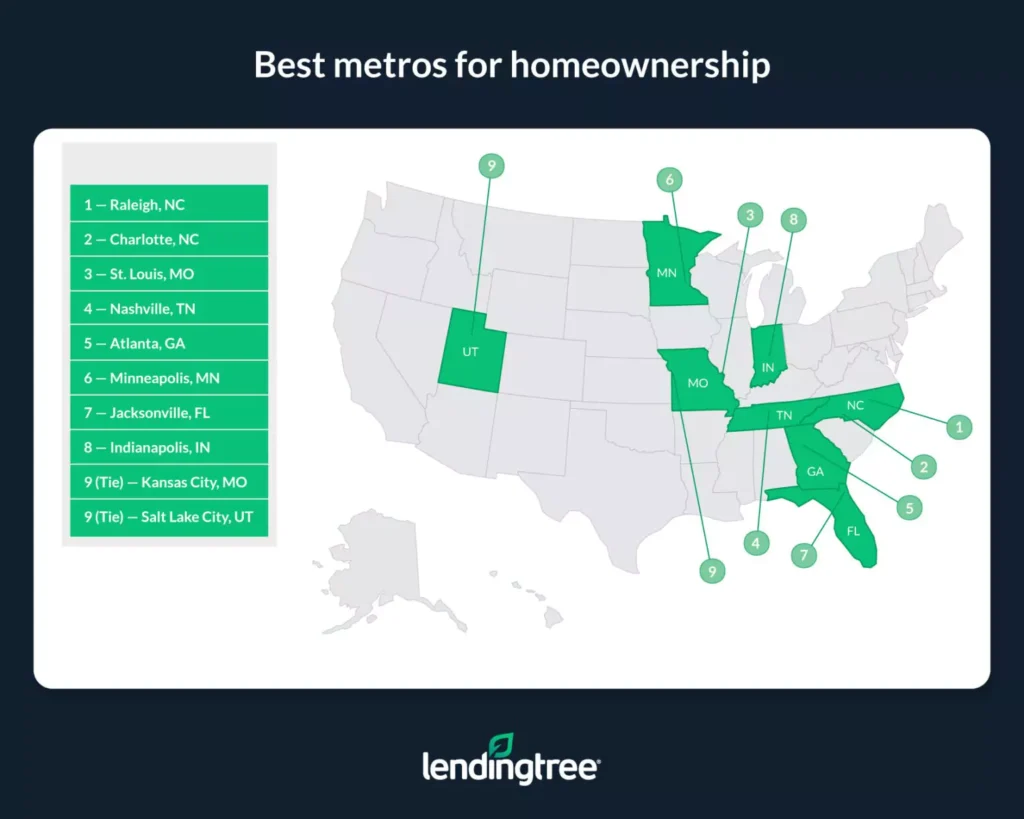
- Raleigh, N.C., Charlotte, N.C., and St. Louis are the three best large metros for homeownership. Each of these metros ranks among the lowest for share of homes lacking complete plumbing and kitchen facilities (both are lowest in Raleigh), meaning they appear to have relatively high-quality housing available. At the same time, owner-occupied households in these areas tend to spend proportionately less of their incomes on their housing costs than households in other metros. This, combined with other factors — such as Raleigh and St. Louis’ high homeownership rates and Charlotte’s large five-year median home value growth — helps these metros rise above their shortcomings.
- Half of the metros in our study’s top 10 are in the South. In addition to Raleigh and Charlotte, Nashville, Tenn. (fourth), Atlanta (fifth), and Jacksonville, Fla. (seventh), made it into the top 10. The non-Southern metros in the top 10 are in the Midwest and West: St. Louis (third), Minneapolis (sixth), Indianapolis (eighth), and Kansas City, Mo., and Salt Lake City (tied for ninth).
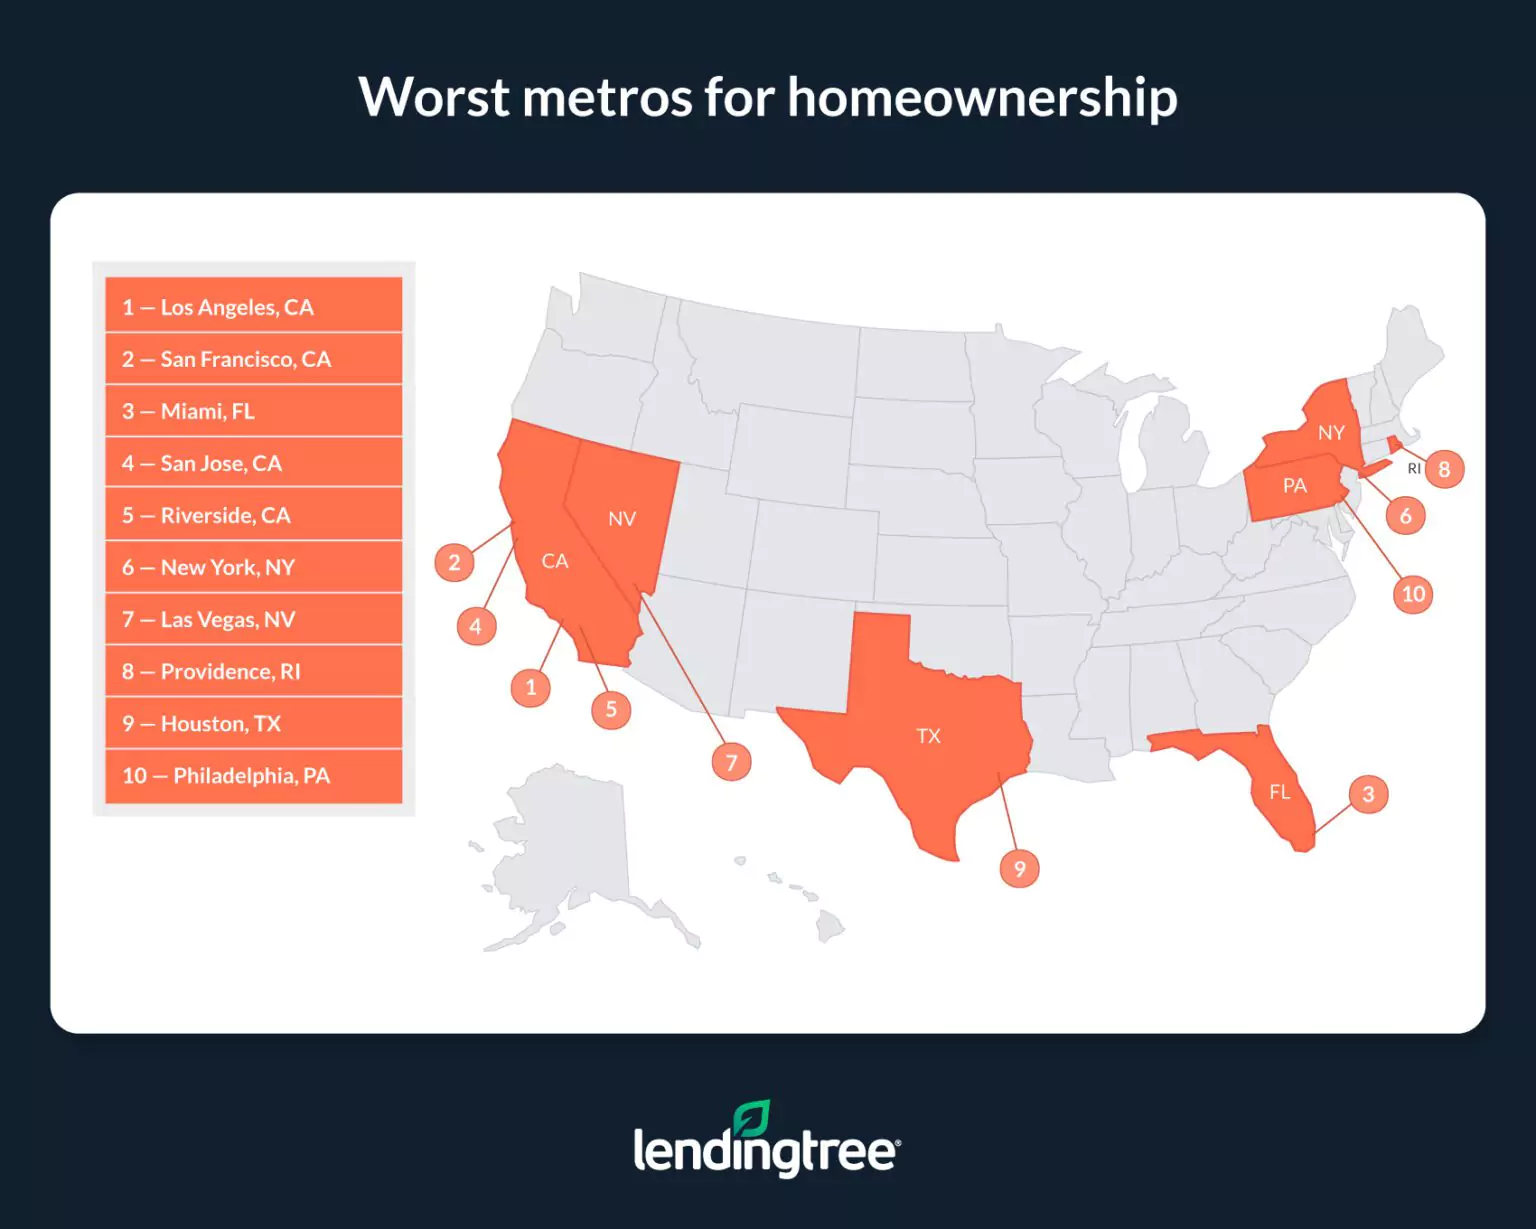
- Los Angeles, San Francisco and Miami are the three worst large metros for homeownership. Apart from high incomes for owner-occupied households in Los Angeles and San Francisco and decent home price appreciation in Miami, these metros rank poorly in each category we used to form our overall ranking.
The overall rankings in this study are based on nine equally weighted factors. As a result, a metro doesn’t have to score perfectly in each category to attain a high spot. At the same time, a metro that’s strong in one or two areas can rank poorly. It’s for this reason that St. Louis can rank third despite having low home value growth, while Los Angeles can rank last despite having a high median income for owner-occupied households.
Best metros for homeownership
No. 1: Raleigh, N.C.
- Five-year median home value appreciation: 45.73%
- Median household income for owner-occupied homes: $104,945
- Homeownership rate: 67.77%
- Median annual taxes for owner-occupied homes: $2,586
- Median ratio of housing costs to household income for owner-occupied homes: 16.60%
- Share of occupied households with one or fewer occupants per room: 97.60%
- Share of occupied households without complete plumbing facilities: 0.18%
- Share of occupied households without complete kitchen facilities: 0.25%
- Share of occupied households with no phone service available: 0.72%
No. 2: Charlotte, N.C.
- Five-year median home value appreciation: 52.37%
- Median household income for owner-occupied homes: $87,909
- Homeownership rate: 66.67%
- Median annual taxes for owner-occupied homes: $1,986
- Median ratio of housing costs to household income for owner-occupied homes: 16.10%
- Share of occupied households with one or fewer occupants per room: 97.70%
- Share of occupied households without complete plumbing facilities: 0.24%
- Share of occupied households without complete kitchen facilities: 0.55%
- Share of occupied households with no phone service available: 0.69%
No. 3: St. Louis
- Five-year median home value appreciation: 27.48%
- Median household income for owner-occupied homes: $85,410
- Homeownership rate: 71.22%
- Median annual taxes for owner-occupied homes: $2,668
- Median ratio of housing costs to household income for owner-occupied homes: 16.30%
- Share of occupied households with one or fewer occupants per room: 98.80%
- Share of occupied households without complete plumbing facilities: 0.25%
- Share of occupied households without complete kitchen facilities: 0.59%
- Share of occupied households with no phone service available: 0.61%
Worst metros for homeownership
No. 1: Los Angeles
- Five-year median home value appreciation: 29.49%
- Median household income for owner-occupied homes: $114,209
- Homeownership rate: 48.89%
- Median annual taxes for owner-occupied homes: $5,214
- Median ratio of housing costs to household income for owner-occupied homes: 22.10%
- Share of occupied households with one or fewer occupants per room: 89.40%
- Share of occupied households without complete plumbing facilities: 0.37%
- Share of occupied households without complete kitchen facilities: 1.60%
- Share of occupied households with no phone service available: 1.01%
No. 2: San Francisco
- Five-year median home value appreciation: 30.93%
- Median household income for owner-occupied homes: $152,603
- Homeownership rate: 55.84%
- Median annual taxes for owner-occupied homes: $7,335
- Median ratio of housing costs to household income for owner-occupied homes: 20.20%
- Share of occupied households with one or fewer occupants per room: 93.60%
- Share of occupied households without complete plumbing facilities: 0.69%
- Share of occupied households without complete kitchen facilities: 1.42%
- Share of occupied households with no phone service available: 0.85%
No. 3: Miami
- Five-year median home value appreciation: 39.10%
- Median household income for owner-occupied homes: $80,036
- Homeownership rate: 60.62%
- Median annual taxes for owner-occupied homes: $3,276
- Median ratio of housing costs to household income for owner-occupied homes: 21.90%
- Share of occupied households with one or fewer occupants per room: 94.70%
- Share of occupied households without complete plumbing facilities: 0.40%
- Share of occupied households without complete kitchen facilities: 0.80%
- Share of occupied households with no phone service available: 0.98%
Homeownership is often expensive, but it can be well worth it
Unlike renters, homeowners are typically fully responsible for keeping their homes well maintained and paying other costs like taxes and home insurance. This, combined with how costly a mortgage can be, can make owning a home expensive.
But while homeownership can cost more than alternatives, like renting or living with family, it could pay off in the long run. For example, those who’ve built home equity into their properties can tap into that equity via a loan or line of credit and use the funds for various purposes, from making home improvements to consolidating high-interest debt. On top of that, homeowners tend to have significantly higher net worths than non-owners.
Even outside of monetary matters, homeownership has plenty of perks, like having more freedom to paint or modify a living space. Homeowners also have more freedom to choose whether to get a pet or install appliances like a dishwasher or a washer and dryer.
All in all, while homeownership isn’t without drawbacks and isn’t the best choice for everyone, it can be worth it for many people. This is true even in today’s high-cost housing market, where buying can be especially challenging.
Tips for homeowners
Buying a home can be challenging, as can maintaining it once it becomes yours. Here are three tips on how to successfully become, and remain, a homeowner:
- Shop around for a mortgage before buying. Different lenders often offer different rates to the same borrowers, meaning homebuyers can potentially secure a lower rate by shopping around for a mortgage before buying a house. The lower the rate you can get, the more affordable your monthly payments are likely to be.
- Remember that a mortgage isn’t the only thing which you’re responsible for. While a mortgage is likely to be the most expensive housing-related cost that homeowners will face, other costs like insurance, utilities and taxes are also important. Remember that failure to pay your taxes can cause you to lose your home.
- Don’t bite off more than you can chew. Though the allure of owning a home can be hard to ignore, it’s important for homeowners not to overextend their budgets. Generally speaking, it’s recommended that people spend no more than 30% of their monthly income on housing costs, as overspending can leave you housing cost-burdened and without enough cash for important expenses like groceries or car and credit card payments.
Methodology
Data in this study comes from the U.S. Census Bureau 2021 American Community Survey with one-year estimates — the latest available at the time of writing. The nine variables that make up the overall ranking were weighted equally. We chose them for the following reasons:
- Five-year median home value appreciation: Larger home value appreciations can benefit homeowners as they can give them access to more equity to tap into as well as more profit should they choose to sell.
- Median household income for owner-occupied homes: Higher household incomes can make it easier for homeowners to deal with the costs of homeownership.
- Homeownership rate: A higher homeownership rate can signify that it’s easier for people within a given area to become homeowners.
- Median annual taxes for owner-occupied homes: Lower property taxes make the overall cost of owning a home more affordable.
- Median ratio of housing costs to household income for owner-occupied homes: The less money that homeowners tend to spend on housing costs, the more they’ll have left over for other important expenses and the easier it’ll likely be for them to stay on top of things like their mortgage payments.
- Share of occupied households with one or fewer occupants per room: Fewer occupants per room signify that homeowners are less likely to deal with overcrowding.
- Share of occupied households without complete plumbing facilities: A small share of homes that lack complete plumbing facilities (like those that lack hot and cold running water) signifies that an area has higher-quality housing stock than areas with a larger share. High-quality housing stock is important for homeowners, as it’ll generally mean they have more housing options to choose from and that their homes will be easier to maintain.
- Share of occupied households without complete kitchen facilities: As is the case with plumbing facilities, a small share of homes that lack complete kitchen facilities (those that lack a refrigerator or a stove/range) signify that an area has higher-quality housing stock than areas with a larger share.
- Share of occupied households with no phone service available: Phone service, or a lack thereof, is also indicative of the overall quality of an area’s housing stock. A smaller share of homes without phone service can mean that an area’s housing is of higher quality.
View mortgage loan offers from up to 5 lenders in minutes
Recommended Articles
Back-to-School Shopping Defies Inflation: Families Spend Nearly the Same as Before the Pandemic
Delaware, D.C. and Texas Have the Highest Business Bankruptcy Filing Rates in the US
Best Health Insurance Companies in Georgia in 2026
Homebuyer Down Payments by Generation in the 50 Largest US Metros
Best Merchant Cash Advances in July 2026
How To Refinance a Car Loan With Bad Credit
Best Bad Credit Auto Refinance Companies in July 2026
Home Insurance Takes Up Nearly a Fifth of Monthly Housing Costs in Some States
America’s Tourism-Dependent Metros Aren’t Always the Obvious Ones
Personal Bankruptcy Filings Have Risen 47% Since 2022, Marking a Third Straight Annual Increase