The $23,000 Secret: January Is the Cheapest Month to Buy a Home


If you’re thinking about buying a home, timing could be worth tens of thousands of dollars.
This LendingTree study shows that when looking at median prices in 2024, January buyers could save an average of $23,000 compared to those who purchase a 1,500-square-foot home in May.
Here’s a closer look at why January is the cheapest, May is the priciest and more.
Key findings
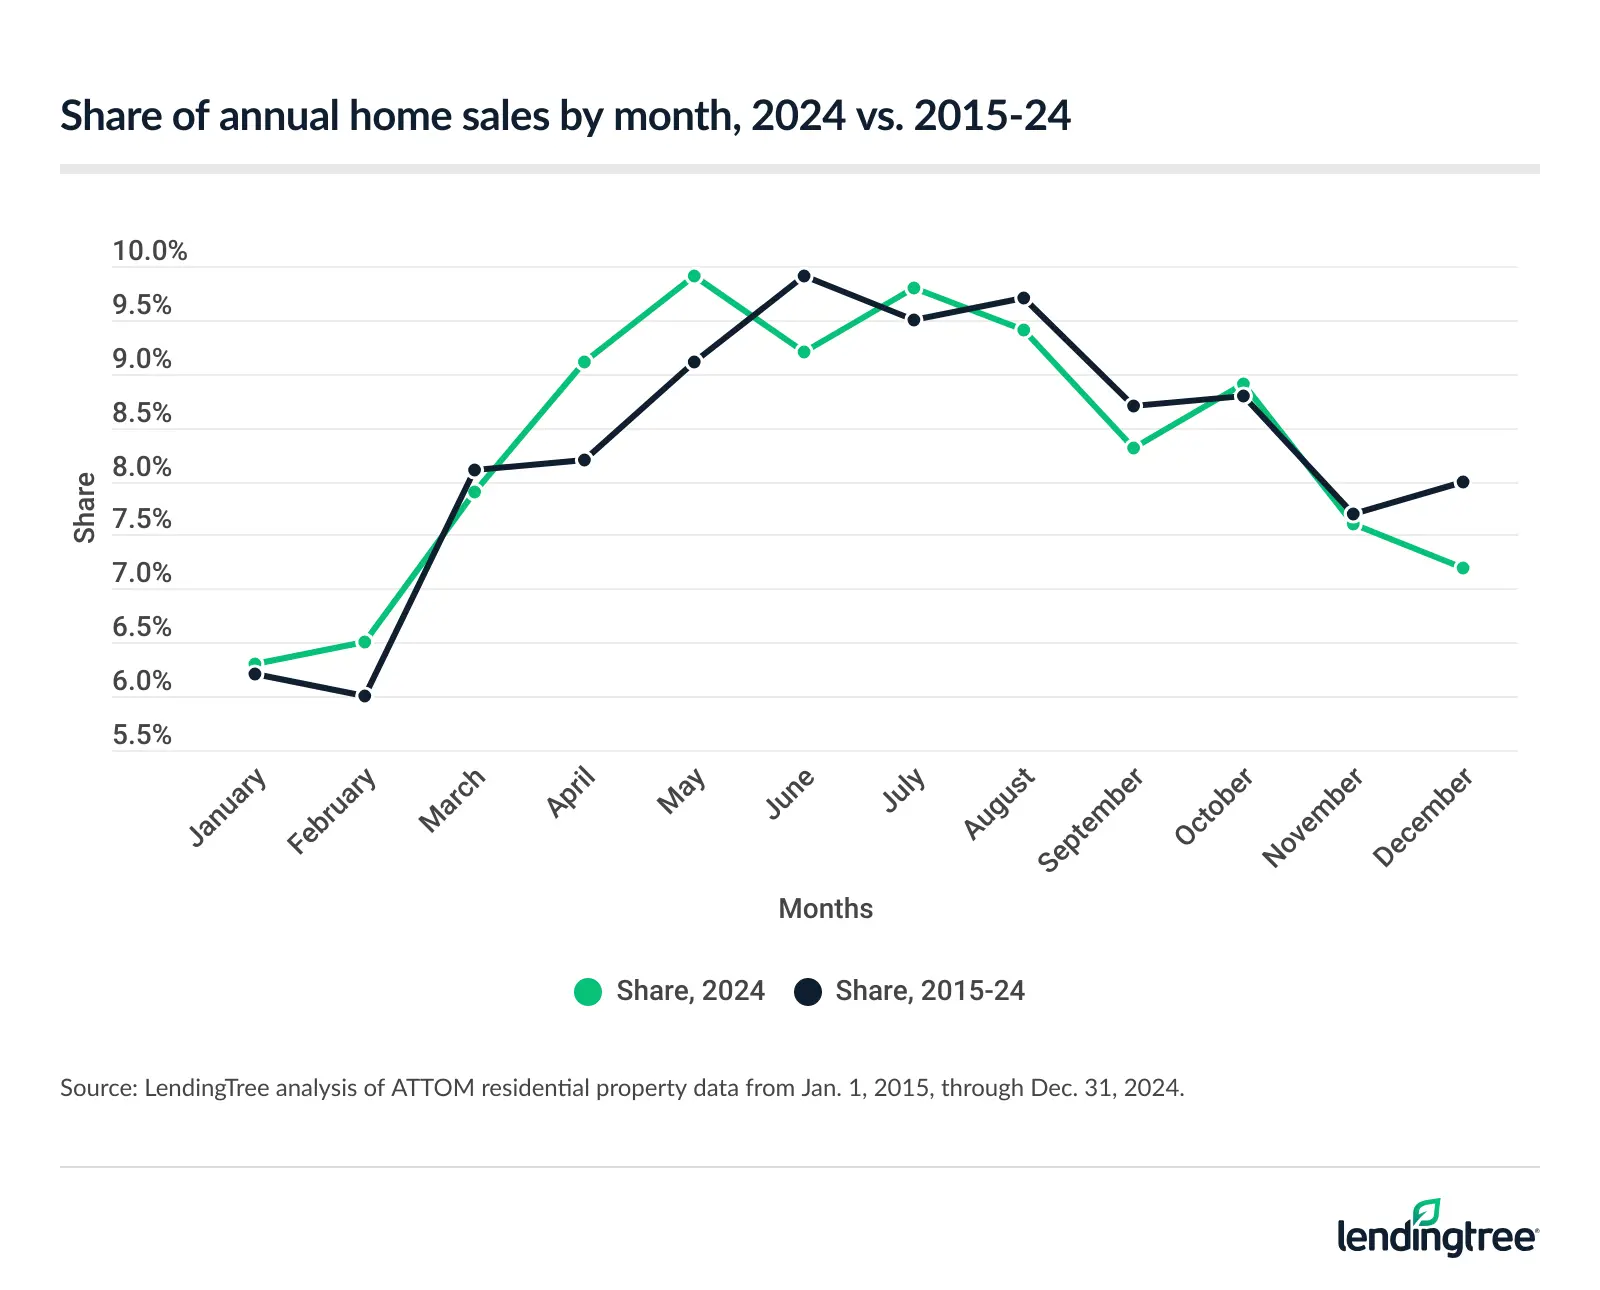
- Americans buy about 1.4 times more homes in the summer than in the winter. From 2015 through 2024, summer (June to August) accounted for 29.1% of total residential property sales. That’s ahead of spring (March to May) at 25.4%, fall (September to November) at 25.2% and winter (December to February) at 20.2%. In 2024 alone, May had the highest share of sales at 9.9%, while January had the lowest at 6.3%.
- May was the priciest month for homebuyers in 2024, at a median of $194.20 per square foot. January’s median was 8.0% lower at $178.60, while February’s was 5.4% lower at $183.70. That means buying a 1,500-square-foot home in January instead of May could save you $23,400.
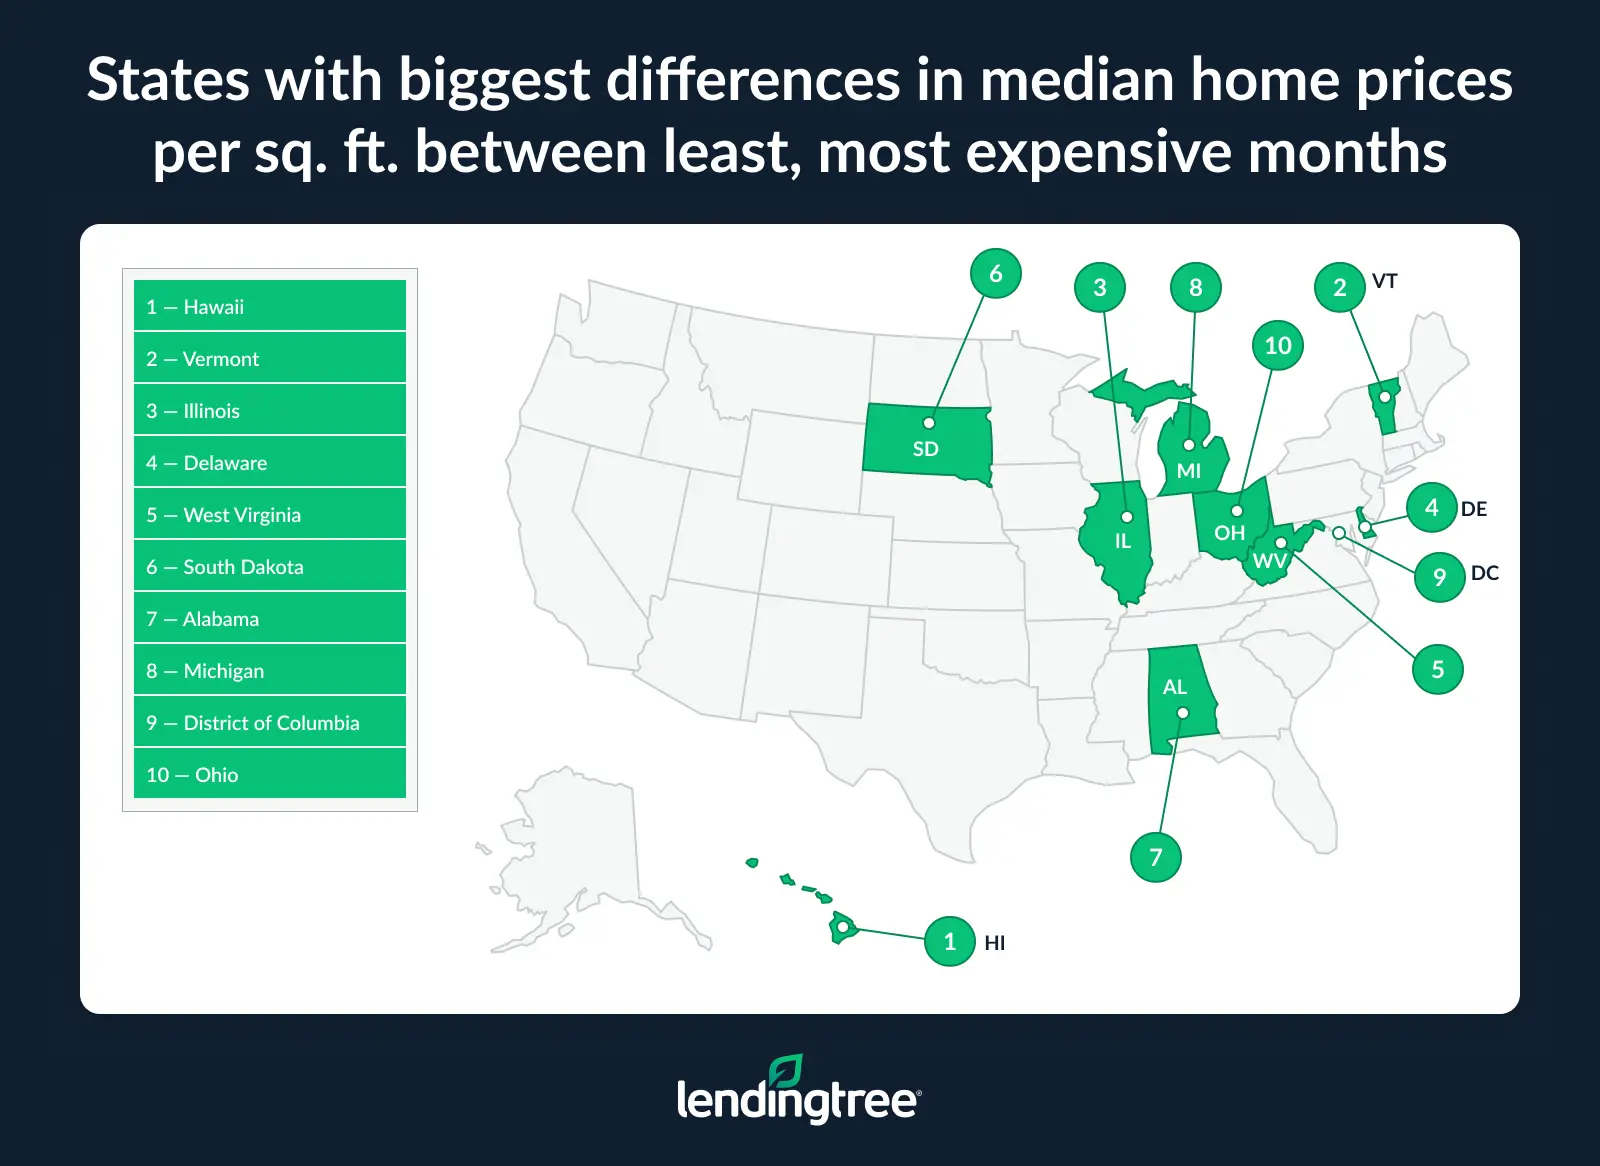
- The state-level gap between the lowest and highest median prices per square foot (based on peaks and valleys) ranged from 3.2% to 25.7% in 2024. Hawaii had the largest difference at 25.7% ($490.50 low and $660.20 high), ahead of Vermont (22.3%) and Illinois (21.4%). Among states with available data, the gaps were lowest in Arizona (3.2%), Colorado (6.2%), and Florida and South Carolina (both at 6.9%).
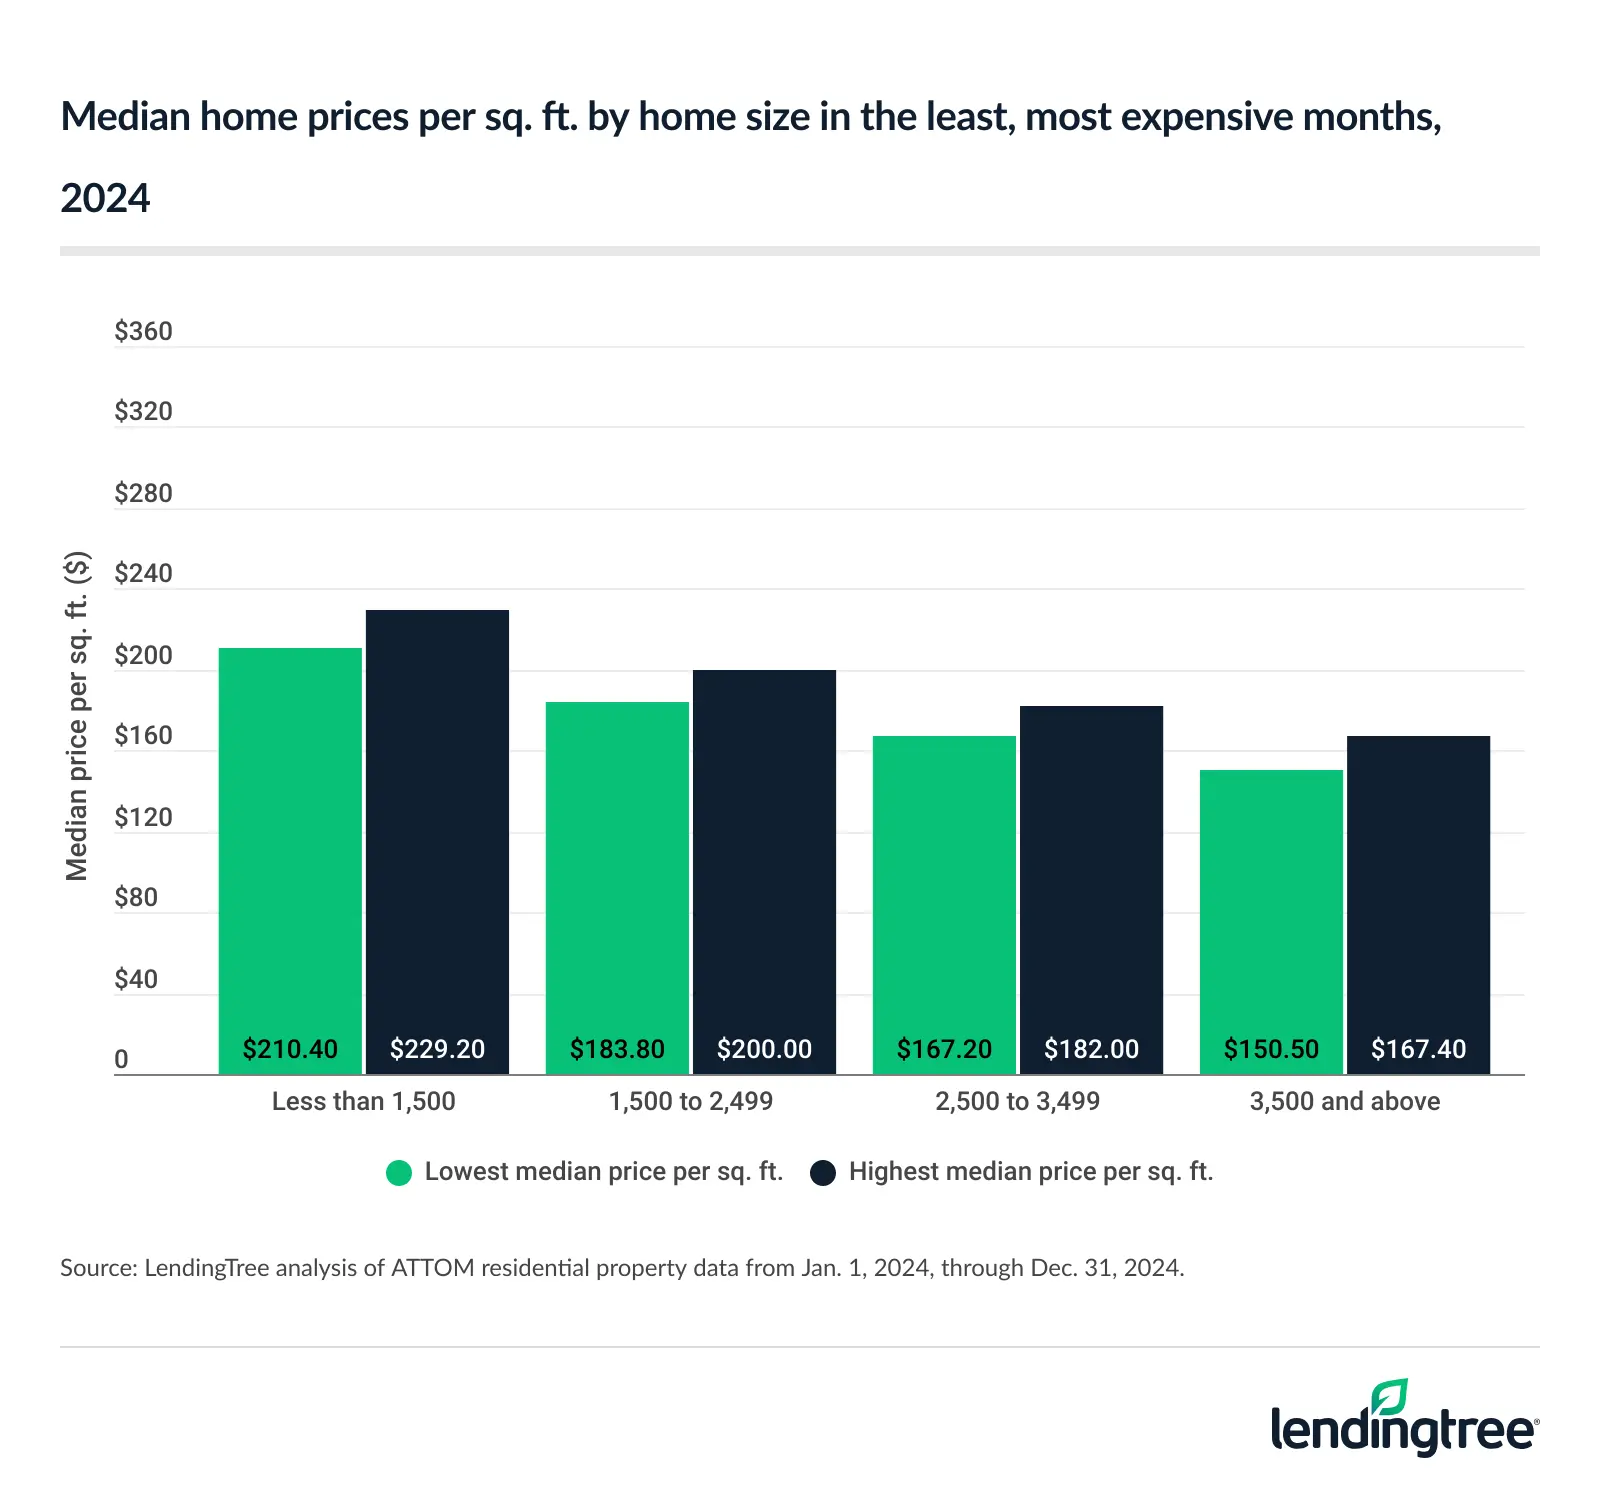
- While the price per square foot varies across home sizes, it always peaks in June and bottoms out in January. Homes under 1,500 square feet ranged from $210.40 to $229.20 per square foot (an 8.2% variation) in 2024, while larger homes at 3,500 square feet or larger ranged from $150.50 to $167.40 (a 10.1% variation).
Sales data is derived from assessor records, which include the last recorded sale date and price.
The results indicate the month of the last sale, not the listing activity. Since closing on a home typically takes over 40 days, recorded sales often reflect contracts signed one to two months earlier.
Americans buy more homes in summer
Many Americans prefer to buy a home in the summer. In fact, Americans buy about 1.4 times more homes in the summer (June to August) than in the winter (December to February).
Examining 2015 through 2024, 29.1% of total residential property sales occurred in the summer. Spring (March to May) had the second-largest share at 25.4%. Fall (September to November) followed at 25.2%, while winter ranked last at 20.2%.
Looking at 2024 alone, 9.9% of sales occurred in May — the highest by month. Meanwhile, January had the lowest at 6.3%.
Why is summer more popular than winter? Matt Schulz — LendingTree chief consumer finance analyst and author of “Ask Questions, Save Money, Make More: How to Take Control of Your Financial Life” — says it could boil down to convenience.
“School’s out,” he says. “Moving during the summer means parents don’t have to uproot their kids in the middle of a school year, which can be traumatic. While there may be less inventory in the winter, you may find less competition for available homes. You might also find that sellers are more eager to bargain during those off-peak times, not wanting to alienate buyers.”
Long summer days may also make it easier for buyers to tour homes than amid winter weather and shorter days. Also, summer often coincides with the end of many rental leases, providing a natural transition for renters who are looking to upgrade to homeownership.
May is most expensive month for homebuyers
By month, May was the priciest for homebuyers in 2024, according to our analysis. The median price per square foot in May was $194.20. Comparatively, the median price in January was 8.0% lower at $178.60. February had the second-lowest per-square-foot price, at $183.70.
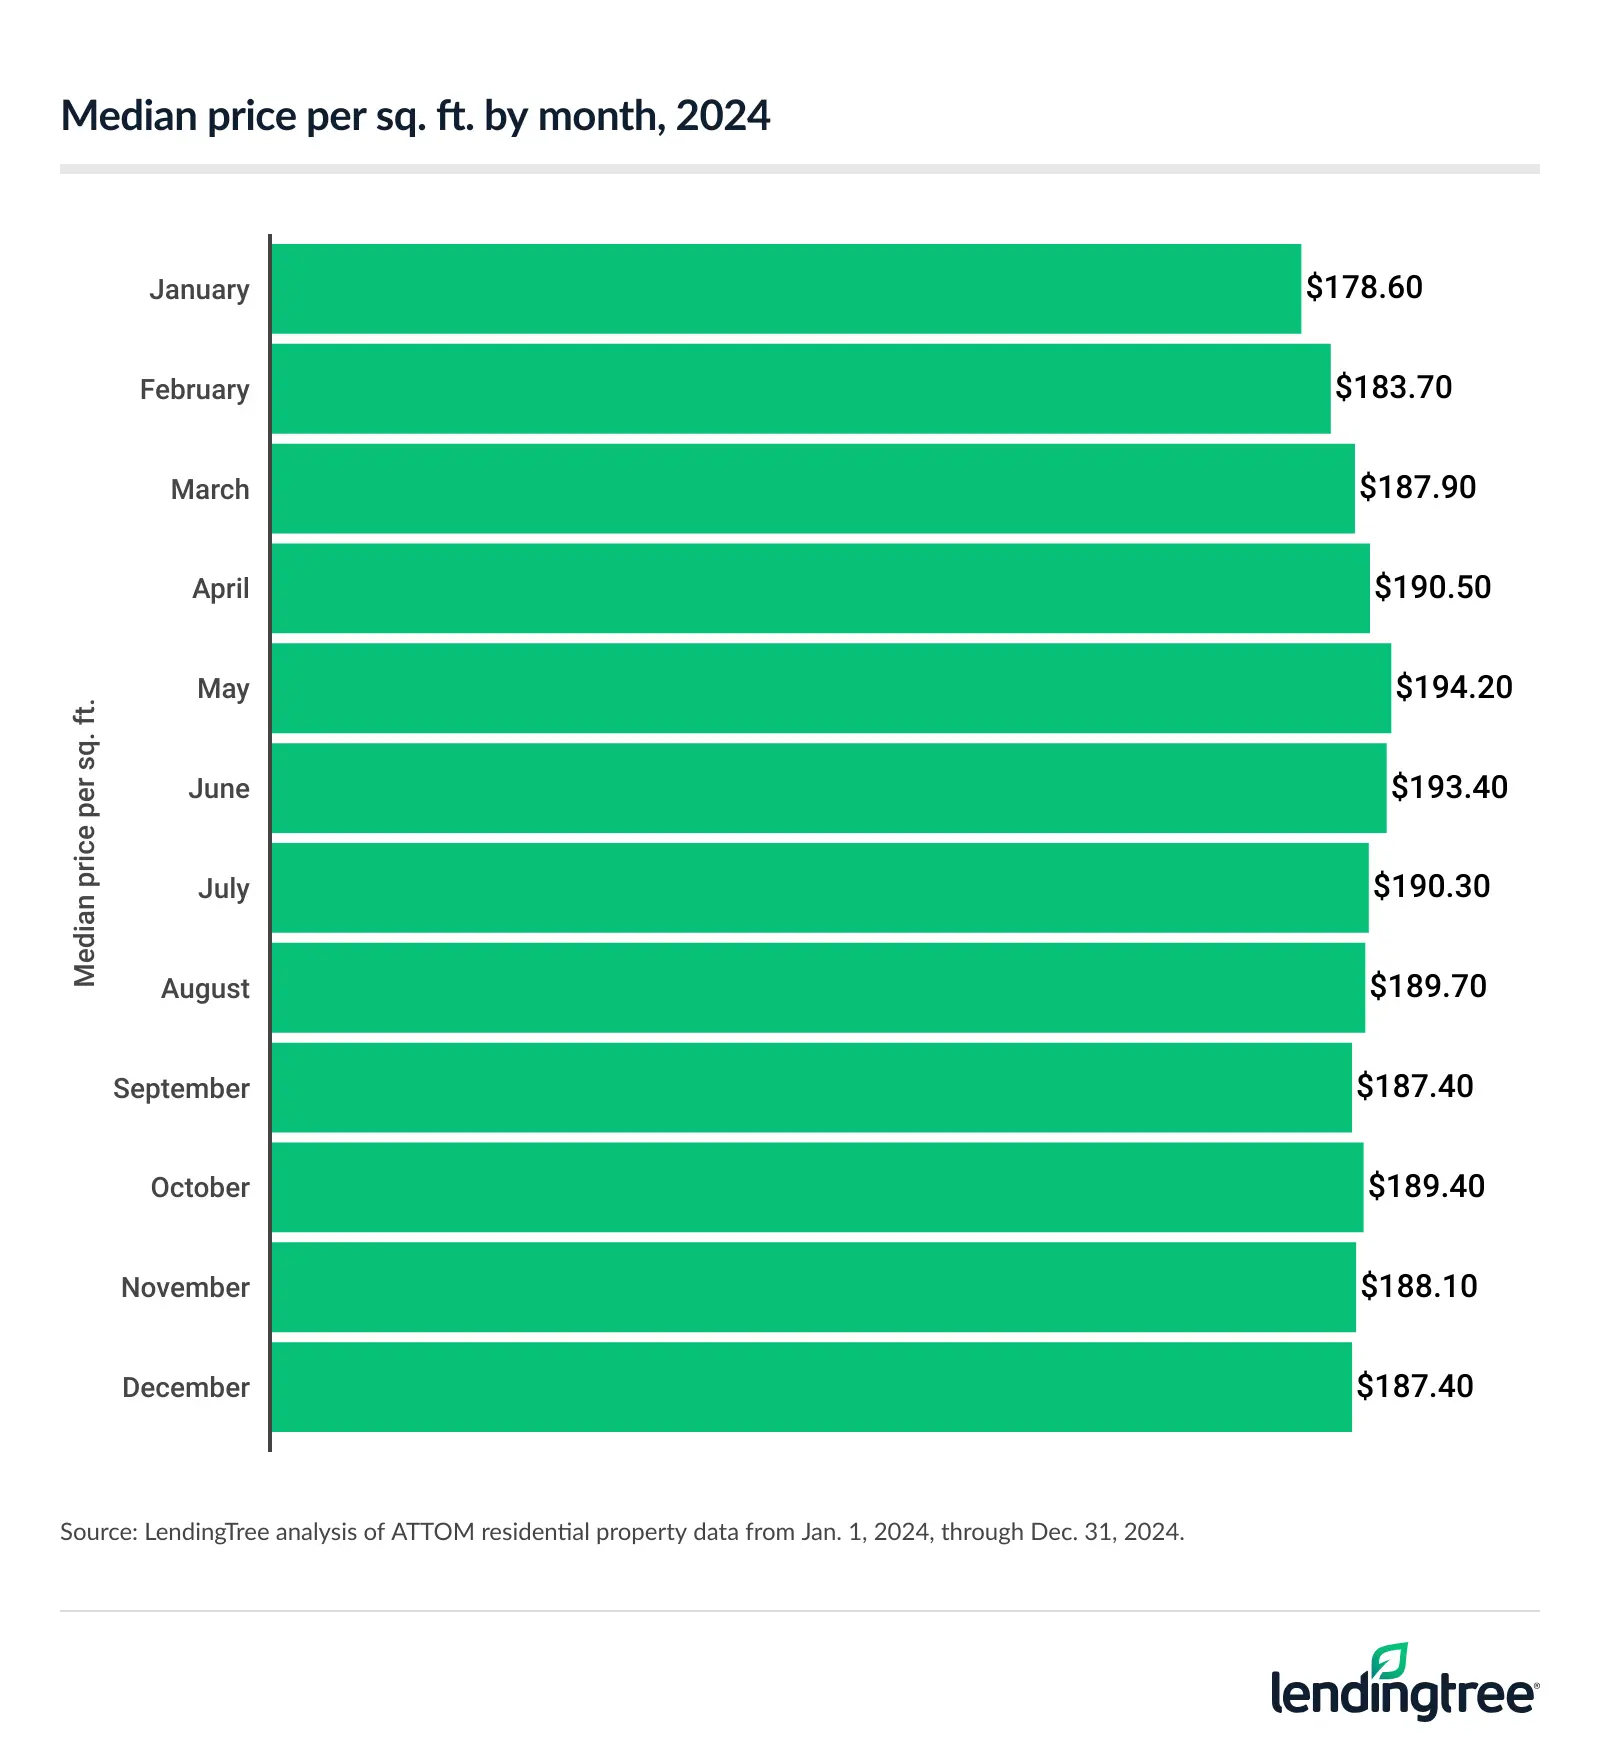
That means buying a 1,500-square-foot home in January instead of May could save you $23,400.
“That’s a significant difference,” Schulz says. “That can shave tens of thousands off the cost of the home, making something affordable that might not have been otherwise. It can also make it a little easier to reach 20% with a down payment, which is huge. If you reach that magic 20% mark, you can avoid paying private mortgage insurance (PMI), which can make a major difference in your monthly payments.”
Hawaii has largest difference in low, high median prices
Based on the observed peaks and valleys, the state-level gap in 2024 between the lowest and highest median prices per square foot ranged from 3.2% to 25.7%. Hawaii had the largest difference at 25.7%. The lowest price per square foot was $490.50 (December), while the highest was $660.20 (March).
Vermont (22.3%) followed, with a low of $128.90 in February and a high of $165.80 in June. Illinois (21.4%) rounded out the top three, with a low of $125.50 in February and a high of $159.60 in August.
Schulz says homebuyers in these states should certainly try to take advantage of that difference.
“It’s crazy expensive to buy a home, so if there’s a strategy that could potentially cut someone’s costs by 25%, they’d be foolish not to at least consider it,” he says. “This is especially true for first-time homebuyers because they’re not burdened with trying to sell their current home for the highest price possible.”
Conversely, the price gap was only 3.2% in Arizona, ranging from a low of $249.90 in August to a high of $258.20 in June. Colorado (6.2%) and Florida and South Carolina (both at 6.9%) ranked next.
Full rankings: States with biggest/smallest differences in median home prices per sq. ft. between least, most expensive months
| Rank | State | Lowest median price per sq. ft. | Highest median price per sq. ft. | Difference (%) |
|---|---|---|---|---|
| 1 | Hawaii | $490.50 | $660.20 | 25.7% |
| 2 | Vermont | $128.90 | $165.80 | 22.3% |
| 3 | Illinois | $125.50 | $159.60 | 21.4% |
| 4 | Delaware | $175.50 | $218.20 | 19.6% |
| 5 | West Virginia | $106.80 | $132.10 | 19.2% |
| 6 | South Dakota | $119.70 | $147.20 | 18.7% |
| 7 | Alabama | $100.90 | $122.40 | 17.6% |
| 8 | Michigan | $84.50 | $102.30 | 17.4% |
| 9 | District of Columbia | $434.00 | $524.60 | 17.3% |
| 10 | Ohio | $104.20 | $125.00 | 16.6% |
| 11 | New Jersey | $246.60 | $295.10 | 16.4% |
| 12 | Arkansas | $118.00 | $140.30 | 15.9% |
| 13 | Maine | $137.40 | $163.00 | 15.7% |
| 14 | Wisconsin | $128.50 | $151.60 | 15.2% |
| 15 | Iowa | $128.20 | $150.50 | 14.8% |
| 16 | Massachusetts | $193.80 | $227.00 | 14.6% |
| 17 | California | $377.40 | $440.10 | 14.2% |
| 18 | New Hampshire | $131.80 | $152.20 | 13.4% |
| 19 | Indiana | $121.40 | $139.70 | 13.1% |
| 20 | Kentucky | $125.50 | $143.90 | 12.8% |
| 21 | Connecticut | $119.50 | $136.00 | 12.1% |
| 22 | Washington | $268.50 | $302.60 | 11.3% |
| 23 | Pennsylvania | $138.20 | $155.50 | 11.1% |
| 23 | Minnesota | $177.80 | $200.00 | 11.1% |
| 25 | Maryland | $238.20 | $266.00 | 10.5% |
| 26 | New York | $469.10 | $523.40 | 10.4% |
| 26 | Rhode Island | $147.10 | $164.10 | 10.4% |
| 28 | Virginia | $187.40 | $208.30 | 10.0% |
| 29 | Tennessee | $147.70 | $163.70 | 9.8% |
| 30 | North Carolina | $167.20 | $183.90 | 9.1% |
| 31 | Nebraska | $103.60 | $113.00 | 8.3% |
| 32 | Georgia | $136.10 | $147.70 | 7.9% |
| 33 | Oregon | $252.40 | $273.60 | 7.7% |
| 34 | Nevada | $203.70 | $220.40 | 7.6% |
| 35 | Oklahoma | $106.30 | $114.80 | 7.4% |
| 36 | South Carolina | $156.70 | $168.40 | 6.9% |
| 36 | Florida | $178.50 | $191.70 | 6.9% |
| 38 | Colorado | $240.60 | $256.40 | 6.2% |
| 39 | Arizona | $249.90 | $258.20 | 3.2% |
Price per square foot peaks in June, bottoms in January
Generally speaking, the median price per square foot varies across home sizes. However, among the available home size ranges, it’s always highest in June and lowest in January.
Homes under 1,500 square feet ranged from $210.40 per square foot at the lowest to $229.20 at the highest — an 8.2% variation. Meanwhile, homes at 3,500 square feet or larger ranged from $150.50 to $167.40 — a 10.1% variation.
It’s not just that prices are lower in January — homes are also on the market longer then, according to our analysis of July 2016 through June 2025 data.
In January, newly listed homes linger on the market for a median of 75 days, the slowest sales pace of the year. (The median number of days on the market is calculated from the list date to the closing, pending or off-market date.) From April to June, this median drops to 48 days.
The number of active listings peaks in summer and bottoms in winter. From July 2016 through June 2025, July had the most listings at nearly 10 million, while February had the fewest at 7.1 million.
When to know the best time to buy: Top expert tips
Timing the market can lead to significant savings, but there are a few things to keep in mind. Schulz recommends the following:
- You can’t always choose the timing of your house hunting, but it’s worth it if you can. “The savings can be significant,” Schulz says. “Just know there’s risk involved. For example, there may not be as many homes available to choose from, or you may not get as much money for your home when you sell.”
- Regardless of when you look for a home, there are a few key steps you should take. “Understand how much house you need and how much you can afford,” he says. “Compare rates from several lenders to ensure you get the best deal. Be flexible, at least to some degree, in where you look for a home. Think through what elements of a home matter the most to you and how much work you’re willing to put in on the home. Doing all these things will help guide you to the right home for you.”
- Perhaps nothing involved is more important in the homebuying process than shopping around for the best mortgage rates. “A fraction of a point difference can mean tens of thousands of dollars in savings over the life of a mortgage,” he says. “If you don’t take the time to comparison shop, there’s a good chance you’ll pay more than you need to.”
Methodology
LendingTree researchers analyzed ATTOM data on about 24 million residential properties from Jan. 1, 2015, to Dec. 31, 2024. The analysis was based on the assessor’s last sale date, the assessor’s last sale amount (the sale price recorded by the local property assessor) and the raw square footage of all structures on the property, aggregated by the month of sale, property size and the state in which the property is located. For each aggregation, the study calculated the median price per square foot and share of sales for each month.
To estimate potential savings from timing a home purchase, we compared the month with the lowest median sales price with the month with the highest median sales price for each state and home size. Nondisclosure states (Alaska, Idaho, Kansas, Louisiana, Mississippi, Missouri, Montana, New Mexico, North Dakota, Texas, Utah and Wyoming) were excluded.
Additionally, researchers used data from the Federal Reserve Economic Data (FRED) database via Realtor.com, spanning July 1, 2016, to July 1, 2025, for the active listing count and median days on market. The active listing count indicates the number of active single-family and condo/townhome listings in the U.S. each month, excluding pending listings. Median days on market represents the median number of days listings are on the market for a given month, calculated from the list date to the closing, pending or off-market date, depending on data availability.
View mortgage loan offers from up to 5 lenders in minutes