The States Where Home Values Have Grown the Most Relative to Incomes Amid the Pandemic


During the height of the coronavirus pandemic, home values increased dramatically. But while incomes also rose, they didn’t do so at the same pace.
To find out how much home values increased relative to incomes, LendingTree analyzed U.S. Census Bureau American Community Survey data, comparing both variables from 2019 through 2021.
While many states saw significant growth in median household incomes, home values grew by more than 10 percentage points, on average, than incomes across the nation’s 50 states.
Key findings
- Home value growth outpaced income growth in the nation’s 50 states. On average, median home values increased by 17.36% from 2019 through 2021, while median household incomes grew by an average of 6.00%. That’s a difference of 11.36 percentage points.
- Idaho, Utah and Arizona are the states where home values increased the most relative to incomes. While incomes increased by more than the national average in Idaho and Arizona, home values increased by 35.73 and 20.14 percentage points more in each state. In Utah, where income growth was less robust than the national average, home values increased by 22.83 percentage points more than the state’s median household income.
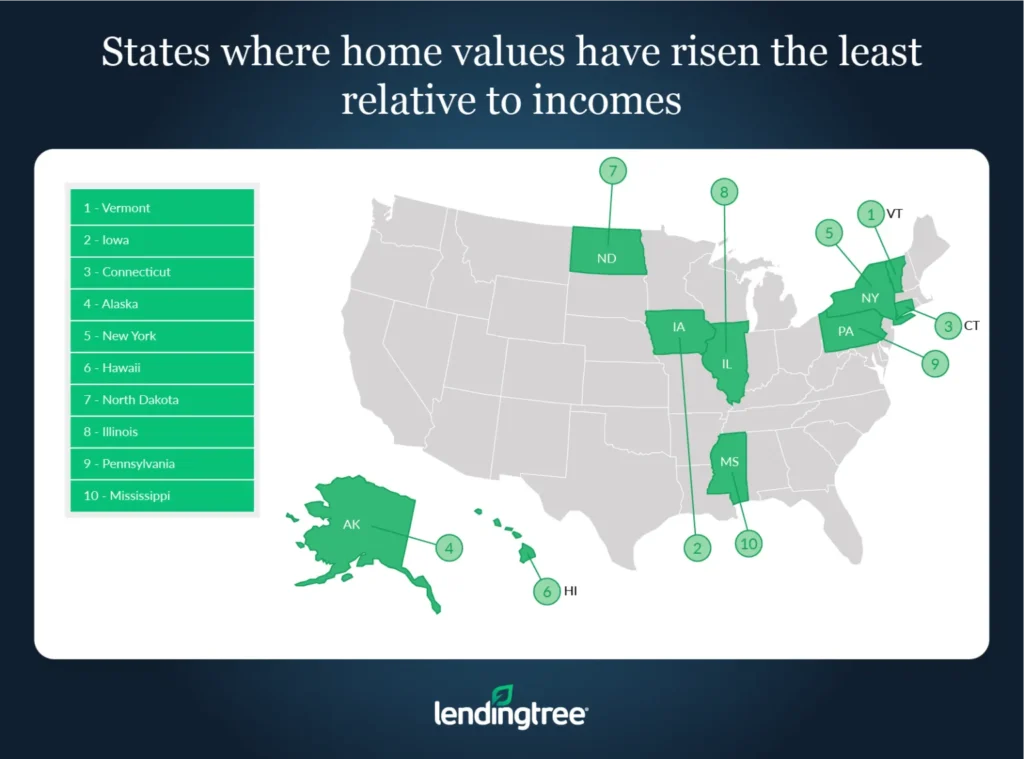
- Home prices increased the least relative to incomes in Vermont, Iowa and Connecticut. In Iowa and Connecticut, median household incomes increased by 6.34% and 6.26% from 2019 through 2021, while home values increased by 9.75% and 10.97% — differences of 3.42 and 4.71 percentage points. In Vermont, where both incomes and median home values increased by double digits (14.97% and 16.42%, respectively), the median home value increased by 1.46 percentage points more than the median household income.
States where home values have risen the most relative to incomes
No. 1: Idaho
- Percentage growth in median household income from 2019 through 2021: 8.98%
- Percentage growth in median home value from 2019 through 2021: 44.71%
- Percentage point difference between home value and income growth: 35.73
No. 2: Utah
- Percentage growth in median household income from 2019 through 2021: 4.84%
- Percentage growth in median home value from 2019 through 2021: 27.67%
- Percentage point difference between home value and income growth: 22.83
No. 3: Arizona
- Percentage growth in median household income from 2019 through 2021: 11.28%
- Percentage growth in median home value from 2019 through 2021: 31.42%
- Percentage point difference between home value and income growth: 20.14

States where home values have risen the least relative to incomes
No. 1: Vermont
- Percentage growth in median household income from 2019 through 2021: 14.97%
- Percentage growth in median home value from 2019 through 2021: 16.42%
- Percentage point difference between home value and income growth: 1.46
No. 2: Iowa
- Percentage growth in median household income from 2019 through 2021: 6.34%
- Percentage growth in median home value from 2019 through 2021: 9.75%
- Percentage point difference between home value and income growth: 3.42
No. 3: Connecticut
- Percentage growth in median household income from 2019 through 2021: 6.26%
- Percentage growth in median home value from 2019 through 2021: 10.97%
- Percentage point difference between home value and income growth: 4.71
Home unaffordability will likely persist, even as prices fall
Though home prices are starting to come down in many parts of the country, that doesn’t mean housing will become more affordable for the majority of buyers who use a mortgage to purchase a house.
This is because mortgage rates have increased significantly since the start of 2022. As a result, homes purchased at today’s rates can have higher monthly payments than homes purchased at the start of the year, even if borrowers take out smaller loans on those newly purchased homes.
For example, a $450,000 30-year, fixed-rate mortgage at the average rate for the week ending Jan. 6, 2022 — 3.22% — would cost $1,951 a month (excluding taxes and insurance fees). That’s less than the $1,986 each month that a $300,000 30-year fixed mortgage would cost at the average rate of 6.95% for the week ending Nov. 3, 2022.
While home prices are a significant factor in calculating a mortgage payment, mortgage rates are just as important. Unfortunately, it also highlights how home affordability is unlikely to improve until rates begin to fall.
Tips for making housing more affordable
Even though housing is often expensive, that doesn’t mean there aren’t ways to make it more affordable. Here are three tips:
- Shop around for a mortgage before you buy. Different lenders can offer different rates to the same borrower. As a result, you can potentially get a lower rate on your mortgage by shopping around and comparing mortgage lenders. The lower the rate you get, the lower your monthly payment will likely be and the less interest you’ll have to pay over your loan’s lifetime.
- Boost your credit score. The higher your credit score, the lower the rate you’ll likely be offered on a mortgage. Because of this, you should be sure that you’ve done everything in your power to increase your score if you’re thinking about buying, like paying down other debts or disputing errors on your current report.
- Consider modifying your current place with a home equity loan instead of buying a new house. Depending on factors like what rate you have on your existing mortgage, what kind of renovations you feel your home needs and how much they’ll cost, borrowing money through a home equity loan and paying it off in addition to your current mortgage could be cheaper than a mortgage on a new home. For example, if you have a $300,000 mortgage at a 3.22% rate, you’d owe $1,301 a month on your loan (excluding taxes and other fees). If you took out a $25,000 home equity loan with a 10-year term and a rate of 8%, it would cost $303 a month, meaning that you’d spend a little more than $1,600 each month on both your mortgage and home equity loan. For comparison, that’s nearly $400 less than what a $300,000 mortgage would cost at today’s average rate of 6.95%.
Methodology
LendingTree researchers analyzed the U.S. Census Bureau 2021 American Community Survey with one-year estimates — the latest available — and the 2019 American Community Survey with one-year estimates.
View mortgage loan offers from up to 5 lenders in minutes