These Towns Have Home Values That Rival America’s Most Expensive Metros


Towns have a reputation for being quieter, slower and, perhaps most importantly, more affordable than cities. But when it comes to buying a home, that perception doesn’t always hold true.
A LendingTree analysis found that some U.S. towns have some of the country’s highest housing values. In Nantucket, Mass., for example, the median home value is nearly $1.6 million — higher than in San Jose, Calif., the nation’s most expensive major metro.
While some of these towns command eye-popping prices, others are relatively affordable. We examined not only where home values are highest, but also how those prices stack up against local incomes to identify where buying a home is most and least attainable.
“Small” is a relative term. Our report examined U.S. Census Bureau-defined micropolitan statistical areas. These areas have populations of 10,000 to 49,999. For this report, we refer to these areas as “towns.”
By comparison, metropolitan statistical areas have populations of at least 50,000. Throughout this report, we refer to these areas as “metros.”
- Nantucket, Mass., Vineyard Haven, Mass., and Jackson, Wyo., remain the nation’s most expensive towns. Ranked as the three most expensive towns in last year’s report as well, they have median home values of $1,593,800, $1,165,800 and $1,075,500, respectively. Their home values rival those in some of the nation’s largest metros, with Nantucket surpassing San Jose ($1,447,800) and Vineyard Haven and Jackson close to San Francisco ($1,140,700).
- Not every town on our list has exceptionally high home values. Winnemucca, Nev., Gillette, Wyo., and Brattleboro, Vt., have the lowest median home values among the towns analyzed, at $278,300, $279,100 and $279,600, respectively.
- Despite relatively high household incomes, residents of Nantucket, Vineyard Haven and Jackson face the greatest affordability challenges. These towns have median home value-to-income ratios of 11.4, 9.3 and 9.1, respectively, far exceeding their median household incomes of $139,688, $125,786 and $118,796, respectively.
- Relative to local incomes, Gillette, Wyo., and Williston, N.D., offer some of the most affordable housing opportunities among the towns analyzed. With median home values of $279,100 and $284,800, respectively, they rank among the most financially accessible.
3 towns stand head and shoulders above the rest when it comes to home values
Living in a town doesn’t necessarily mean paying less to buy a home. In some cases, home values in towns can be outrageously high, even as pricey as any city in the U.S.
Our analysis found that Nantucket, Mass., Vineyard Haven, Mass., and Jackson, Wyo., have the highest median home values among U.S. towns. Median home values in those communities are $1,593,800, $1,165,800 and $1,075,500, respectively.
Those prices are high by any standard. Nantucket’s median home value exceeds that of San Jose, Calif. ($1,447,800), the nation’s most expensive major metro. Vineyard Haven’s median home value is higher than that of San Francisco ($1,140,700), the second priciest metro, while Jackson’s is only slightly lower.
Among the 10 priciest towns, Nantucket and Vineyard Haven are the only two east of the Mississippi River. Expanding the list to the 50 most expensive towns, Colorado and Wyoming account for 11 entries — six in Wyoming and five in Colorado.
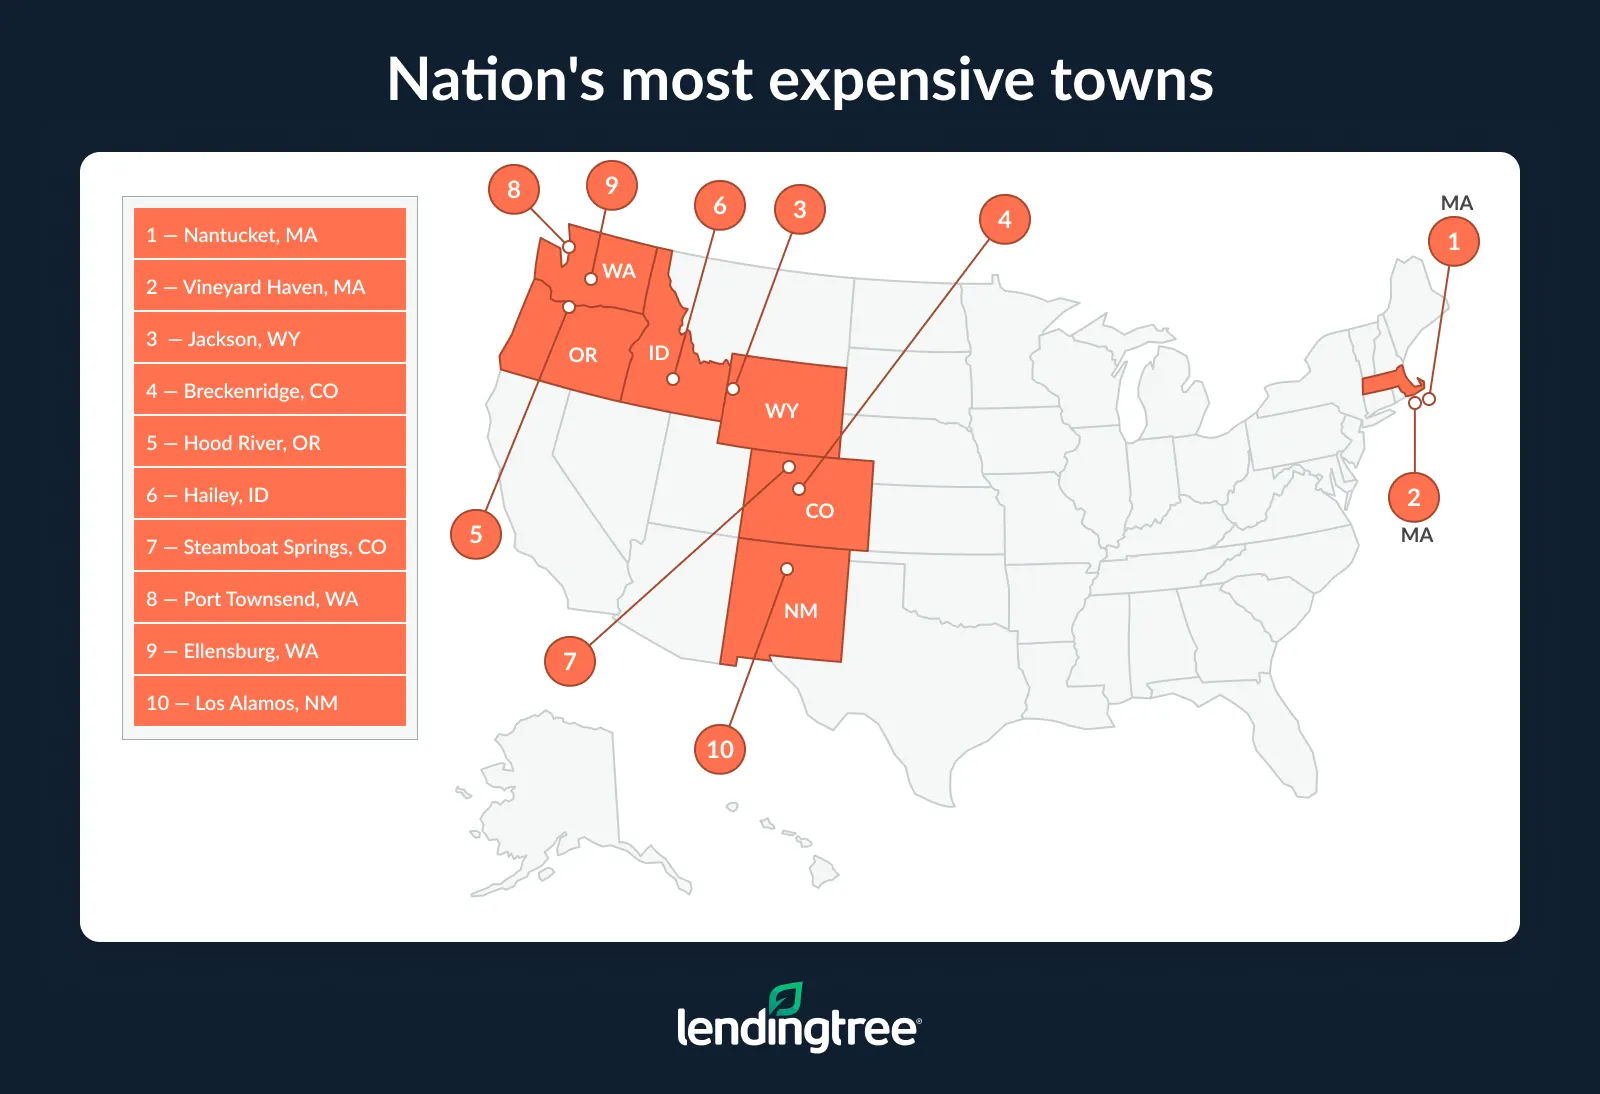
Several factors likely contribute to the high home values in Nantucket and Vineyard Haven, including wealthy second-home buyers, limited housing supply and strong seasonal tourism. Census Bureau data shows that 55.0% of housing units in Nantucket and 54.4% in Vineyard Haven are used for seasonal, recreational or occasional purposes — the highest shares among all U.S. towns and metros. Among the nation’s 10 most expensive towns, only Breckenridge, Colo., comes close, at 45.8%.
America’s 10 most expensive towns for homes: Seasonal housing and vacancy rates
| Rank | Town | Median home value | Vacancy rate (%) | % that are seasonal, recreational or occasional |
|---|---|---|---|---|
| 1 | Nantucket, MA | $1,593,800 | 58.3% | 55.0% |
| 2 | Vineyard Haven, MA | $1,165,800 | 57.4% | 54.4% |
| 3 | Jackson, WY | $1,075,500 | 28.0% | 22.4% |
| 4 | Breckenridge, CO | $748,200 | 57.0% | 45.8% |
| 5 | Hood River, OR | $660,000 | 13.1% | 4.1% |
| 6 | Hailey, ID | $607,600 | 32.4% | 26.8% |
| 7 | Steamboat Springs, CO | $564,500 | 28.5% | 19.5% |
| 8 | Port Townsend, WA | $535,000 | 16.4% | 9.5% |
| 9 | Ellensburg, WA | $497,400 | 19.0% | 13.3% |
| 10 | Los Alamos, NM | $495,800 | 5.3% | 2.0% |
While some towns have exceptionally high home values, many remain relatively affordable
The seven-figure home values in Nantucket, Vineyard Haven and Jackson are outliers among the towns we analyzed. While those three each topped $1 million in median home value, about two-thirds of the towns in our analysis have median home values below $400,000. In 14 towns, the median home value is less than $300,000.
Winnemucca, Nev., Gillette, Wyo., and Brattleboro, Vt., have the lowest median home values among the towns we analyzed, at $278,300, $279,100 and $279,600, respectively. Lewisburg, Tenn. ($279,800), and Bennington, Vt. ($279,900), aren’t much higher. Combined, the median home values in those five towns total $1.397 million — still less than the median home value in Nantucket alone.
Home values in these towns are comparable to those in San Antonio, where the median home value is $278,800. The Texas city has long been considered one of the most affordable major cities.
Despite relatively high incomes, residents of the most expensive towns still face the greatest affordability challenges
To measure home affordability, we compared median home values with median household incomes to calculate a home value-to-income ratio for each town and metro. Higher ratios indicate lower affordability.
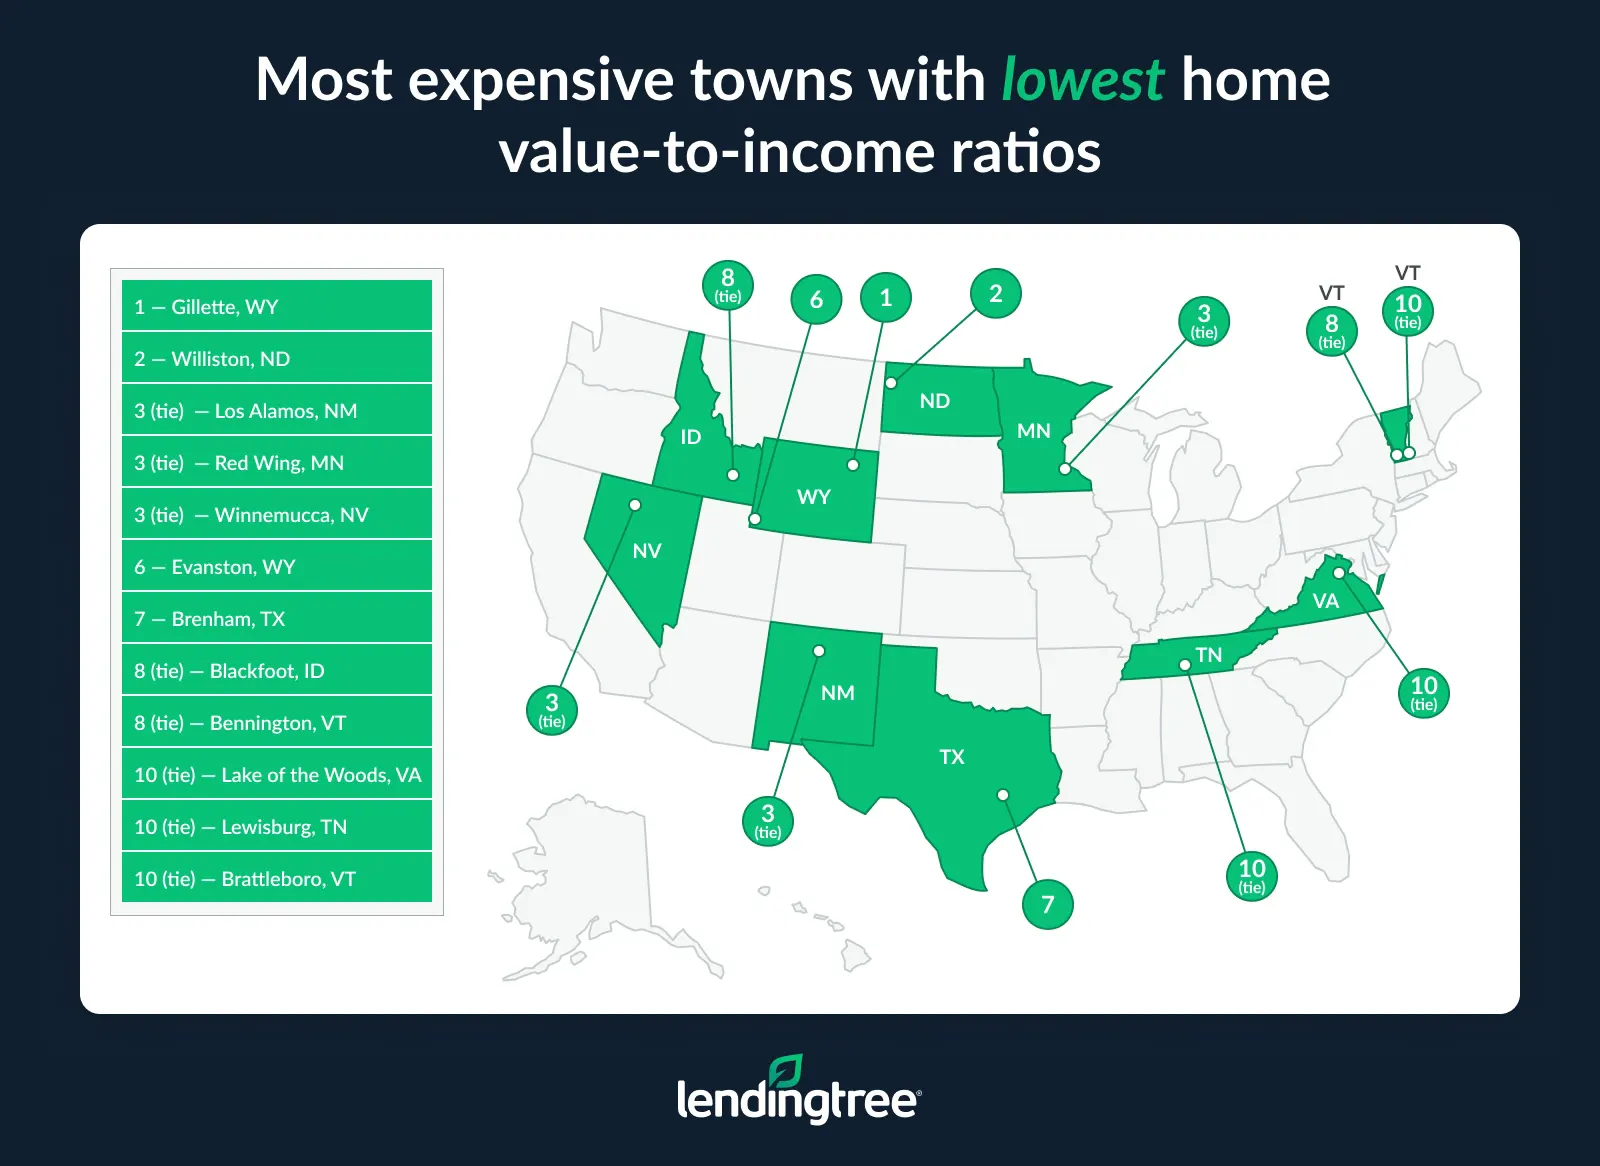
Our analysis found that the most expensive towns are also the least affordable. Nantucket, Vineyard Haven and Jackson have median home value-to-income ratios of 11.4, 9.3 and 9.1, respectively. That means median home values are more than nine times median household incomes in each community. Median household incomes are $139,688, $125,786 and $118,796, respectively.
Those ratios are sky-high, exceeding those in San Jose and San Francisco, the nation’s most expensive major metros, at 8.9 and 8.4, respectively.
How can that be? The simplest explanation might be that the buyers of these high-value homes aren’t year-round residents. Vacation-home buyers and real estate investors can increase local home values, but because they aren’t counted as residents, their incomes aren’t reflected in local median household income figures. That can widen the gap between home values and resident incomes.
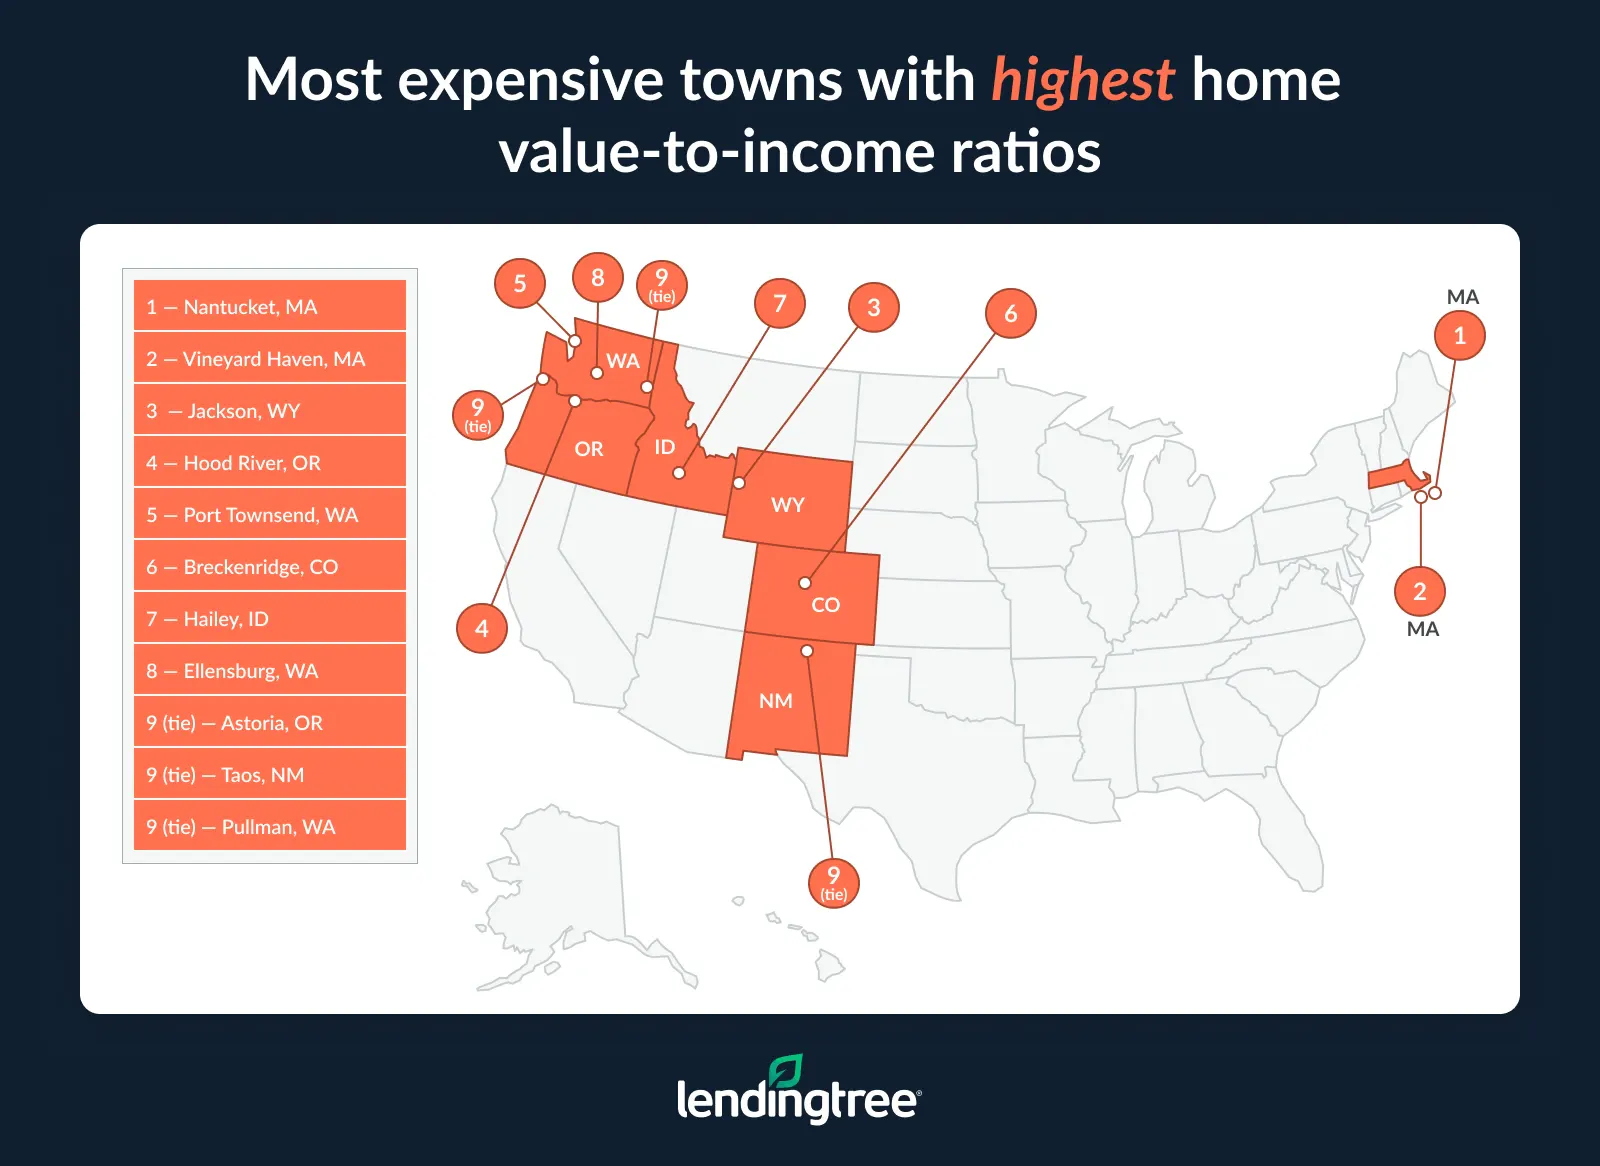
Relative to incomes, Gillette, Wyo., and Williston, N.D., offer the most affordable homebuying opportunities among the towns analyzed
While the least affordable towns are largely in New England and the West, the most affordable towns on our list are geographically diverse. They range from Vermont to Nevada and from Minnesota to Texas.
Gillette (3.1) and Williston, N.D. (3.3), rank as the most affordable in our analysis, both with home value-to-income ratios less than one-third of Nantucket’s. Los Alamos, N.M., Red Wing, Minn., and Winnemucca follow closely, each with a ratio of 3.4.
In four of these five towns — all except Los Alamos — median home values are $285,100 or less, while median household incomes range from $80,000 to $90,000 a year. Those four towns rank in the top half of the 50 towns analyzed for median household income, while their median home values rank among the 10 lowest. That combination makes homeownership comparatively attainable.
Los Alamos stands apart. It has the highest median household income of any town in our analysis ($147,139), but it also has the 10th-highest median home value ($495,800). The town is home to Los Alamos National Laboratory, a major scientific research institution whose concentration of highly paid scientists, engineers and other professionals likely contributes to both elevated incomes and higher home values.
Nation’s most expensive towns
| Rank | Town | Population | Median home value | Median household income | Median value-to-income ratio | Metro with comparable median home value | Median value (comparable metro) | Median income (comparable metro) | Median value-to-income ratio (comparable metro) |
|---|---|---|---|---|---|---|---|---|---|
| 1 | Nantucket, MA | 14,483 | $1,593,800 | $139,688 | 11.4 | San Jose, CA | $1,447,800 | $162,111 | 8.9 |
| 2 | Vineyard Haven, MA | 20,933 | $1,165,800 | $125,786 | 9.3 | San Francisco, CA | $1,140,700 | $136,027 | 8.4 |
| 3 | Jackson, WY | 35,821 | $1,075,500 | $118,796 | 9.1 | San Francisco, CA | $1,140,700 | $136,027 | 8.4 |
| 4 | Breckenridge, CO | 38,397 | $748,200 | $105,544 | 7.1 | Seattle, WA | $717,500 | $115,177 | 6.2 |
| 5 | Hood River, OR | 23,905 | $660,000 | $88,947 | 7.4 | Boston, MA | $646,300 | $115,863 | 5.6 |
| 6 | Hailey, ID | 31,433 | $607,600 | $88,522 | 6.9 | Denver, CO | $603,800 | $105,762 | 5.7 |
| 7 | Steamboat Springs, CO | 38,291 | $564,500 | $95,400 | 5.9 | Portland, OR | $559,400 | $97,436 | 5.7 |
| 8 | Port Townsend, WA | 33,577 | $535,000 | $74,048 | 7.2 | Riverside, CA | $536,300 | $89,662 | 6.0 |
| 9 | Ellensburg, WA | 47,172 | $497,400 | $73,804 | 6.7 | Salt Lake City, UT | $515,400 | $98,083 | 5.3 |
| 10 | Los Alamos, NM | 19,435 | $495,800 | $147,139 | 3.4 | Salt Lake City, UT | $515,400 | $98,083 | 5.3 |
| 11 | Astoria, OR | 41,363 | $468,300 | $71,822 | 6.5 | Austin, TX | $465,000 | $100,431 | 4.6 |
| 12 | Fredericksburg, TX | 27,524 | $460,700 | $76,162 | 6.0 | Austin, TX | $465,000 | $100,431 | 4.6 |
| 13 | Kill Devil Hills, NC | 37,875 | $460,400 | $88,994 | 5.2 | Austin, TX | $465,000 | $100,431 | 4.6 |
| 14 | Juneau, AK | 31,794 | $449,300 | $101,661 | 4.4 | Miami, FL | $443,300 | $76,527 | 5.8 |
| 15 | Easton, MD | 37,917 | $409,700 | $84,811 | 4.8 | Nashville, TN | $409,600 | $85,447 | 4.8 |
| 16 | Cody, WY | 30,449 | $400,500 | $73,035 | 5.5 | Nashville, TN | $409,600 | $85,447 | 4.8 |
| 17 | Sheridan, WY | 32,055 | $394,900 | $71,388 | 5.5 | Baltimore, MD | $391,300 | $99,470 | 3.9 |
| 18 | Ketchikan, AK | 13,768 | $393,300 | $92,885 | 4.2 | Baltimore, MD | $391,300 | $99,470 | 3.9 |
| 19 | Montrose, CO | 43,807 | $388,400 | $72,120 | 5.4 | Fresno, CA | $389,400 | $74,468 | 5.2 |
| 20 | Taos, NM | 34,543 | $382,800 | $58,950 | 6.5 | Fresno, CA | $389,400 | $74,468 | 5.2 |
| 21 | Brookings, OR | 23,381 | $381,300 | $62,244 | 6.1 | Minneapolis, MN | $374,000 | $99,833 | 3.7 |
| 22 | Brevard, NC | 33,691 | $373,600 | $66,184 | 5.6 | Minneapolis, MN | $374,000 | $99,833 | 3.7 |
| 23 | Moscow, ID | 41,049 | $368,600 | $65,424 | 5.6 | Atlanta, GA | $367,600 | $89,724 | 4.1 |
| 24 | The Dalles, OR | 26,552 | $367,400 | $64,175 | 5.7 | Atlanta, GA | $367,600 | $89,724 | 4.1 |
| 25 | Lake of the Woods, VA | 37,822 | $364,200 | $94,008 | 3.9 | Atlanta, GA | $367,600 | $89,724 | 4.1 |
| 26 | Pullman, WA | 47,003 | $359,600 | $55,406 | 6.5 | Dallas, TX | $359,500 | $90,275 | 4.0 |
| 27 | Bishop, CA | 18,739 | $348,700 | $73,991 | 4.7 | Philadelphia, PA | $351,900 | $91,289 | 3.9 |
| 28 | Spearfish, SD | 27,233 | $346,500 | $73,384 | 4.7 | Tampa, FL | $345,100 | $74,392 | 4.6 |
| 29 | Crescent City, CA | 27,107 | $342,000 | $67,058 | 5.1 | Virginia Beach, VA | $340,900 | $82,330 | 4.1 |
| 30 | Fort Morgan, CO | 29,520 | $338,600 | $73,278 | 4.6 | Virginia Beach, VA | $340,900 | $82,330 | 4.1 |
| 31 | Laramie, WY | 38,249 | $333,000 | $61,917 | 5.4 | Virginia Beach, VA | $340,900 | $82,330 | 4.1 |
| 32 | Fallon, NV | 25,805 | $329,900 | $79,163 | 4.2 | Chicago, IL | $323,000 | $90,887 | 3.6 |
| 33 | Cañon City, CO | 49,634 | $324,000 | $62,664 | 5.2 | Chicago, IL | $323,000 | $90,887 | 3.6 |
| 34 | Alexandria, MN | 39,575 | $321,400 | $79,043 | 4.1 | Chicago, IL | $323,000 | $90,887 | 3.6 |
| 35 | Mountain Home, ID | 29,321 | $316,500 | $65,359 | 4.8 | Chicago, IL | $323,000 | $90,887 | 3.6 |
| 36 | Petoskey, MI | 34,125 | $315,700 | $78,112 | 4.0 | Chicago, IL | $323,000 | $90,887 | 3.6 |
| 37 | Vernal, UT | 37,056 | $298,600 | $73,746 | 4.0 | Houston, TX | $298,000 | $82,168 | 3.6 |
| 38 | La Grande, OR | 26,144 | $294,600 | $65,661 | 4.5 | Houston, TX | $298,000 | $82,168 | 3.6 |
| 39 | Evanston, WY | 23,275 | $293,800 | $82,471 | 3.6 | Houston, TX | $298,000 | $82,168 | 3.6 |
| 40 | Blackfoot, ID | 49,664 | $293,300 | $77,878 | 3.8 | Houston, TX | $298,000 | $82,168 | 3.6 |
| 41 | Detroit Lakes, MN | 35,343 | $291,000 | $71,388 | 4.1 | Kansas City, MO | $287,300 | $83,460 | 3.4 |
| 42 | Brenham, TX | 36,647 | $288,100 | $77,825 | 3.7 | Kansas City, MO | $287,300 | $83,460 | 3.4 |
| 43 | Baker City, OR | 16,840 | $285,600 | $60,936 | 4.7 | Grand Rapids, MI | $285,300 | $82,874 | 3.4 |
| 44 | Red Wing, MN | 47,943 | $285,100 | $84,171 | 3.4 | Grand Rapids, MI | $285,300 | $82,874 | 3.4 |
| 45 | Williston, ND | 39,555 | $284,800 | $85,595 | 3.3 | Grand Rapids, MI | $285,300 | $82,874 | 3.4 |
| 46 | Bennington, VT | 37,269 | $279,900 | $73,325 | 3.8 | San Antonio, TX | $278,800 | $76,213 | 3.7 |
| 47 | Lewisburg, TN | 36,049 | $279,800 | $71,049 | 3.9 | San Antonio, TX | $278,800 | $76,213 | 3.7 |
| 48 | Brattleboro, VT | 45,923 | $279,600 | $72,217 | 3.9 | San Antonio, TX | $278,800 | $76,213 | 3.7 |
| 49 | Gillette, WY | 47,240 | $279,100 | $89,869 | 3.1 | San Antonio, TX | $278,800 | $76,213 | 3.7 |
| 50 | Winnemucca, NV | 17,289 | $278,300 | $81,073 | 3.4 | San Antonio, TX | $278,800 | $76,213 | 3.7 |
Buying a home? Focus on affordability, not just price
This analysis shows that a home’s sticker price tells only part of the story. Some towns have home values that rival those in the nation’s largest cities, while others remain surprisingly affordable.
Whether you’re buying in a town, a suburb or a major metro, these strategies can help improve affordability:
- Compare mortgage offers from multiple lenders. Interest rates and closing costs can vary significantly by lender. Even a slightly lower interest rate could save you thousands of dollars over the life of a loan, making comparison shopping well worth your time.
- Look beyond the listing price. Monthly housing costs include much more than a mortgage payment. Property taxes, homeowners insurance, homeowners association (HOA) fees, utilities and maintenance can all add up, so factor those expenses into your budget before making an offer.
- Expand your search if you’re priced out of your preferred market. Nearby communities may offer similar amenities, schools or commuting options at lower prices. As this analysis shows, home values can vary widely even among places of similar size.
- Understand what’s driving prices in the local market. In some towns, especially vacation destinations, limited housing supply, seasonal demand and second-home buyers can keep prices elevated. Understanding those factors can help you decide whether to wait, broaden your search or adjust your budget.
- Choose a home that leaves room in your budget. Qualifying for the largest possible mortgage doesn’t necessarily mean it’s the right financial choice. Leaving room in your budget can make it easier to absorb unexpected expenses, build savings and manage home maintenance over time.
Methodology
LendingTree researchers analyzed the U.S. Census Bureau’s 2024 American Community Survey (ACS) five-year estimates. Analysts used micropolitan-level data for areas with populations ranging from 10,000 to 49,999 to approximate town-level data.
Median home values, median household incomes and population estimates were obtained for each qualifying micropolitan area. Researchers identified the 50 micropolitan areas with the highest median home values and calculated the home value-to-income ratio for each by dividing its median home value by its median household income. The larger the ratio, the more expensive homes are relative to that area’s median household income.
To provide additional context, each micropolitan area was compared with the most similar metro among the nation’s 50 most populous metropolitan statistical areas based on median home value.
Researchers also analyzed vacancy rates and the share of housing units classified as “for seasonal, recreational or occasional use” in the nation’s most expensive micropolitan areas.
View mortgage loan offers from up to 5 lenders in minutes