Over 18 Million Homeowners Across US Are ‘House Poor’
It’s no secret that owning a home can be expensive. While some homeowners can comfortably manage their housing costs, others aren’t so lucky and are housing cost-burdened, or “house poor.”
What house poor looks like will vary by homeowner. But, generally speaking, those who spend more than 30% of their monthly income on housing costs (including their mortgage and other expenses like insurance and utilities) are housing cost-burdened.
LendingTree analyzed U.S. Census Bureau American Community Survey data to determine the share of owner-occupied households in each state that are housing cost-burdened — which we use interchangeably with house poor in this study. In doing so, we found millions of homeowners across the country are house poor.
Key findings
- 21.93%, or 18,381,169, of owner-occupied households in the U.S. are house poor. Of those that are house poor, 44.20% are severely housing cost-burdened, meaning they spend more than 50% of their monthly incomes on housing costs.
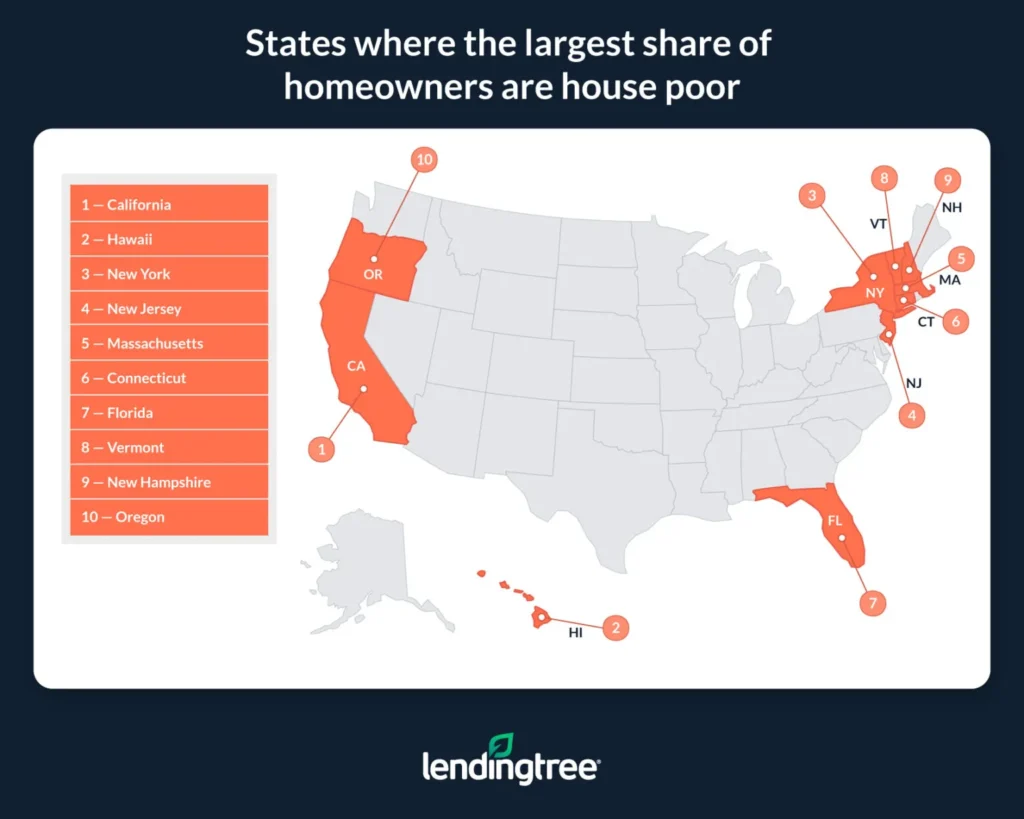
- California, Hawaii and New York have the largest share of house-poor homeowners. In these three states, 29.92%, 28.70% and 27.12% of owner-occupied households, respectively, are housing cost-burdened.
- Digging deeper, over 1.6 million owner-occupied households across California, Hawaii and New York are severely housing cost-burdened. All together, 47.12% of house-poor homeowners across these states are severely housing cost-burdened.
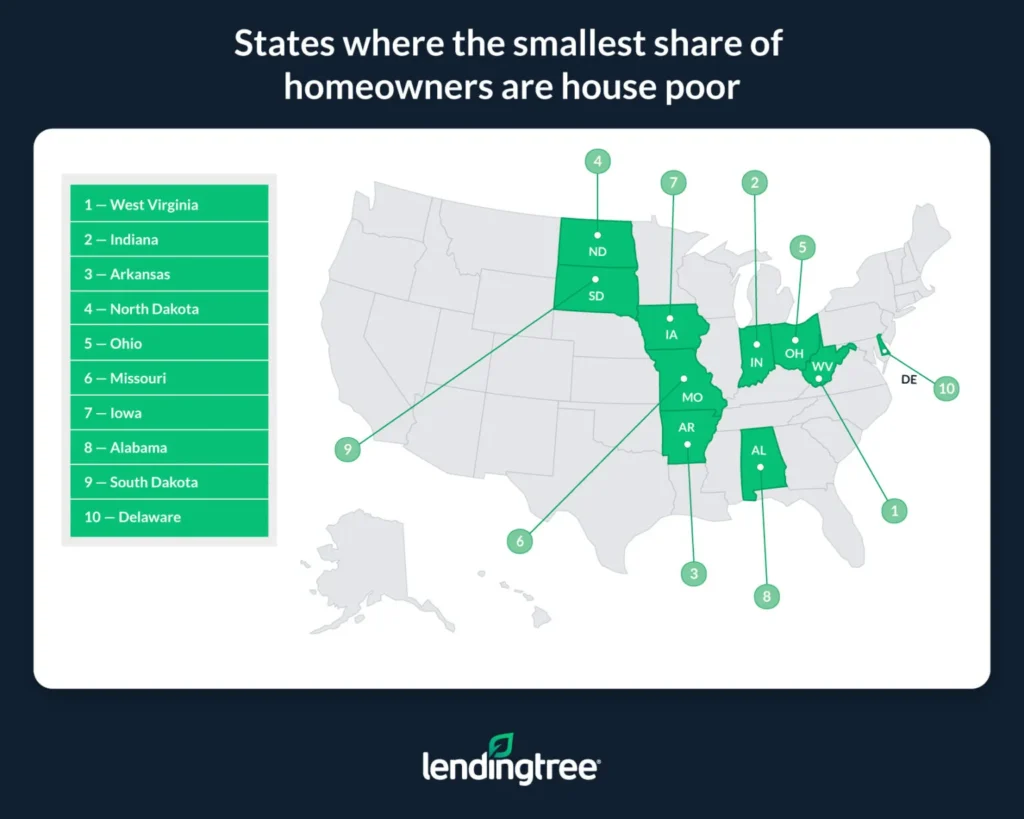
- Homeowners are least likely to be house poor in West Virginia, Indiana and Arkansas. Respectively, 13.54%, 16.38% and 16.53% of owner-occupied households in these three states are housing cost-burdened. While these figures are relatively low compared to other states, nearly 520,000 homeowners across the three are house poor. Further, cost-burdened homeowners in West Virginia and Arkansas are more likely to be severely cost-burdened than house-poor homeowners in most other states.
States where the largest share of homeowners are house poor
No. 1: California
- Total number of owner-occupied households for whom cost-burdened status is known: 7,496,004
- Number of owner-occupied households that are house poor: 2,242,907
- Number of house-poor households that are severely housing cost-burdened: 1,041,113
- Share of owner-occupied households that are house poor: 29.92%
- Share of house-poor households that are severely housing cost-burdened: 46.42%
No. 2: Hawaii
- Total number of owner-occupied households for whom cost-burdened status is known: 306,212
- Number of owner-occupied households that are house poor: 87,898
- Number of house-poor households that are severely housing cost-burdened: 38,809
- Share of owner-occupied households that are house poor: 28.70%
- Share of house-poor households that are severely housing cost-burdened: 44.15%
No. 3: New York
- Total number of owner-occupied households for whom cost-burdened status is known: 4,166,296
- Number of owner-occupied households that are house poor: 1,129,716
- Number of house-poor households that are severely housing cost-burdened: 550,648
- Share of owner-occupied households that are house poor: 27.12%
- Share of house-poor households that are severely housing cost-burdened: 48.74%
States where the smallest share of homeowners are house poor
No. 1: West Virginia
- Total number of owner-occupied households for whom cost-burdened status is known: 541,951
- Number of owner-occupied households that are house poor: 73,383
- Number of house-poor households that are severely housing cost-burdened: 35,956
- Share of owner-occupied households that are house poor: 13.54%
- Share of house-poor households that are severely housing cost-burdened: 49.00%
No. 2: Indiana
- Total number of owner-occupied households for whom cost-burdened status is known: 1,919,261
- Number of owner-occupied households that are house poor: 314,411
- Number of house-poor households that are severely housing cost-burdened: 132,626
- Share of owner-occupied households that are house poor: 16.38%
- Share of house-poor households that are severely housing cost-burdened: 42.18%
No. 3: Arkansas
- Total number of owner-occupied households for whom cost-burdened status is known: 798,877
- Number of owner-occupied households that are house poor: 132,060
- Number of house-poor households that are severely housing cost-burdened: 60,461
- Share of owner-occupied households that are house poor: 16.53%
- Share of house-poor households that are severely housing cost-burdened: 45.78%
There’s often wiggle room with how much you should spend on housing costs
Generally speaking, households that spend more than 30% of their monthly income on housing costs are housing cost-burdened. This is because households that spend more than this can have less money than they need to keep up with other important bills, like food costs and car or credit card payments.
That said, spending more than 30% of your income on housing costs isn’t necessarily the end of the world. Some people can be financially secure while spending more money on housing than what’s generally recommended.
For example, households with little to no debt might be able to successfully allocate more of their money toward housing, as they have fewer bills. In some instances, it may even be advisable for a person to spend more than 30% of their income on housing costs if doing so is the only way they’ll be able to find a safe and secure place to live.
All of this isn’t to say that homebuyers should go wild and spend tons of money on housing just because they technically can without falling behind on their bills. Instead, it’s meant to show that not every household needs to have the same budget.
Tips for staying on top of your housing costs
There’s no getting around how expensive a home can be in today’s housing market, but the following tips can help homeowners keep up with costs:
- Shop around before you buy. You have options to lower your housing costs after you’ve bought your home. But one of the best ways to make sure you won’t be housing cost-burdened is to try to get offered a low mortgage rate — and, by extension, payment — before you buy. To do this, you’ll not only want to have a strong credit score and a low debt-to-income ratio, but you’ll also want to shop around for a mortgage lender. Different lenders can offer different rates and payments to the exact same borrowers. As a result, shopping around before you buy could help you snag a lower rate and potentially save tens of thousands of dollars over the lifetime of your loan.
- Work on getting rid of your mortgage insurance. If you made a less-than-20% down payment toward your home purchase, odds are you’re paying for private mortgage insurance (PMI) each month. Fortunately, if you have a conventional loan, your mortgage insurance automatically goes away once your loan principal balance reaches 78% of your home’s value. Alternatively, you can ask your lender to remove your mortgage insurance once you’ve built up at least 20% equity in your home.
- Ask about a mortgage modification. Some homeowners having serious issues keeping up with their housing costs may be able to work with their lender to get a mortgage modification. Depending on their lender’s options, a mortgage modification can help a person lower their monthly housing costs by reducing their mortgage payment.
Methodology
LendingTree analyzed data from the U.S. Census Bureau 2022 American Community Survey with one-year estimates — the latest available at the time of writing.
Specifically, LendingTree used American Community Survey microdata to determine the share of owner-occupied households in each of the nation’s 50 states that were spending more than 30% of their monthly household incomes on housing costs.
The Census Bureau defines housing costs for owner-occupied housing units as: “The sum of payments for mortgages, deeds of trust, contracts to purchase or similar debts on the property (including payments for the first mortgage, second mortgages, home equity loans and other junior mortgages); real estate taxes; fire, hazard and flood insurance on the property; utilities (electricity, gas, and water and sewer); and fuels (oil, coal, kerosene, wood, etc.). It also includes, where appropriate, the monthly condominium fee for condominiums and mobile home costs (personal property taxes, site rent, registration fees and license fees).”
View mortgage loan offers from up to 5 lenders in minutes