LendingTree Finds That Google Searches for ‘Homes for Sale’ Rose Again in June in 50 of the Nation’s Largest Metros

Though the COVID-19 crisis continues throughout the United States, the housing market has shown signs of recovery. Spurred by record-low rates and relaxed social distancing guidelines, in-person home showings have returned, and the volume of mortgage applications have spiked over recent weeks.
Unfortunately, because coronavirus cases have been growing in many parts of the country, it’s impossible to say just how long this spike in mortgage applications will last. Nonetheless, for the time being, it appears that many Americans are jump-starting their home searches.
One way to gauge people’s interest in purchasing homes is to measure internet searches, especially because many homebuyers start the process online. With that in mind, LendingTree analyzed Google search data to see how popular the search term “homes for sale” is in 50 of the nation’s largest metros. Google defines search popularity using “search-interest values.” These values exist on a scale of 0 to 100; 100 means the search term is at peak popularity.
LendingTree found that searches for the term “homes for sale” continue to rise from both their 2020 lows (and their values at the end of May) in each metro featured in this study.
Key findings
- Searches for “homes for sale” rose from their 2020 lows in each metro featured in this study. The average lowest search-interest value in 2020 for all 50 metros was about 50. By the end of June, that number grew by 95.21%, to nearly 98.
- In 30 of the 50 metros looked at in LendingTree’s study, the search term, “homes for sale,” hit its peak search-interest value of 100 in June, signifying searches for the term are at their peak popularity. Only one metro, St. Louis, has a search-interest value lower than 90.
- Grand Rapids, Mich., Providence, R.I. and Minneapolis saw the largest increases in search interest since their lowest points this year. On average, the search-interest values in these areas surged by 133.17% from their 2020 lows.
- Oklahoma City, Tampa, Fla. and St. Louis have seen the smallest growth in searches since their low points this year. In these three metros, the popularity of the search term increased by 63.49% from its lowest value.
- Grand Rapids, Mich., Minneapolis and Sacramento, Calif., are the metros with the largest month-over-month search growth. Search-interest values in these metros grew an average of 39.02% from the end of May to the end of June.
- Birmingham, Ala., Denver and Austin, Texas saw the smallest increase in searches from May to June. The average month-over-month growth rate in these three metros was 4.42%. Although the growth rate was small in these areas, each metro still has a search-interest value of 90 or higher, with Birmingham’s value of 100 signifying peak popularity for the search term “homes for sale.”
Metros with largest percentage increase in Google searches for ‘homes for sale’ since 2020 low
No. 1: Grand Rapids, Mich.
- End of June 2020 search-interest value: 100
- 2020 search-interest value low: 42
- Percentage increase in search-interest value from 2020 low to the end of June: 138.10%
No. 2: Providence, R.I.
- End of June 2020 search-interest value: 96
- 2020 search-interest value low: 41
- Percentage increase in search-interest value from 2020 low to the end of June: 134.15%
No. 3: Minneapolis
- End of June 2020 search-interest value: 100
- 2020 search-interest value low: 44
- Percentage increase from 2020 search-interest value low to the end of June: 127.27%
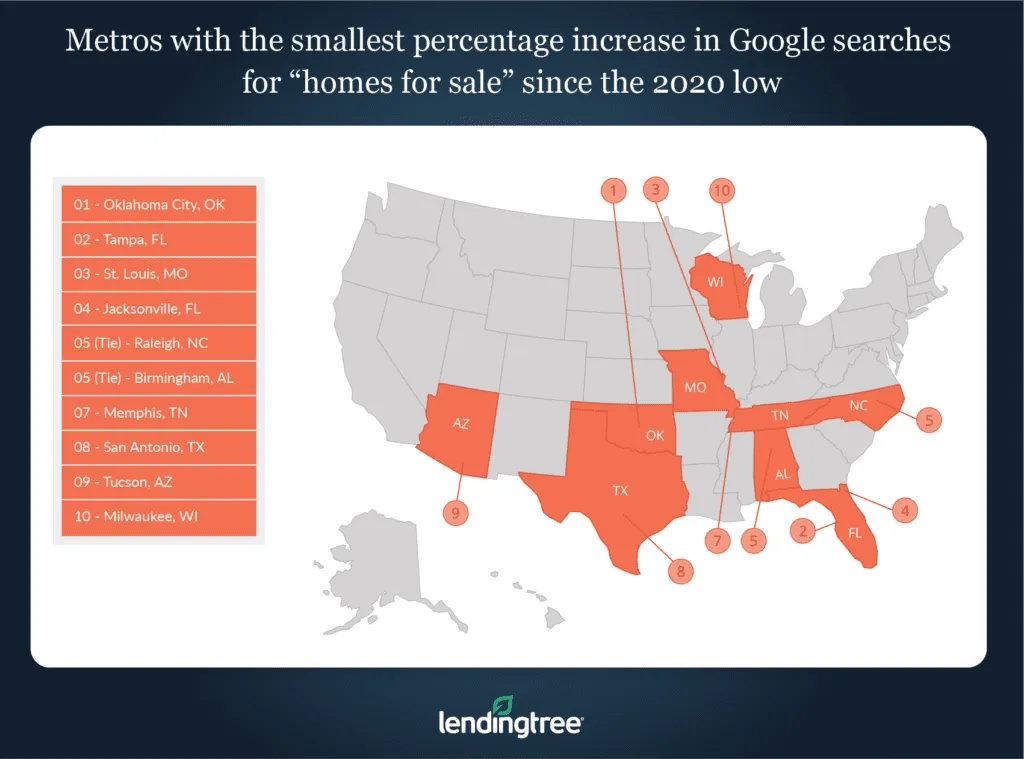
Metros with smallest percentage increase in Google searches for ‘homes for sale’ since the 2020 low
No. 1: Oklahoma City
- End of June 2020 search-interest value: 98
- 2020 search-interest value low: 61
- Percentage increase in search-interest value from 2020 low to the end of June: 60.66%
No. 2: Tampa, Fla.
- End of June 2020 search-interest value: 95
- 2020 search-interest value low: 58
- Percentage increase in search-interest value from 2020 low to the end of June: 63.79%
No. 3: St. Louis
- End of June 2020 search-interest value: 88
- 2020 search-interest value low: 53
- Percentage increase in 2020 search-interest value low to the end of June: 66.04%
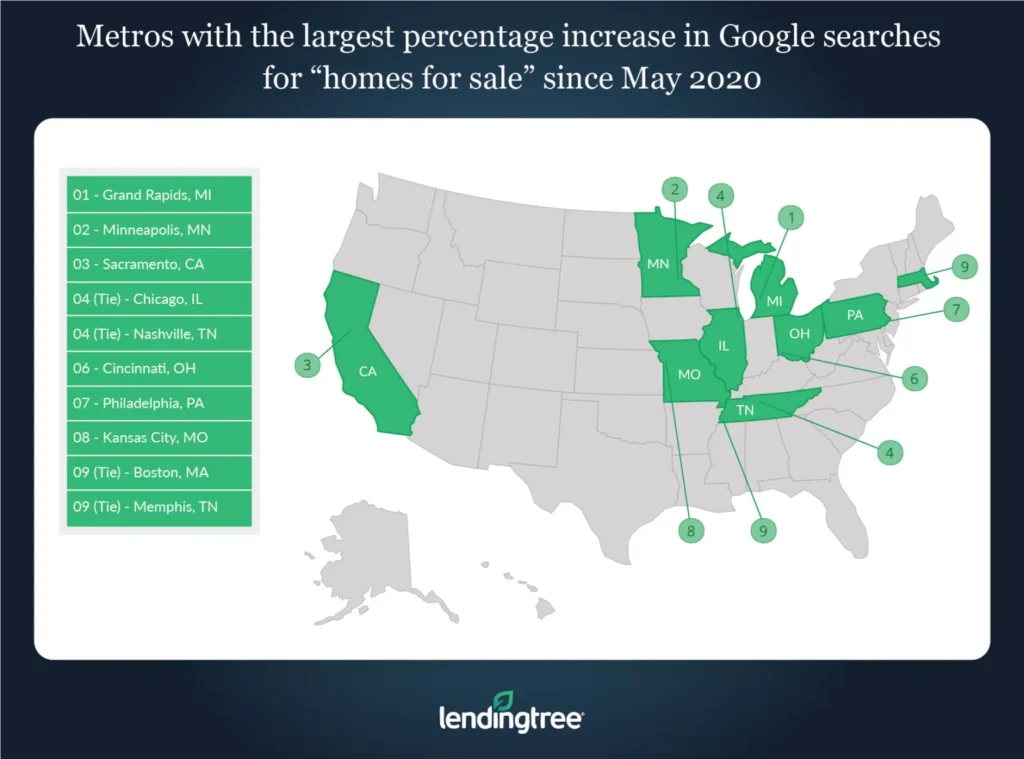
Metros with largest percentage increase in Google searches for ‘homes for sale’ since May 2020
No. 1 Grand Rapids, Mich.
- End of June 2020 search-interest value: 100
- End of May 2020 search-interest value: 69
- Percentage increase in search-interest value from May to June: 44.93%
No. 2: Minneapolis
- End of June 2020 search-interest value: 100
- End of May 2020 search-interest value: 73
- Percentage increase in search-interest value from May to June: 36.99%
No. 3: Sacramento, Calif.
- End of June 2020 search-interest value: 100
- End of May 2020 search-interest value: 74
- Percentage increase in search-interest value from May to June: 35.14%
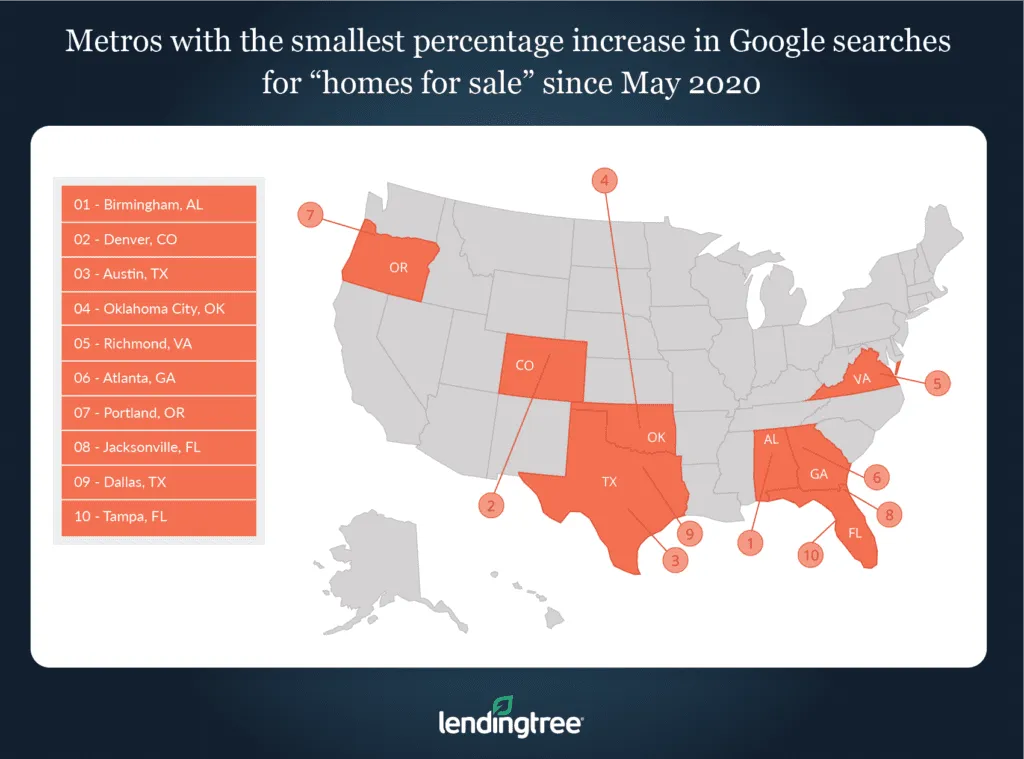
Metros with smallest percentage increase in Google searches for ‘homes for sale’ since May 2020
No. 1: Birmingham, Ala.
- End of June 2020 search-interest value: 100
- End of May 2020 search-interest value: 96
- Percentage increase in search-interest value from May to June: 4.17%
No. 2: Denver
- End of June 2020 search-interest value 94
- End of May 2020 search-interest value: 90
- Percentage increase in search-interest value from May to June: 4.44%
No. 3: Austin, Texas
- End of June 2020 search-interest value: 86
- End of May 2020 search-interest value: 90
- Percentage increase in search-interest value from May to June: 4.65%
The data for this piece is sourced from Google Trends. The “search-interest numbers/values” are defined by Google in the following way: “Numbers represent search interest relative to the highest point on the chart for the given region and time. A value of 100 is the peak popularity for the term. A value of 50 means that the term is half as popular. A score of 0 means there was not enough data for this term.”
The search-interest value at the end of June is defined as the search-interest value for the week beginning June 28, 2020, while the value at the end of May is defined as the search-interest value for the week beginning May 31, 2020.
LendingTree research analyst Jacob Channel contributed to this study.
View mortgage loan offers from up to 5 lenders in minutes