Staggering Sum: Value of Owner-Occupied Homes in Nation’s Largest Metros Tops $23 Trillion


Discussions on expensive housing are common, but it’s difficult to appreciate the value of real estate. It’s one thing to gawk at how much a house is worth, but it’s another to figure out the total value of homes in a given area.
With that in mind, LendingTree analyzed data from the latest U.S. Census Bureau American Community Survey to determine how much money American homes are worth collectively. Specifically, we used Census data to examine the total value of owner-occupied housing units in each of the 50 largest U.S. metropolitan areas.
We found that owner-occupied housing units in the nation’s largest metros are valued at more than $23 trillion total.
Key findings
- The total value of owner-occupied housing units in the nation’s 50 largest metros is $23.48 trillion. This figure grew by about 38% between 2019 and 2022, from $17.02 trillion.
- Real estate value in the nation’s 50 largest metros makes up the bulk of that value across the country. The total value of all owner-occupied homes in the U.S. is $36.60 trillion. This means the value of homes in the nation’s largest metros accounts for 64.1% of the total value of homes across the U.S.
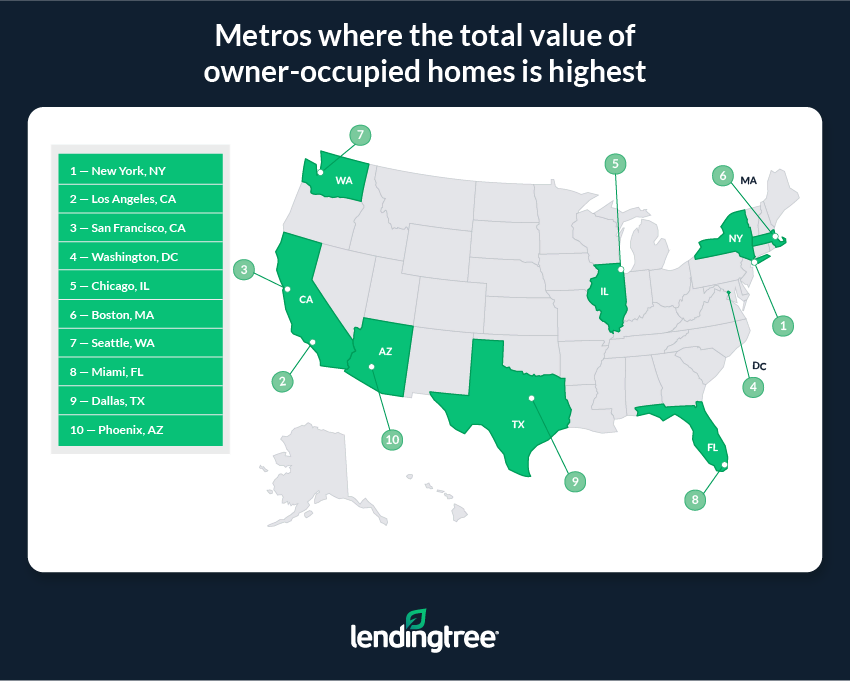
- Based on the total value of owner-occupied homes within them, New York, Los Angeles and San Francisco are the most valuable metros in the U.S. The total value of homes in the New York metro is $2.75 trillion, while the total values in Los Angeles and San Francisco are $2.31 trillion and $1.39 trillion, respectively. At $1.01 trillion, the Washington, D.C., metro is the only other where the total value of owner-occupied homes is over $1 trillion.
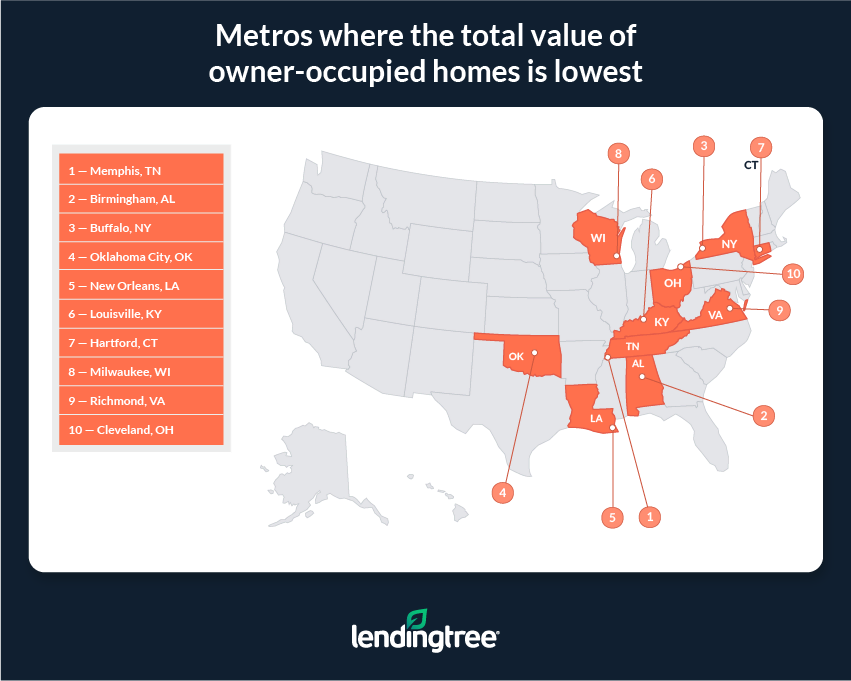
- On the whole, real estate is less valuable in Memphis, Tenn., Birmingham, Ala., and Buffalo, N.Y. With respective values of $88.4 billion, $90.4 billion, and $93.1 billion, respectively, the total values of owner-occupied homes in these three areas are still steep. However, they’re relatively modest compared to many others. Oklahoma City, where the total value of owner-occupied housing units is $96.2 billion, is the only other metro where homeowners are sitting on less than $100 billion in aggregate real estate value.
- Collectively, owner-occupied housing units with a mortgage are worth more than those without a mortgage. Across the nation’s 50 largest metros, the total value of homes with a mortgage is $15.83 trillion — $8.18 trillion higher than the total value of homes without a mortgage. There are various reasons why this is the case — chief among them is that there are more than 13 million more owner-occupied homes with a mortgage in these metros than owner-occupied homes without one.
Metros where the total value of owner-occupied homes is highest
No. 1: New York, N.Y.
- Total value of all owner-occupied housing units: $2.75 trillion
- Total value of owner-occupied housing units with a mortgage: $1.69 trillion
- Total value of owner-occupied housing units without a mortgage: $1.05 trillion
- Median home value: $578,800
- % growth in total value of all owner-occupied housing units from 2019 to 2022: 20.8%
- % growth in total value of owner-occupied housing units with a mortgage from 2019 to 2022: 20.1%
- % growth in total value of owner-occupied housing units without a mortgage from 2019 to 2022: 22.0%
No. 2: Los Angeles
- Total value of all owner-occupied housing units: $2.31 trillion
- Total value of owner-occupied housing units with a mortgage: $1.59 trillion
- Total value of owner-occupied housing units without a mortgage: $717.8 billion
- Median home value: $847,400
- % growth in total value of all owner-occupied housing units from 2019 to 2022: 30.0%
- % growth in total value of owner-occupied housing units with a mortgage from 2019 to 2022: 27.6%
- % growth in total value of owner-occupied housing units without a mortgage from 2019 to 2022: 35.7%
No. 3: San Francisco
- Total value of all owner-occupied housing units: $1.39 trillion
- Total value of owner-occupied housing units with a mortgage: $962.1 billion
- Total value of owner-occupied housing units without a mortgage: $423.3 billion
- Median home value: $1,135,500
- % growth in total value of all owner-occupied housing units from 2019 to 2022: 30.7%
- % growth in total value of owner-occupied housing units with a mortgage from 2019 to 2022: 29.9%
- % growth in total value of owner-occupied housing units without a mortgage from 2019 to 2022: 32.4%
Metros where the total value of owner-occupied homes is lowest
No. 1: Memphis, Tenn.
- Total value of all owner-occupied housing units: $88.4 billion
- Total value of owner-occupied housing units with a mortgage: $60.1 billion
- Total value of owner-occupied housing units without a mortgage: $28.3 billion
- Median home value: $244,100
- % growth in total value of all owner-occupied housing units from 2019 to 2022: 41.7%
- % growth in total value of owner-occupied housing units with a mortgage from 2019 to 2022: 44.9%
- % growth in total value of owner-occupied housing units without a mortgage from 2019 to 2022: 35.5%
No. 2: Birmingham, Ala.
- Total value of all owner-occupied housing units: $90.4 billion
- Total value of owner-occupied housing units with a mortgage: $59.8 billion
- Total value of owner-occupied housing units without a mortgage: $30.6 billion
- Median home value: $247,500
- % growth in total value of all owner-occupied housing units from 2019 to 2022: 35.8%
- % growth in total value of owner-occupied housing units with a mortgage from 2019 to 2022: 33.8%
- % growth in total value of owner-occupied housing units without a mortgage from 2019 to 2022: 39.8%
No. 3: Buffalo, N.Y.
- Total value of all owner-occupied housing units: $93.1 billion
- Total value of owner-occupied housing units with a mortgage: $54.4 billion
- Total value of owner-occupied housing units without a mortgage: $38.6 billion
- Median home value: $219,300
- % growth in total value of all owner-occupied housing units from 2019 to 2022: 47.1%
- % growth in total value of owner-occupied housing units with a mortgage from 2019 to 2022: 35.3%
- % growth in total value of owner-occupied housing units without a mortgage from 2019 to 2022: 67.5%
Why has the value of real estate grown so large so quickly?
The total value of housing in the U.S. is gargantuan and has grown rapidly over the past few years. For example, the total value of owner-occupied housing units in the U.S. rose by about 39.7% (more than $10 trillion) between 2019 and 2022 — from $26.21 trillion to $36.60 trillion. In comparison, the increase between 2016 and 2019 was 19.5%.
A key reason for this dramatic rise stems from the record-low mortgage rates during the height of the COVID-19 pandemic. In 2020 and 2021, the average rate on a 30-year, fixed-rate mortgage tended to hover around 3.00%. Rates at that level made borrowing cheaper and drastically reduced the cost of a mortgage, providing a great incentive for people to buy, even at inflated prices.
At the same time, supply chain issues and other problems — like construction worker shortages — meant that too few new houses were being built to satisfy the extra demand created by low rates. This put even more upward pressure on prices.
Though rates have since risen, supply chains and labor shortages have improved and mortgage demand has fallen, the home price gains seen during the height of the pandemic have stuck around. For this reason, Americans still collectively own so much in total real estate value, even in the face of the slow-moving housing market of the latter half of 2022 and today.
Tips for protecting and growing the value of your home
While certain events in the broader macroeconomy can influence the price of a person’s home for reasons outside of their control, there are still numerous ways for individuals to help protect and grow the value of their property. Here are three examples:
- Keep up with regular maintenance. Though it isn’t always fun, conducting routine maintenance is an important part of homeownership. If you let your home fall into a state of disrepair, its value could drop. In extreme cases, a lack of maintenance could make your home unsafe or otherwise unlivable.
- Renovate and remodel. Remodeling high-traffic areas like kitchens or bathrooms can make your house seem more appealing to potential buyers, as well as boost its value. If you’re responsible with your money and have a significant amount of equity built up, a home equity loan can help you pay for more expensive renovations. Even if you’re not planning on selling, renos like an upgraded kitchen can make living in your house a more pleasant experience.
- Think green. Energy-efficient upgrades — like replacing drafty windows, adding insulation or installing solar panels — can help you save money on your utility bills and help a home better hold onto its value. After all, more energy-efficient homes often sell for more than their less-efficient counterparts.
Methodology
LendingTree analyzed the U.S. Census Bureau 2022 American Community Survey with one-year estimates — the latest available — and 2019 American Community Survey with one-year estimates.
This study looks at the aggregate, or total, value of owner-occupied housing units in each of the nation’s 50 largest metropolitan statistical areas. Note that the aggregate value of housing units with a mortgage referenced in this study looks at homes with any type of mortgage, including second mortgages.
View mortgage loan offers from up to 5 lenders in minutes