In With the New: Metros With the Largest Share of Recently Built Housing Units


A lack of housing supply is a serious issue in the U.S. It has put upward pressure on home prices and made buying prohibitively expensive for many.
That said, new housing units are being constructed. We have a long way to go before the nation’s housing shortage is fully addressed, but it’s worth recognizing the progress.
To find out where these new homes are being built, LendingTree analyzed the latest U.S. Census Bureau American Community Survey. While recently built houses aren’t particularly common in the nation’s 50 largest metropolitan areas, Southern states tend to have more new homes than their northern counterparts.
Key findings
- Across the nation’s 50 largest metros, 1.48 million housing units were built from 2020 through 2022. Put another way, just 1.95% of these metros’ 75.89 million housing units were built from 2020 through 2022.
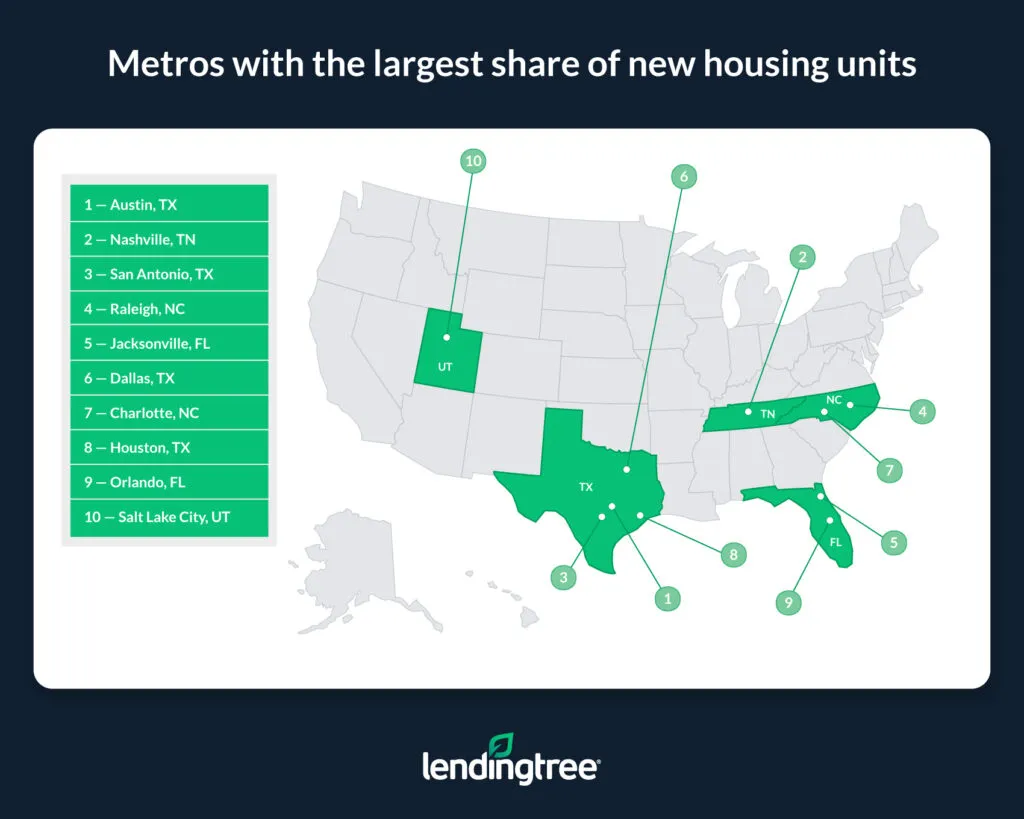
- Recently built housing units make up the largest share of homes in three South metros — Austin, Texas, Nashville, Tenn., and San Antonio. In these metros, 5.97%, 5.04% and 4.74% of housing units, respectively, were built from 2020 through 2022. One reason is that these metros experienced higher-than-average population growth between 2020 and 2022, which can spur new construction.
- New homes make up the smallest share of the housing supply in three Northeast metros — Hartford, Conn., Buffalo, N.Y., and Providence, R.I. In these metros, 0.47%, 0.59% and 0.67% of housing units, respectively, were built from 2020 through 2022.
- New homes tend to be more expensive than other houses, though exceptions exist. For example, the median value of homes built from 2020 through 2022 was lower than the overall median home value in only two metros, San Francisco and Austin. Various reasons exist for why a recently built home may be more expensive. A new home may contain more contemporary and costly finishes, and its builder may need to charge extra to offset the labor and material costs associated with construction. Conversely, older houses that are larger, historically significant or in nicer neighborhoods could demand higher prices than new builds.
Metros with the largest share of new housing units
No. 1: Austin, Texas
- Total housing units: 1,048,041
- Share of housing units built from 2020 through 2022: 5.97%
- Median value of housing units built from 2020 through 2022: $473,900
- Median value of all housing units: $490,000
- Difference between median value of housing units built from 2020 through 2022 and median value of all housing units: -$16,100
No. 2: Nashville, Tenn.
- Total housing units: 889,476
- Share of housing units built from 2020 through 2022: 5.04%
- Median value of housing units built from 2020 through 2022: $495,700
- Median value of all housing units: $421,500
- Difference between median value of housing units built from 2020 through 2022 and median value of all housing units: $74,200
No. 3: San Antonio
- Total housing units: 1,057,291
- Share of housing units built from 2020 through 2022: 4.74%
- Median value of housing units built from 2020 through 2022: $357,000
- Median value of all housing units: $275,700
- Difference between median value of housing units built from 2020 through 2022 and median value of all housing units: $81,300
Metros with the smallest share of new housing units
No. 1: Hartford, Conn.
- Total housing units: 527,857
- Share of housing units built from 2020 through 2022: 0.47%
- Median value of housing units built from 2020 through 2022: $464,000
- Median value of all housing units: $305,700
- Difference between median value of housing units built from 2020 through 2022 and median value of all housing units: $158,300
No. 2: Buffalo, N.Y.
- Total housing units: 541,766
- Share of housing units built from 2020 through 2022: 0.59%
- Median value of housing units built from 2020 through 2022: $457,500
- Median value of all housing units: $219,300
- Difference between median value of housing units built from 2020 through 2022 and median value of all housing units: $238,200
No. 3: Providence, R.I.
- Total housing units: 731,061
- Share of housing units built from 2020 through 2022: 0.67%
- Median value of housing units built from 2020 through 2022: $611,800
- Median value of all housing units: $398,300
- Difference between median value of housing units built from 2020 through 2022 and median value of all housing units: $213,500

More new construction is needed to build an affordable housing market
Given that our study shows that newly built houses tend to be more expensive than other homes, it may seem counterintuitive to acknowledge that a lack of new construction is primarily to blame for the nation’s prohibitively expensive housing market. But it’s true.
The reason is that price, at the simplest level, is the result of the relationship between the supply of a good and the demand for it. Barring some exceptions, more supply and less demand typically results in lower prices, while less supply and more demand results in higher prices. Even though relatively steep mortgage rates have dampened homebuyer demand, too many people are looking to buy relative to the number of homes for sale. Thus, prices remain steep.
When more new homes are introduced in a given market, supply goes up, and buyers have more wiggle room to negotiate deals or otherwise avoid being outbid. Even if new homes remain out of reach to many, the excess supply created by more construction makes entering the housing market easier for those not necessarily well off. After all, if the wealthy gravitate toward newer, higher-end and more expensive units, they’ll be less likely to compete with lower-income buyers for older and less valuable housing stock.
Of course, this is a simplified example of how the broader U.S. housing market works, and some local markets will have different needs than others. Further, there are instances where building new homes can make housing affordability issues worse. Bulldozing a low-income neighborhood and replacing the housing with fewer, more expensive homes isn’t much help. Similarly, there may be instances where sellers refuse to budge on steep asking prices, even if there’s a lot of supply available for buyers.
Nonetheless, if new construction is done responsibly and to increase housing supply, it’s typically more helpful than not.
Tips for those looking to buy a new home
Especially in today’s housing market, buying a newly built home can be expensive. The following tips can help you save money.
- Recognize that not all new construction is created equal. New builds can vary significantly in quality, features and long-term value. While a new home might be appealing at first glance, consider factors like the materials used in its construction, the neighborhood and the reputation of the builder before buying. Just because a home is new doesn’t mean it’s inherently better than an older house.
- Remember, you can still negotiate. As with any home, prices for new construction aren’t necessarily set in stone. Owing to this, something as simple as asking a builder for a discount can pay off. Even if you can’t negotiate a lower price, you could still convince the builder to pay for a rate buydown, which can help you get a lower rate on your mortgage with no extra upfront costs.
- Shop around for a mortgage before you buy. Different lenders can offer different rates to the same borrowers. By shopping around for a mortgage and comparing offers from different lenders before buying, you could snag a lower rate on your home loan and make buying a house, new or otherwise, more affordable.
Methodology
We analyzed U.S. Census Bureau 2022 American Community Survey data with one-year estimates — the latest available at the time of writing.
The data was compiled at the metropolitan statistical area (MSA) level.
View mortgage loan offers from up to 5 lenders in minutes