Which States Are at Highest Risk for Recession?
A Federal Reserve Bank of New York model puts the risk of recession at almost 40% over the next 12 months.
This — in addition to heightening trade tensions and growing market sentiment that the Fed will again cut rates at the end of 2019 — has amplified the chorus of news reports arguing that the economy is weakening. Despite this growing concern, it is difficult to determine when an economic downturn will hit — or how bad it will be.
Even though economics on the national level is directly tied to economics on the state level, the two do not always behave the same way. For example, according to the National Bureau of Economic Research, the last time the U.S. was in recession was from Q4 of 2007 to Q2 of 2009. However, as our study shows, not every state started and ended its last recession at the same time that the United States did. Furthermore, there have been five states where recessions have hit between the last national recession and now. The most recent example being Alaska, where the last recession started in quarter two of 2016 and ended in quarter two of 2017. As a result, in order to be as prepared as possible for the next recession, people should be sure to look at state level economic indicators in addition to those on the national level.
We built a model to evaluate how at risk each state is for a recession. Specifically, our model estimates the likelihood that a state will have weak economic fundamentals, as determined by the growth rate of that state’s coincident index. State coincident indexes — created by the Federal Reserve Bank of Philadelphia — gauge how well a state economy is doing.
If a state has a negative year-over-year growth rate in its coincident index, it’s likely that that state has weak economic fundamentals. If a state has a negative year-over-year growth rate in its coincident index for two or more consecutive quarters, then we’ve considered it to likely be in recession.
It is important to note that the last recession was centered on the housing market. But, since then, the quality of mortgages outstanding has improved markedly. There are far fewer variable rate loans, which were particularly risky when rates reset higher, and borrowers generally have higher credit scores and more equity in their homes. Thus we think the risk of severe downturn in the housing market is low. That being said, our model does include two housing metrics, home prices and housing permits issued, given the importance of this sector for consumers and for the economy as a whole.
Key findings
- The states that show the highest probability for weak economic fundamentals — and are thus at a higher risk of recession — are Michigan, Hawaii and Montana. At 58.86%, the chance that Michigan will have weak economic fundamentals in the fourth quarter is the highest in the nation. In fact, Michigan’s state coincident index’s growth rate was negative in July (the last month available at the time of this piece’s writing), all but confirming that its economy is on shaky grounds. Despite ranking second and third respectively, Hawaii and Montana seem to be in better shape than Michigan. The growth rates for the states’ coincident indexes were both positive in July, and the likelihood of weak economic fundamentals in both states’ near futures is below 50%.
- The states that show the lowest probability for weak economic fundamentals — and are thus at a lower risk of recession —are Nebraska, Oregon and Idaho. Our model suggests that all three of these states show a 0.00% chance of having weak fundamentals in the fourth quarter. That said, as is always the case with economic modeling, an unforeseen shock to the economy can cause these probabilities to shift radically. Therefore, while citizens of these states shouldn’t worry too much about an impending recession, they should nonetheless remain vigilant and prepared.
- While some states show a high likelihood of weak economic fundamentals in the near future, most appear to be in good shape. Our model predicts that by Q4 of 2019, the probability of weak economic fundamentals in 42 states will be below 5%. Based on the conclusions of our model, it seems that — barring any drastic changes — most states aren’t in immediate risk of recession.
- Though our model predicts that most states will still be in good shape by the end of the year, these rosy outlooks can turn gloomy quickly. This is because economic circumstances, especially on the state level, can change very quickly. Therefore, just because there isn’t a high likelihood that most states will experience weak economic fundamentals by the end of the year doesn’t mean that they are totally in the clear for the foreseeable future.
- While the economic fundamentals we considered — home price growth, unemployment rate growth, tax growth and personal income growth — are generally good indicators for how well an economy is doing, they are not the only indicators that matter. For example, some states can occasionally appear to be more or less healthy than they are, depending on what other industries serve as the main drivers of their economy. Therefore, while our model can be a useful tool in assessing the risk of recessions, there are other factors at play.
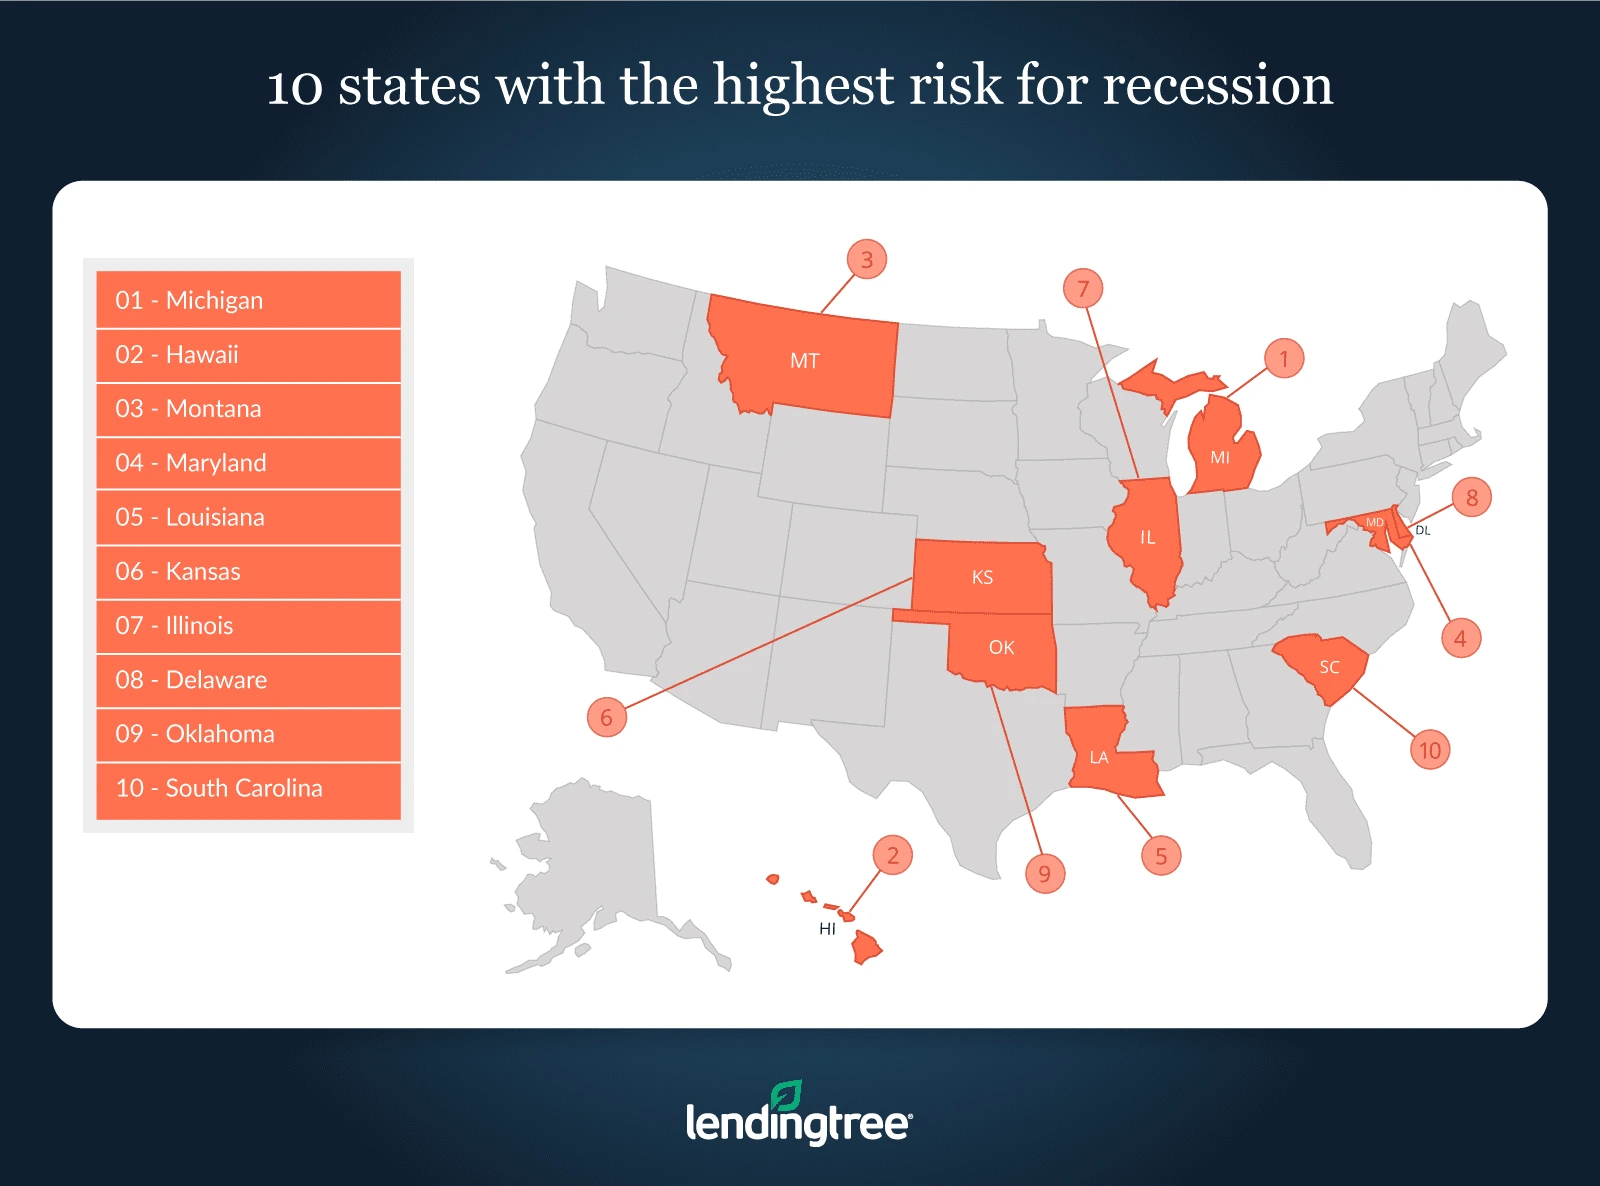
10 states with the highest risk for recession
No. 1: Michigan
- Probability of weak economic fundamentals in Q4 2019: 58.86%
- State coincident index growth rate in July 2019: -0.29%
- Start of last recession: Q4 2007
- End of last recession: Q1 2010
No. 2: Hawaii
- Probability of weak economic fundamentals in Q4 2019: 30.53%
- State coincident index growth rate in July 2019: 0.52%
- Start of last recession: Q4 2007
- End of last recession: Q4 2009
No. 3: Montana
- Probability of weak economic fundamentals in Q4 2019: 11.60%
- State coincident index growth rate in July 2019: 3.56%
- Start of last recession: Q3 2007
- End of last recession: Q4 2010
No. 4: Maryland
- Probability of weak economic fundamentals in Q4 2019: 10.88%
- State coincident index growth rate in July 2019: 2.33%
- Start of last recession: Q3 2008
- End of last recession: Q2 2010
No. 5: Louisiana
- Probability of weak economic fundamentals in Q4 2019: 7.56%
- State coincident index growth rate in July 2019: 0.20%
- Start of last recession: Q1 2016
- End of last recession: Q4 2016
No. 6: Kansas
- Probability of weak economic fundamentals in Q4 2019: 5.21%
- State coincident index growth rate in July 2019: 1.59%
- Start of last recession: Q3 2008
- End of last recession: Q1 2010
No. 7: Illinois
- Probability of weak economic fundamentals in Q4 2019: 5.14%
- State coincident index growth rate in July 2019: 1.78%
- Start of last recession: Q3 2007
- End of last recession: Q1 2010
No. 8: Delaware
- Probability of weak economic fundamentals in Q4 2019: 5.14%
- State coincident index growth rate in July 2019: 3.28%
- Start of last recession: Q2 2008
- End of last recession: Q1 2010
No. 9: Oklahoma
- Probability of weak economic fundamentals in Q4 2019: 4.32%
- State coincident index growth rate in July 2019: 2.30%
- Start of last recession: Q1 2009
- End of last recession: Q2 2010
No. 10: South Carolina
- Probability of weak economic fundamentals in Q4 2019: 3.83%
- State coincident index growth rate in July 2019: 2.40%
- Start of last recession: Q3 2008
- End of last recession: Q1 2010
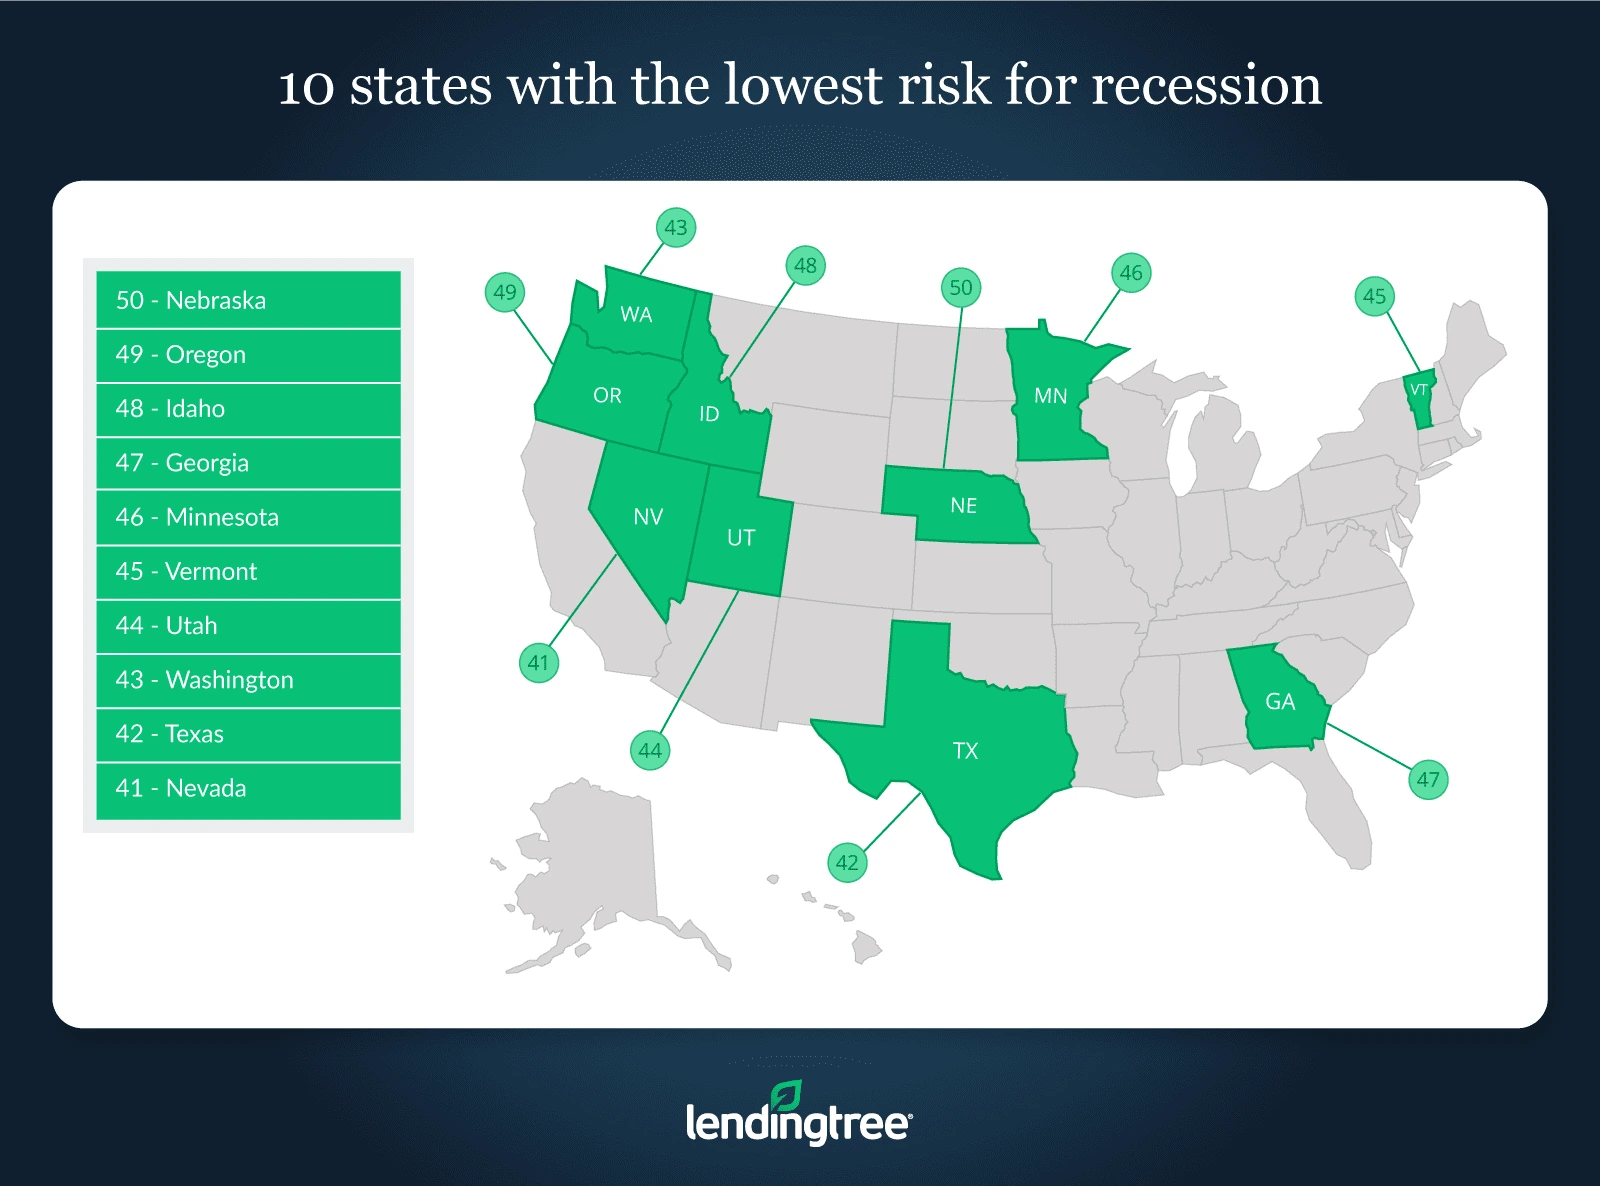
10 states with the lowest risk for recession
No. 1: Nebraska
- Probability of weak economic fundamentals in Q4 2019: 0.00%
- State coincident index growth rate in July 2019: 1.54%
- Start of last recession: Q1 2009
- End of last recession: Q4 2009
No. 2: Oregon
- Probability of weak economic fundamentals in Q4 2019: 0.00%
- State coincident index growth rate in July 2019: 3.14%
- Start of last recession: Q4 2008
- End of last recession: Q4 2009
No. 3: Idaho
- Probability of weak economic fundamentals in Q4 2019: 0.00%
- State coincident index growth rate in July 2019: 3.64%
- Start of last recession: Q3 2008
- End of last recession: Q1 2010
No. 4: Georgia
- Probability of weak economic fundamentals in Q4 2019: 0.00%
- State coincident index growth rate in July 2019: 3.31%
- Start of last recession: Q4 2008
- End of last recession: Q1 2010
No. 5: Minnesota
- Probability of weak economic fundamentals in Q4 2019: 0.01%
- State coincident index growth rate in July 2019: 0.69%
- Start of last recession: Q3 2008
- End of last recession: Q4 2009
No. 6: Vermont
- Probability of weak economic fundamentals in Q4 2019: 0.04%
- State coincident index growth rate in July 2019: 4.54%
- Start of last recession: Q2 2008
- End of last recession: Q4 2009
No. 7: Utah
- Probability of weak economic fundamentals in Q4 2019: 0.04%
- State coincident index growth rate in July 2019: 4.88%
- Start of last recession: Q3 2008
- End of last recession: Q1 2010
No. 8: Washington
- Probability of weak economic fundamentals in Q4 2019: 0.05%
- State coincident index growth rate in July 2019: 3.04%
- Start of last recession: Q3 2008
- End of last recession: Q1 2010
No. 9: Texas
- Probability of weak economic fundamentals in Q4 2019: 0.06%
- State coincident index growth rate in July 2019: 3.84%
- Start of last recession: Q2 2009
- End of last recession: Q1 2010
No. 10: Nevada
- Probability of weak economic fundamentals in Q4 2019: 0.09%
- State coincident index growth rate in July 2019: 4.79%
- Start of last recession: Q1 2008
- End of last recession: Q4 2010
How to prepare yourself for a recession
While many people can and do make it through them in decent shape, recessions can be difficult to overcome — and people can unquestionably be hurt by them.
Therefore, it’s important to remain proactive in the face of a potential recession and take adequate steps to properly prepare for one. Below are several things you can do to make living through a recession a little bit easier.
- Understand how your employer is doing financially. Doing so can help you gauge how well you think the business can weather a recession. If it has consistently been missing business goals, cutting benefits and laying off employees, it might be time to look for work at a company more equipped to handle a recession.
- Increase your value in your current role. During a recession, employers often make cuts to their workforce. Make sure that you’re invaluable to your company by clearly communicating with your supervisors and ensuring that you are accomplishing tasks to the highest possible standard.
- Boost your skill set. Having a broader skill set can help make you more employable. If your company needs to downsize during a recession, you may be able to leverage your additional skills to find a new job in the company in a different role. If you do get laid off, a wide skill set can make you more attractive to potential new employers.
- Create alternative income sources. Sometimes a side hustle can be a big help during a recession since it may allow you to bring in a few extra dollars when you need it the most. Even if your alternative income sources, such as driving for Uber or renting out your extra bedroom on Airbnb, don’t bring in large amounts of cash, some extra income is always better than none.
- Increase emergency savings by optimizing spending habits. It’s crucial to build an emergency savings fund in any situation, but especially if you’re afraid that you’ll lose your job in a recession. While it can be difficult to find extra money to put away, there are some tools that can help. For example, refinancing your home loan to get a lower interest rate could help lower your monthly debt payments. Beyond that, keeping a close eye on your finances and avoiding unnecessary spending, such as frequently eating out or making big splurges, can help you save extra money.
- Hold on to your assets. When recessions hit, the price of certain assets like stocks or real estate can fall. As a result, it can be tempting to panic and try to sell these assets to prevent future loss. However, because of the nature of both the housing and stock markets, the values of these assets usually rebound after a recession. Therefore, one way to prevent loss during a recession is to hold on to your assets, even if their value appears to be falling, while you wait for the economy to recover.
- Understand government programs. From unemployment benefits to the USDA Supplemental Nutrition Assistance Program — also known as SNAP — the government has numerous programs designed to help you get back on your feet if you’re hit hard during a recession.
- Engage in local and national politics and administration. Being active in politics can be a great way to have your voice heard, especially during economic downturns. Pressure from concerned citizens can help mobilize governments to institute policies that help people who have been hit the hardest by recessions and can help prevent them in the future.
- Don’t panic and be smart. While talk of a recession can be scary, it’s important not to let it control your life. Every recession that has hit the U.S. has eventually ended. Make sure to remain level-headed and financially responsible.
Methodology
For this study, we use a logit model. This model utilizes a logistic regression to determine the probability of an event that has two possible outcomes. In our case, the outcomes are either that there will be a negative year-over-year quarterly growth rate in a state’s coincident index — as determined by the Federal Reserve Bank of Philadelphia — or a positive year-over-year quarterly growth rate. A growth rate of zero is considered positive in this case.
To measure the likelihood that a state has weak economic fundamentals, we created a binary dummy variable to represent the growth rate of that state’s coincident index. If the growth rate was positive, the dummy variable was equal to zero. If negative, it was equal to one.
Our model uses the growth rate in a state’s coincident index as its dependent variable since these indexes are a good way to measure a state’s overall economic conditions. The indexes are created using a dynamic factor model that combines four state-level variables into a single index number. The four state-level variables are: Nonfarm payroll employment, average hours worked in manufacturing by production workers, the unemployment rate, and wage and salary disbursements deflated by the Consumer Price Index (U.S. city average).
Because these indexes are specific to each state, we can use them to get a much clearer picture of a state’s economy than we could if we used a more general form of countrywide measurement, such as GDP growth. Because the factors that determine state coincident indexes vary by state, the indexes themselves will vary, as will their growth rates.
Aside from the state coincident indexes, we use five independent variables to estimate the likelihood of a future dependent variable being equal to one. We did this by lagging each of the independent variables by two quarters, meaning that, for example, independent variables from Q1 of a given year would be used to predict the economic fundamentals in Q3 of that same year. The lagging of these variables was necessary for us to be able to predict future likelihood of weak economic fundamentals.
The variables we used were state-leading indexes, as well as the year-over-year quarterly growth rates for home prices, unemployment rates, tax revenues and personal income. Respectively, the data on these variables came from:
- Federal Reserve Bank of Philadelphia page on State Leading Indexes
- Federal Housing Finance Agency’s quarterly House Price Index
- U.S. Bureau of Labor Statistics’ Local Area Unemployment Statistics
- U.S. Department of Commerce’s Bureau of Economic Analysis
- U.S. Census Bureau’s Annual Survey of State Government Tax Collections
Every state uses these five independent variables, but 27 states use an additional independent variable: Whether or not the U.S. as a whole is in recession during a given quarter. This variable comes from the Organisation for Economic Cooperation and Development (OECD), which uses data supplied by the National Bureau of Economic Research (NBER) to determine the start and end dates of a U.S. recession. Similar to our state coincident index growth rate binary, this variable uses a one to signify when the U.S. is in recession and a zero when it is not. Like the other independent variables, it was also lagged two quarters behind.
The states that used this sixth variable are: Arizona, Colorado, Florida, Georgia, Illinois, Indiana, Massachusetts, Minnesota, Mississippi, Missouri, Nebraska, Nevada, New Hampshire, New Jersey, New York, Ohio, Oregon, Pennsylvania, Rhode Island, South Carolina, Tennessee, Texas, Utah, Vermont, Virginia, Washington and Wisconsin. In each of these states, the introduction of this variable helped to create a better fitting and more accurate model. This was not the case for the other 23 states, so it was excluded from their models.
Louisiana is the only state with six independent variables that does not use whether or not the U.S. is in recession as its fifth independent variable. Instead, this state uses the year-over-year quarterly growth rate in the spot price of crude oil, as listed by West Texas Intermediate, to fill this spot.
To test our model, we use historical data from Q2 of 1982 through Q2 of 2019. While our model is generally able to accurately predict the historical probabilities of weak economic fundamentals in most states, there were some points in time where the model predicted a high likelihood of weak economic fundamentals when a state’s coincident index’s growth rate was positive, or predicted a low likelihood of weak fundamentals when the index’s growth rate was negative.
This imperfect track record is due to the complex nature of econometric modeling, as there will almost always be other factors outside of those considered in a model that can contribute to the behavior of the dependent variable. It is hypothetically possible to create a perfect — or near-perfect — logistic model given enough variables, but this is not possible for our model due to data limitations on state-level economic factors. Therefore, while our model is useful for measuring a state’s overall economic health, it is not without flaw. As a result, all of the likelihoods reported above should be viewed in that spirit.
View mortgage loan offers from up to 5 lenders in minutes