Over Half of Black Friday and Cyber Monday Purchases Made Online in 2020


With many Americans seeking to avoid large gatherings during the coronavirus pandemic, Black Friday looked a little different this year. Shoppers made more than half of their Black Friday and Cyber Monday purchases online in 2020, which means that online transactions surpassed in-store transactions, a LendingTree analysis found.
Using data from LendingTree, researchers analyzed how 29,000 of our users changed their spending habits between 2019 and 2020 on Black Friday and Cyber Monday. See how else consumers changed how and where they shopped year-over-year.
Key findings
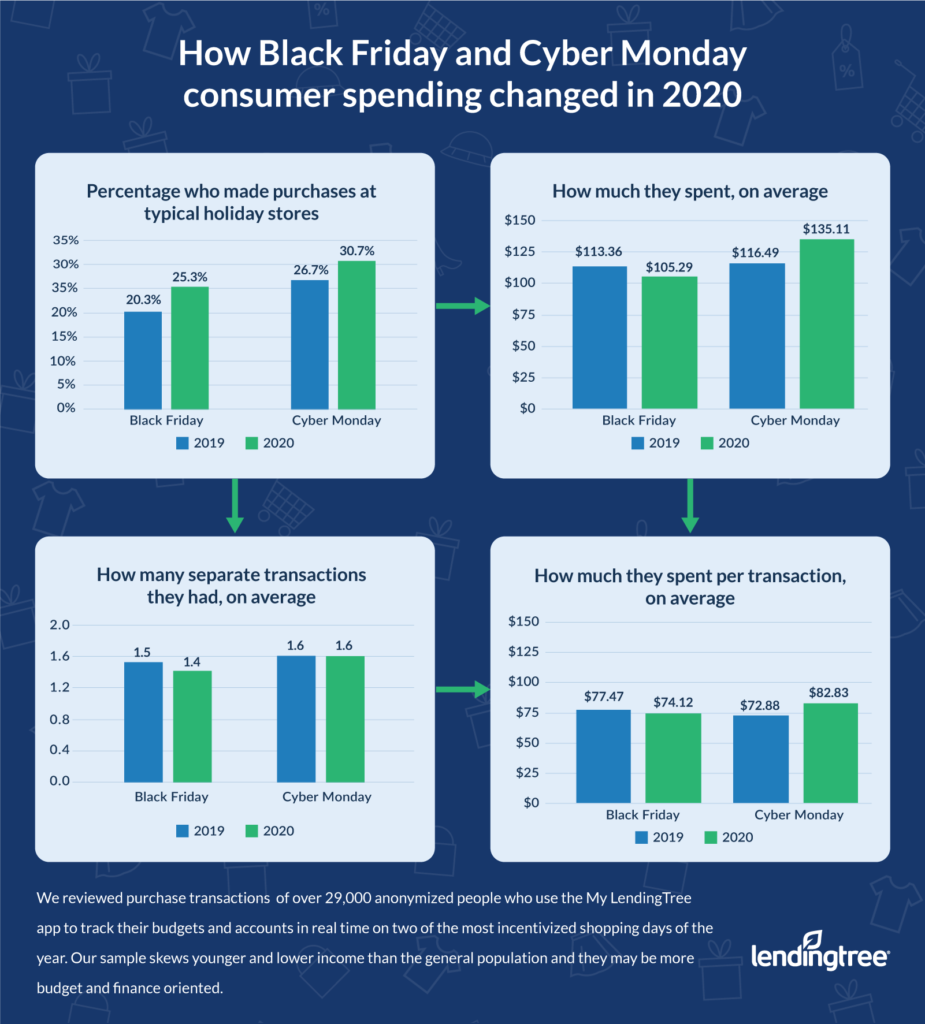
- Shoppers made the majority of their Black Friday and Cyber Monday purchases online rather than in-store. More than half (53%) of Black Friday purchases were made online, marking a drastic change from 42% in 2019. Over half (52%) of Cyber Monday purchases were made online, up from 47% in 2019.
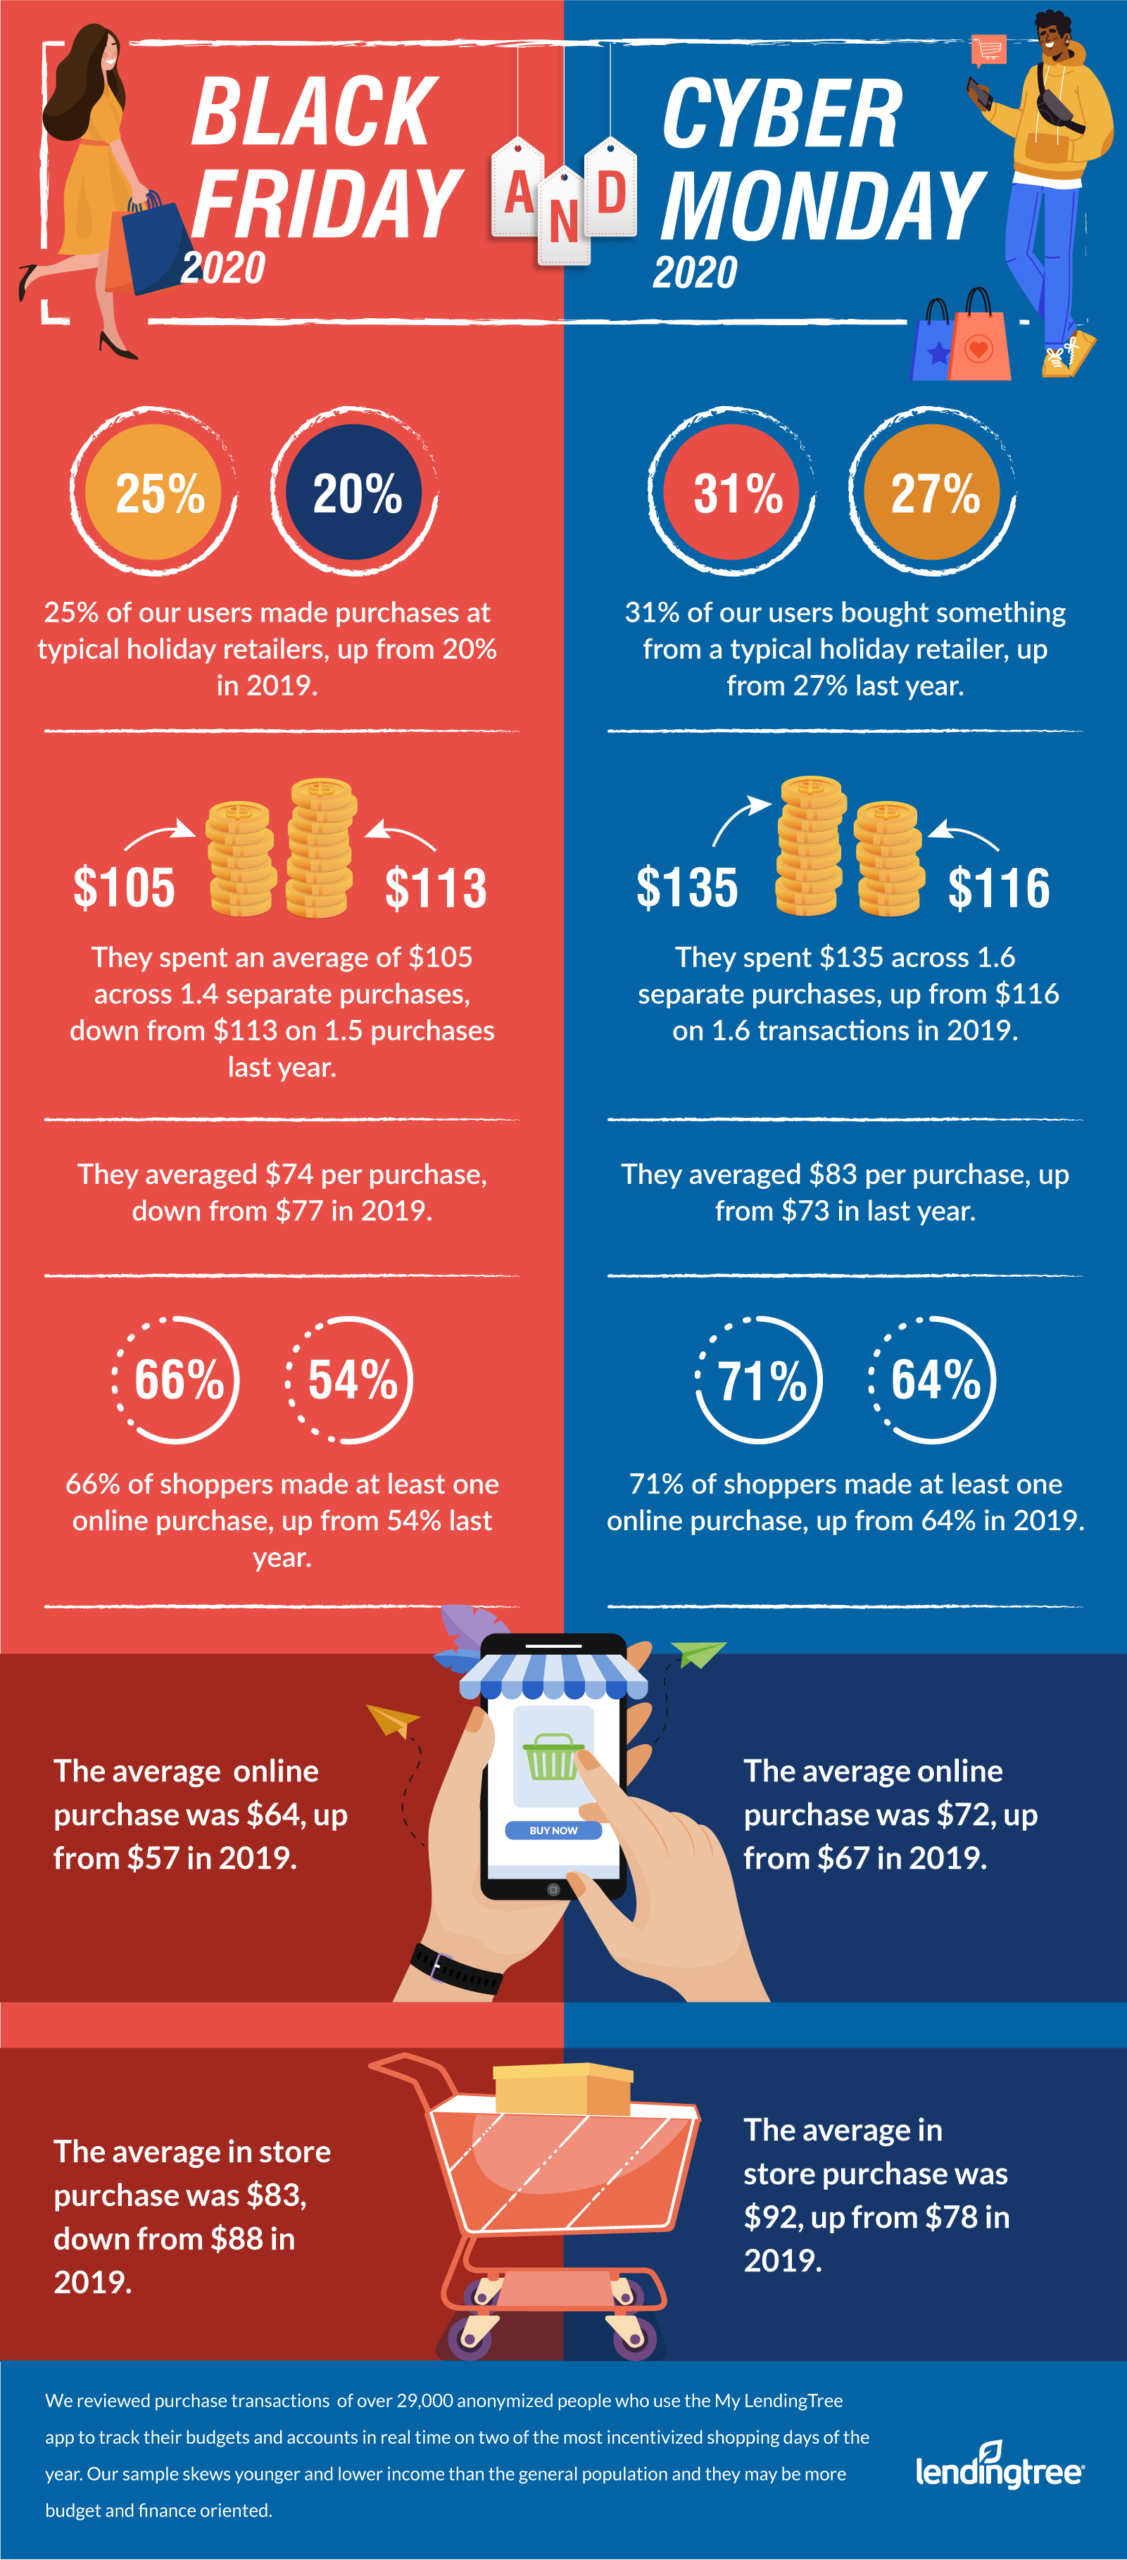
- More consumers shopped on Black Friday and Cyber Monday in 2020 than in 2019. One in four (25%) of our users bought something from a typical holiday season retailer on Black Friday 2020, up from one in five (20%) in 2019. Nearly a third (31%) of our users made a retail purchase on Cyber Monday 2020, up from 27% in 2019.
- Shoppers spent less money on Black Friday and more on Cyber Monday. Black Friday shoppers spent $105 on average in 2020, down from $113 in 2019. Cyber Monday shoppers spent $135 this year, up from $117 last year.
- Consumers spend more money when they’re shopping in-store. Black Friday and Cyber Monday shoppers spent $20 more on in-store purchase transactions compared to online in 2020.
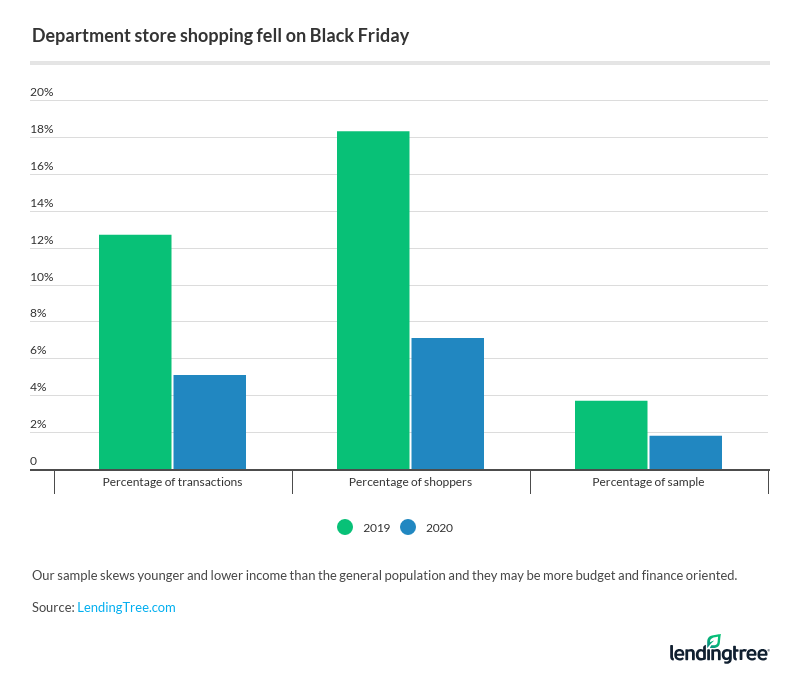
- Department stores struggled to attract holiday shoppers who opted to make digital purchases. Only 5% of Black Friday purchases and 6% of Cyber Monday purchases were at department stores, a stunning drop from 13% and 11% in 2019. Digital purchases were the big winner on Black Friday and Cyber Monday, composing 38% and 36% of all transactions on the holidays, respectively.
Most Black Friday and Cyber Monday purchases were made online
This year, Black Friday shoppers made more than half (53%) of their purchases online, making 2020 the first year there were more online purchases than in-store purchases for holiday shopping among LendingTree users, since we began collecting data in 2018. Also, more Cyber Monday purchases took place online than in-store among our users for the first time, at 52% online versus 48% in-store.
Certain types of retailers saw a larger shift to online shopping than others. The percentage of department store transactions that took place online on Black Friday increased to 24% this year, compared with 13% last year. Consumers also favored online Black Friday shopping for other typical holiday retailers, like sporting good stores and clothing stores.
Department stores also saw the largest shift to online purchases on Cyber Monday, at 28% in 2020 compared with 20% in 2019. Wholesale stores and furniture retailers followed closely behind.
More shoppers took advantage of retail holidays in 2020
A higher portion of consumers made purchases on Black Friday and Cyber Monday in 2020 than in 2019, our analysis revealed.
On Black Friday 2020, one in four (25%) consumers made a purchase at a traditional holiday retailer, up from one in five (20%) in 2019. One in six (17%) made at least one online purchase, and one in eight (13%) bought something in-store.
Almost a third (31%) of consumers made a purchase from a retailer on Cyber Monday this year, up from about a quarter (27%) in 2019. Plus, 21% made at least one online purchase, while 17% made at least one in-store purchase.
Black Friday spending was down while Cyber Monday spending rose
Shoppers spent $135 on Cyber Monday on average this year, compared with $105 on Black Friday. And while Cyber Monday spending increased by about $19 this year, Black Friday spending fell by $8.
| Spending on retail holidays, 2019 vs. 2020 | ||
|---|---|---|
| Black Friday | Cyber Monday | |
| 2019 | $113.36 | $116.49 |
| 2020 | $105.29 | $135.11 |
| Difference | -$8.07 | +$18.62 |
Across different retailers, spending varied year-over-year. Bookstore spending per transaction doubled on Black Friday, from $24 last year to $51 this year. On Cyber Monday, furniture and home decor retailers saw a large leap in average amount spent per transaction, from $98 in 2019 to $168 in 2020. See further details in the breakdown below:
Shoppers spend more money on in-store purchases
Black Friday shoppers spent $20 more on in-store purchases when compared with online transactions. Last year, the gap was $32. Cyber Monday shoppers also spent $20 more in-store than online, widening the gap from $11 in 2019.
The customer experience between shopping in a store and shopping online are different altogether. By shopping in a store, you might be persuaded to purchase a big-ticket item with the help of a sales associate or eye-catching display.
With online shopping, you may have the opportunity to comparison shop across multiple retailers all at once to get a lower price. Considering these factors, it makes sense that consumers spend more money when they shop in-store when compared with shopping online.
Which retailers won (and lost) Black Friday and Cyber Monday 2020
Our data measures the success of retailers during Black Friday and Cyber Monday by comparing their share of transactions to the total number of transactions made. This provides a clear picture of the “share of the market” that some retailers will receive, so to speak. See how the distribution of transactions among retailers changed between 2019 and 2020 in the charts below:
Based on our findings, these are some of the retailers that experienced the largest gains and losses of Black Friday and Cyber Monday transactions between 2019 and 2020:
Digital purchases: Digital purchases took a bigger slice of the pie between 2019 and 2020. On Black Friday, the percentage of transactions in this category increased from 24% to 38%. On Cyber Monday, it increased from 24% to 36%.
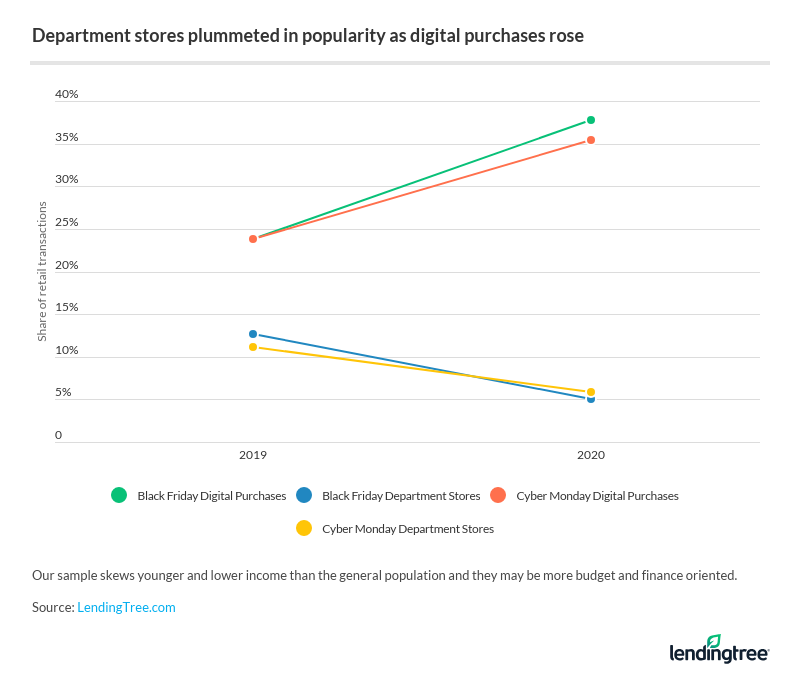
Department stores: Department store transactions are drastically down on both Black Friday (from 13% to 5%) and Cyber Monday (11% to 6%). The portion of Black Friday shoppers who bought something at a department store also fell drastically, from 18% in 2019 to 7% in 2020. In fact, across all metrics, department stores struggled to keep pace with last year.
Computer and electronics stores: Black Friday and Cyber Monday transactions at computer and electronics stores slightly decreased year-over-year. Both dropped about three percentage points from last year to this year.
In addition to the percentage of transactions made, we also analyzed the percentage of Black Friday and Cyber Monday shoppers who made purchases at certain retailers:
Methodology
To compare Black Friday and Cyber Monday spending trends, analysts used the spending transactions of 29,000 anonymized LendingTree users who use the app’s new feature to connect bank accounts, review spending and track spending in real time. We note that users of this feature tend to skew younger, have lower incomes and lower credit scores than the national distribution (both lower incomes and lower credit scores are more common in younger adults).
Typical holiday retailers included in the analysis were defined as adult, antique, arts and crafts, automotive, beauty products, bicycles, bookstores, cards and stationary, children, clothing and accessories, computers and electronics, dance and music, department stores, digital purchases, discount stores, florists, furniture and home decor, gift and novelty, hardware, hobby and collectibles, jewelry and watches, lawn and garden, luggage, marine supplies, music, video and DVD, musical instruments, office supplies, outlet, pawn shops, pets, photos and frames, shopping centers and malls, sporting goods, toys, vintage and thrift, warehouse and wholesale stores. Transaction channels labeled as “other” were excluded from the online versus in-store analyses but were included in all other statistics.
Get personal loan offers from up to 5 lenders in minutes