5.1% of Americans With Auto Loans Are Delinquent; Gen Zers Hit Hardest


Getting a new car can be exciting (even when it’s done out of necessity over anything else), but the financial responsibilities of car ownership can be daunting. And lately, Americans are struggling to make their auto loan payments.
According to a LendingTree study, 5.1% of Americans with auto loans are delinquent on at least one account — and those in Southern states are the biggest offenders.
Here’s what else we found.
- 5.1% of Americans with auto loans are delinquent on at least one account. The rate of consumers with a past-due account as of the first quarter of 2025 varies significantly by state, ranging from 3.2% to 9.8%.
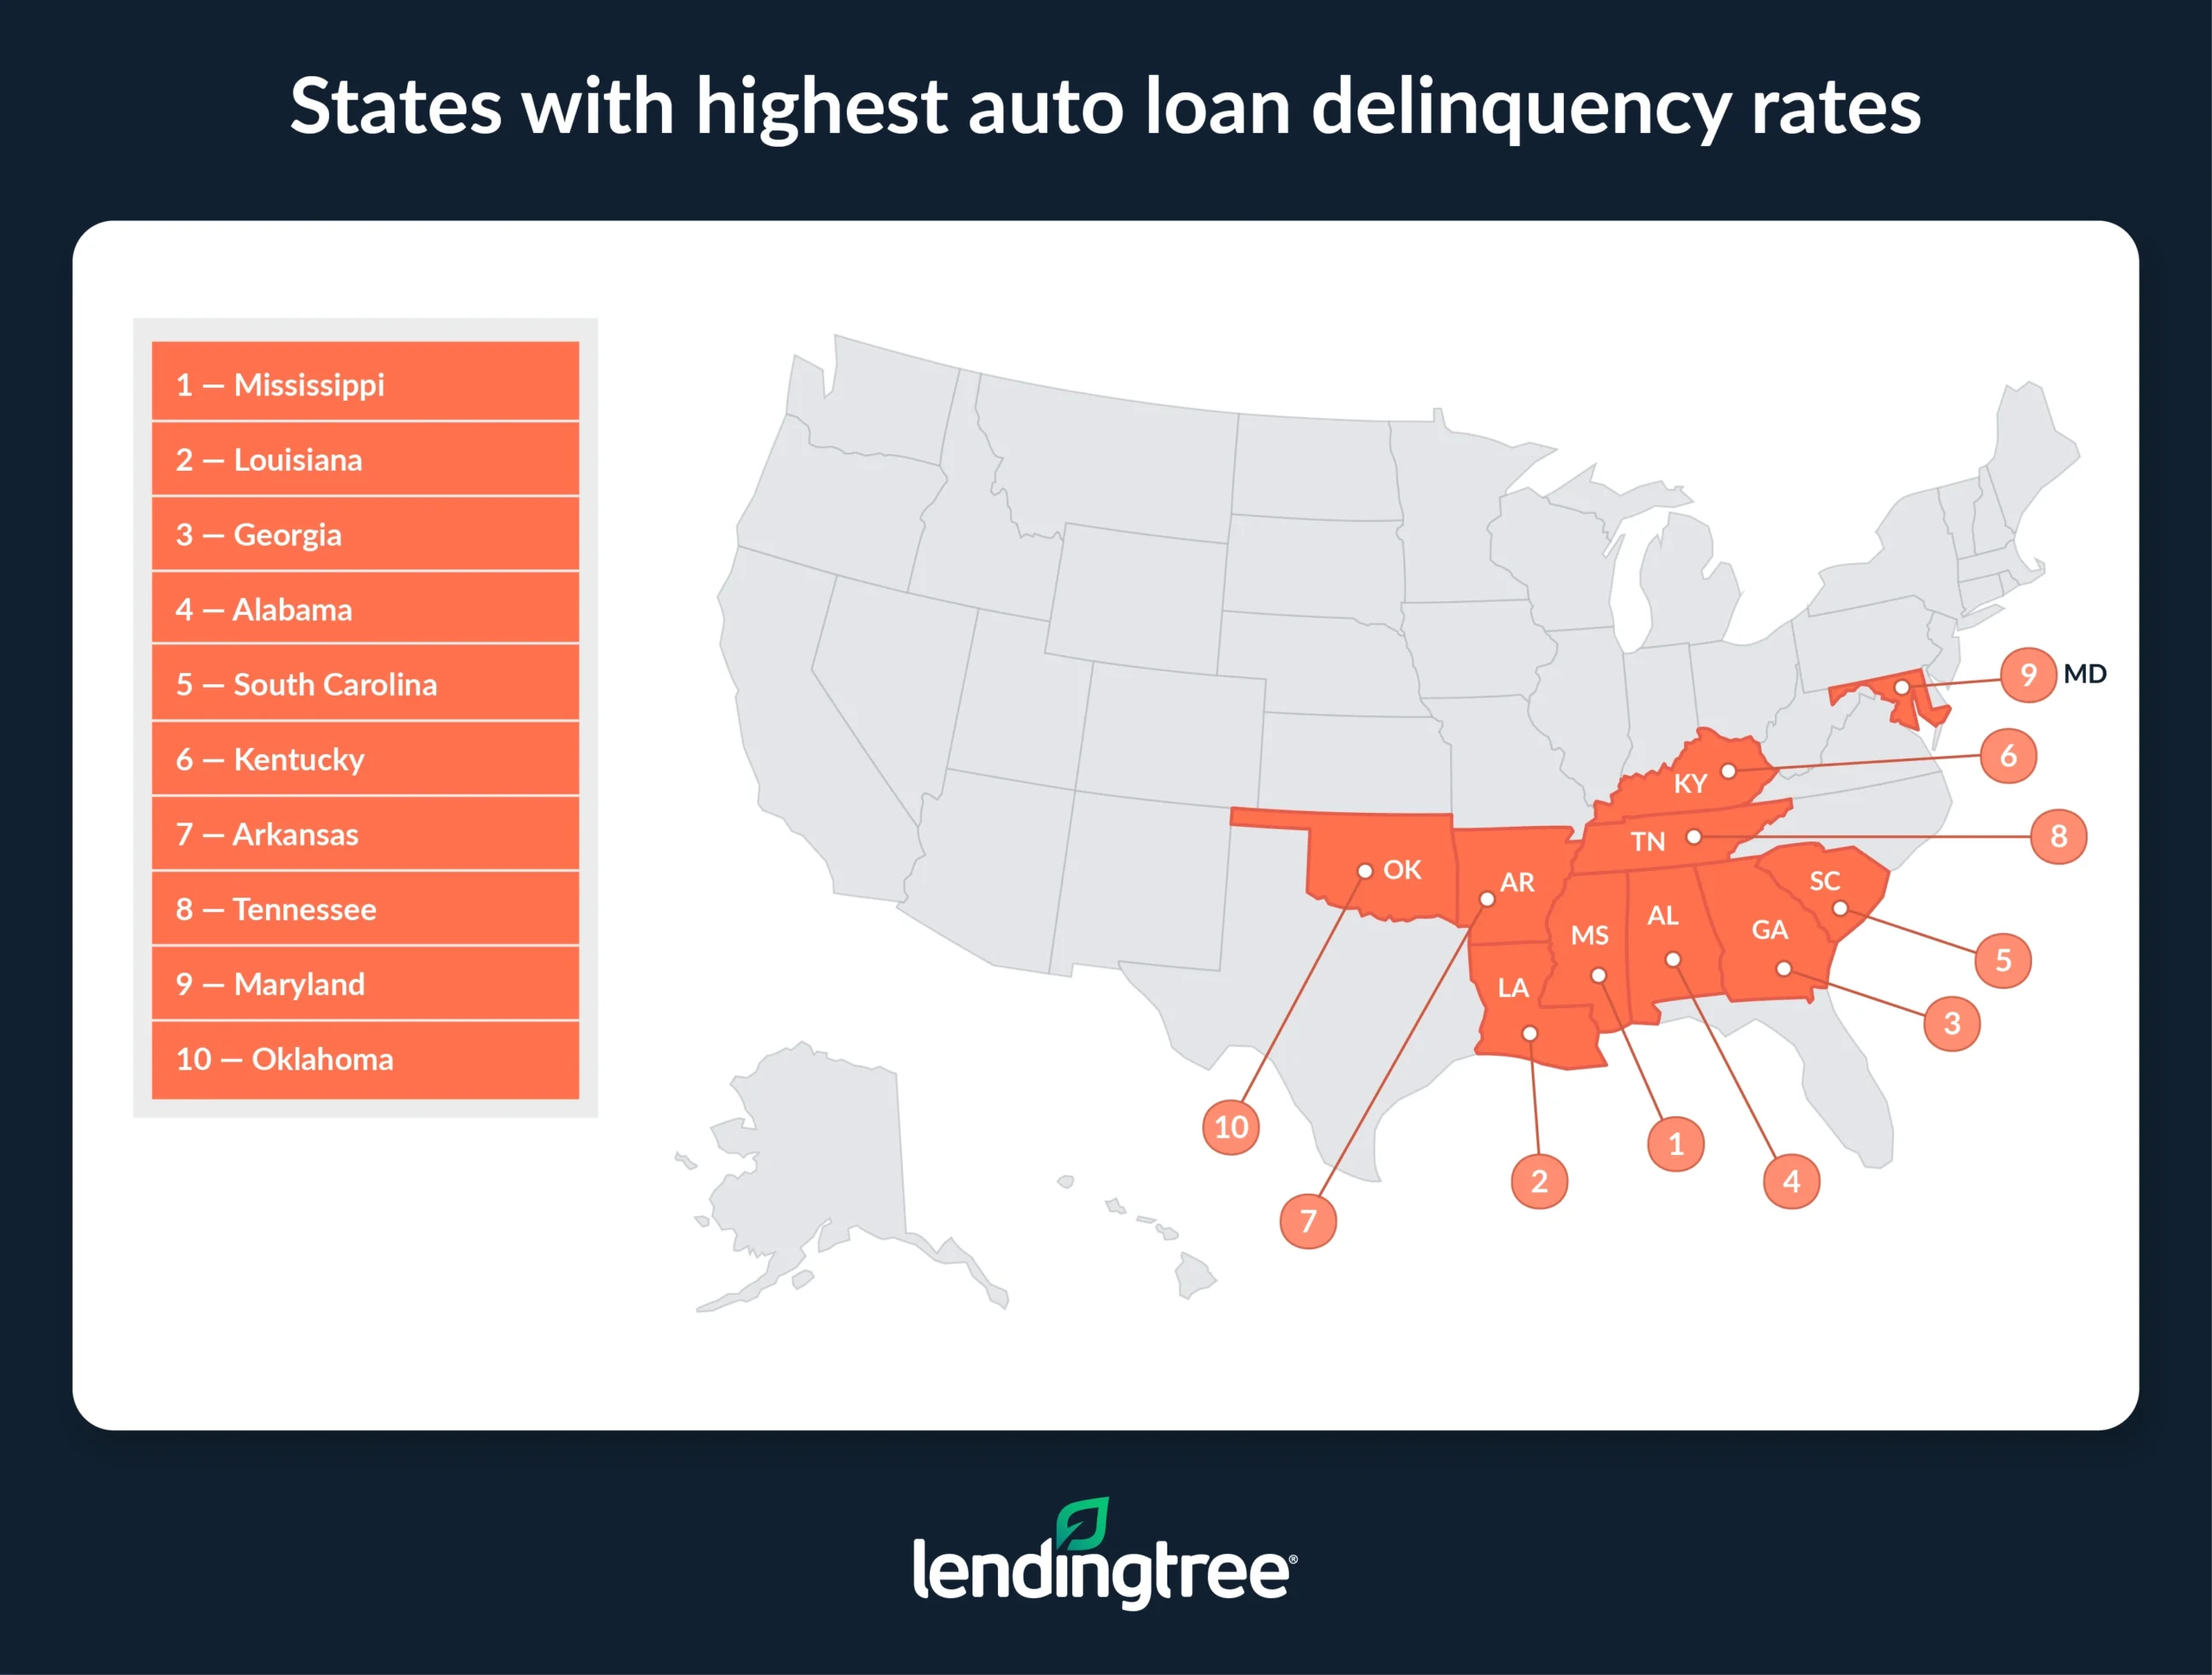
- Southern states have the highest levels of auto loan delinquency. 9.8% of Mississippi auto loan borrowers have at least one delinquent account, ahead of Louisiana (8.4%) and Georgia (7.8%). Southern states occupy the top 14 spots.
- There’s a four-way tie at the bottom of the auto loan delinquency list. Alaska, Utah, Washington and New Hampshire each have 3.2% of auto loan holders with a delinquent account. In fact, the rate is below 5.0% in 28 states.
- Younger generations struggle the most with auto loan payments. Gen Zers with auto loans have the highest delinquency rate at 7.5%, ahead of millennials (6.9%) and Gen Xers (4.3%). Baby boomers have the lowest rate at 1.9%.
- Borrowers in states with higher delinquency rates often face heavier monthly car payment burdens. In Mississippi, Louisiana and Georgia, monthly car payments per person average $802, $821 and $794, respectively — each above the national average of $751. Texas auto loan borrowers, with a delinquency rate of 6.1%, make the highest average monthly payments at $867 — 15.5% above the national average.
5.1% of Americans with auto loans are delinquent
As Americans continue to struggle with high costs and looming tariffs, 5.1% of those with auto loans are delinquent on at least one account as of the first quarter of 2025. By state, that figure ranges from 3.2% to 9.8%.
Matt Schulz — LendingTree chief consumer finance analyst and author of “Ask Questions, Save Money, Make More: How to Take Control of Your Financial Life” — says those numbers are concerning.
“Auto loan payments are almost always a high priority for Americans because the vast majority of us need our vehicles to be able to get to and from work so we can make a living,” he says. “When auto loan delinquencies are rising, it’s a likely sign that people are struggling. That’s no great surprise, given stubborn inflation, high interest rates and general economic uncertainty, but it’s still troubling, especially given that unemployment rates are still relatively low.”
Just how late are those payments? Among consumers with an active auto loan, 2.0% of borrowers were 30 days late on a payment, while 0.9% were 60 days late and another 0.9% were 90 to 120 days late.
Not only are Americans struggling to make their payments on time, but the overall auto loan balance is decreasing, indicating that Americans may be taking out fewer loans or borrowing less when they do. According to the Federal Reserve, the auto loan balances totaled $1.642 trillion in the first quarter of 2025, a 0.8% decrease from the previous quarter. That’s only the second time auto loan balances have dropped between quarters since Q2 2011.
Southern states have the highest auto delinquency rates
Looking closer, the states with the highest rates of auto loan delinquency are all in the South. Mississippi leads, with 9.8% of auto loan borrowers having at least one delinquent account. Louisiana (8.4%) and Georgia (7.8%) follow.
All in all, Southern states occupy all of the top 14 spots.
Generally speaking, Southern states have the lowest average credit scores, which would affect their loan burden. Because of that, they also tend to have above-average monthly payments (more on that below).
Schulz believes income plays a role as well. “Many of the states with the highest delinquency rates are among the lowest income states in the country,” he says. “Lower income often means lower financial margin for error in difficult times, and that’s likely playing a role here.”
By the level of delinquency, early-stage delinquencies (those who are 30 days late on a payment) are most common in Louisiana (3.8%), Mississippi (3.4%) and Tennessee (3.2%). The rate of auto loan borrowers who are 60 days late is highest in Louisiana (1.9%), West Virginia (1.6%) and Tennessee (1.4%). Finally, Louisiana (2.5%), Mississippi (2.3%) and Tennessee (1.7%) have the highest rates of auto loan delinquencies of at least 90 days.
Auto loan delinquency rate is below 5.0% in 28 states
At the bottom of the list, four states tie for the lowest delinquency rate: In Alaska, Utah, Washington and New Hampshire, only 3.2% of consumers with auto loans have a delinquent account.
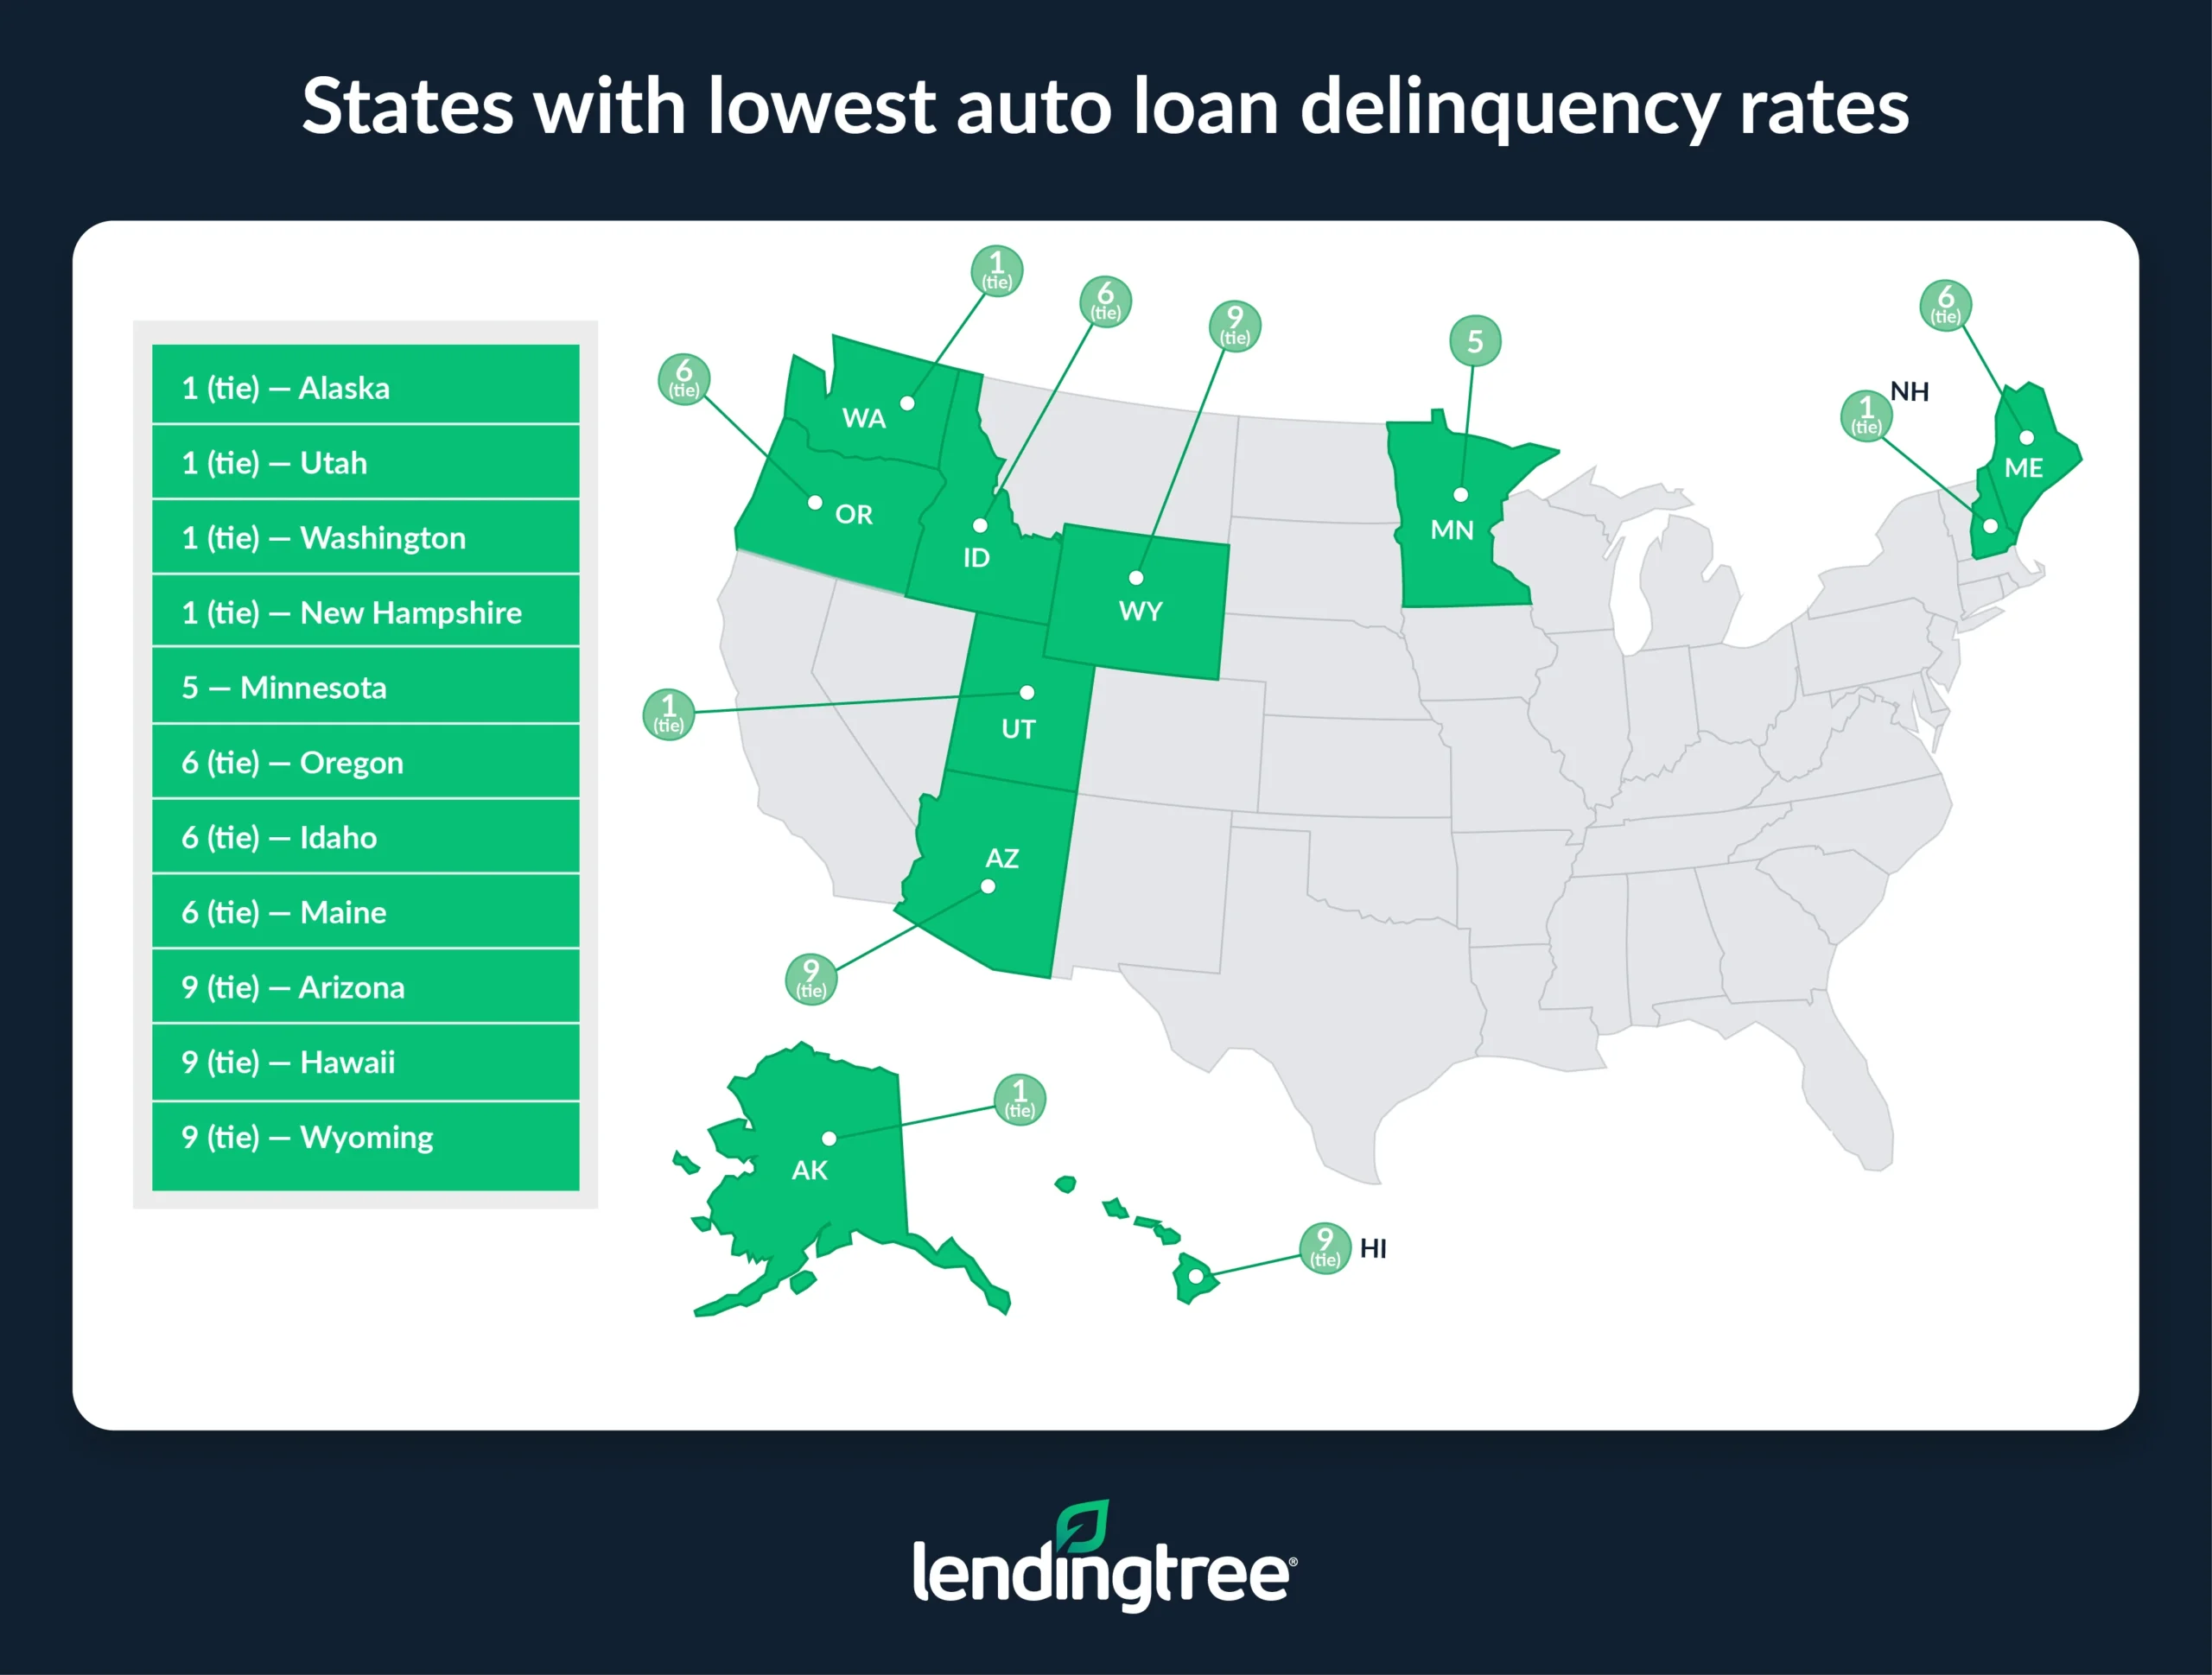
In total, the rate is below 5.0% in 28 states.
By lateness, 30-day late payments are least common in Minnesota (1.1%), Utah (1.2%) and Washington (1.3%). Meanwhile, 60-day late payments are least common in New Hampshire, Wisconsin and Massachusetts, at 0.4% each. Finally, Idaho (0.4%) has the lowest rate of auto loan delinquencies of at least 90 days.
Full rankings: States with highest/lowest auto loan delinquency rates
| Rank | State | % of auto loan borrowers with at least 1 delinquent account |
|---|---|---|
| 1 | Mississippi | 9.8% |
| 2 | Louisiana | 8.4% |
| 3 | Georgia | 7.8% |
| 4 | Alabama | 7.6% |
| 5 | South Carolina | 7.3% |
| 6 | Kentucky | 6.8% |
| 7 | Arkansas | 6.7% |
| 8 | Tennessee | 6.6% |
| 9 | Maryland | 6.4% |
| 10 | Oklahoma | 6.2% |
| 11 | Texas | 6.1% |
| 11 | North Carolina | 6.1% |
| 13 | Delaware | 5.9% |
| 14 | West Virginia | 5.8% |
| 14 | Nevada | 5.8% |
| 16 | New Jersey | 5.7% |
| 16 | Michigan | 5.7% |
| 16 | New Mexico | 5.7% |
| 16 | Ohio | 5.7% |
| 16 | Missouri | 5.7% |
| 21 | Indiana | 5.5% |
| 22 | Pennsylvania | 5.3% |
| 23 | Illinois | 4.8% |
| 23 | Florida | 4.8% |
| 23 | New York | 4.8% |
| 26 | Connecticut | 4.7% |
| 27 | Virginia | 4.5% |
| 27 | Kansas | 4.5% |
| 29 | Montana | 4.4% |
| 29 | Vermont | 4.4% |
| 31 | Nebraska | 4.3% |
| 31 | Iowa | 4.3% |
| 33 | Massachusetts | 4.1% |
| 33 | Wisconsin | 4.1% |
| 33 | North Dakota | 4.1% |
| 33 | Colorado | 4.1% |
| 37 | Rhode Island | 4.0% |
| 38 | South Dakota | 3.8% |
| 39 | California | 3.7% |
| 40 | Wyoming | 3.6% |
| 40 | Hawaii | 3.6% |
| 40 | Arizona | 3.6% |
| 43 | Maine | 3.5% |
| 43 | Idaho | 3.5% |
| 43 | Oregon | 3.5% |
| 46 | Minnesota | 3.4% |
| 47 | New Hampshire | 3.2% |
| 47 | Washington | 3.2% |
| 47 | Utah | 3.2% |
| 47 | Alaska | 3.2% |
Full rankings: States with highest/lowest delinquency rates by days late
| Rank | State | 30 days late | 60 days late | 90+ days late | Unknown |
|---|---|---|---|---|---|
| 1 | Louisiana | 3.8% | 1.9% | 2.5% | 0.3% |
| 2 | Mississippi | 3.4% | 1.2% | 2.3% | 2.9% |
| 3 | Tennessee | 3.2% | 1.4% | 1.7% | 0.3% |
| 4 | Arkansas | 2.9% | 0.9% | 1.6% | 1.3% |
| 5 | South Carolina | 2.8% | 1.2% | 0.8% | 2.4% |
| 6 | New Mexico | 2.7% | 1.2% | 1.0% | 0.8% |
| 7 | Georgia | 2.6% | 1.1% | 1.0% | 3.0% |
| 7 | Oklahoma | 2.6% | 1.1% | 1.0% | 1.4% |
| 7 | Texas | 2.6% | 1.1% | 0.8% | 1.7% |
| 10 | Alabama | 2.4% | 1.3% | 0.9% | 2.9% |
| 10 | Nevada | 2.4% | 0.5% | 0.8% | 2.0% |
| 10 | Pennsylvania | 2.4% | 0.8% | 1.0% | 1.1% |
| 13 | Kentucky | 2.3% | 1.3% | 1.2% | 1.9% |
| 14 | Maryland | 2.2% | 0.7% | 1.2% | 2.3% |
| 14 | Missouri | 2.2% | 1.3% | 1.0% | 1.2% |
| 14 | Ohio | 2.2% | 0.9% | 1.1% | 1.4% |
| 14 | West Virginia | 2.2% | 1.6% | 1.3% | 0.8% |
| 18 | Massachusetts | 2.1% | 0.4% | 0.6% | 1.0% |
| 18 | North Carolina | 2.1% | 1.1% | 0.8% | 2.2% |
| 18 | Rhode Island | 2.1% | 0.6% | 0.6% | 0.6% |
| 21 | Hawaii | 2.0% | 0.5% | 0.5% | 0.6% |
| 21 | Illinois | 2.0% | 0.9% | 0.7% | 1.2% |
| 21 | Kansas | 2.0% | 0.6% | 0.6% | 1.3% |
| 21 | Nebraska | 2.0% | 0.8% | 0.9% | 0.8% |
| 21 | New Jersey | 2.0% | 1.0% | 0.9% | 1.9% |
| 26 | Connecticut | 1.9% | 1.1% | 0.5% | 1.1% |
| 26 | Iowa | 1.9% | 1.0% | 0.7% | 0.8% |
| 26 | Indiana | 1.9% | 1.1% | 1.2% | 1.3% |
| 29 | Delaware | 1.8% | 1.1% | 1.3% | 1.8% |
| 29 | Florida | 1.8% | 0.7% | 0.5% | 1.7% |
| 29 | Maine | 1.8% | 0.5% | 0.7% | 0.6% |
| 29 | Montana | 1.8% | 0.9% | 0.7% | 0.9% |
| 29 | Wisconsin | 1.8% | 0.4% | 1.1% | 0.8% |
| 34 | Alaska | 1.7% | 0.5% | 0.6% | 0.3% |
| 34 | Michigan | 1.7% | 1.0% | 1.5% | 1.6% |
| 34 | South Dakota | 1.7% | 0.7% | 0.6% | 0.8% |
| 37 | California | 1.6% | 0.6% | 0.6% | 1.0% |
| 37 | Colorado | 1.6% | 0.7% | 0.6% | 1.3% |
| 37 | New York | 1.6% | 0.8% | 0.9% | 1.4% |
| 37 | Virginia | 1.6% | 0.9% | 0.8% | 1.2% |
| 37 | Vermont | 1.6% | 0.8% | 1.3% | 0.7% |
| 37 | Wyoming | 1.6% | 0.6% | 0.7% | 0.8% |
| 43 | Arizona | 1.5% | 0.7% | 0.5% | 0.9% |
| 43 | North Dakota | 1.5% | 0.5% | 1.0% | 1.1% |
| 43 | New Hampshire | 1.5% | 0.4% | 0.6% | 0.7% |
| 46 | Idaho | 1.4% | 0.7% | 0.4% | 1.0% |
| 46 | Oregon | 1.4% | 0.5% | 0.5% | 1.0% |
| 48 | Washington | 1.3% | 0.6% | 0.5% | 0.8% |
| 49 | Utah | 1.2% | 0.6% | 0.7% | 0.7% |
| 50 | Minnesota | 1.1% | 0.6% | 0.8% | 0.9% |
Gen Zers have the highest auto loan delinquency rate
Younger generations struggle the most with auto loan payments. Among Gen Zers ages 18 to 28 with auto loans, the delinquency rate is 7.5% — the highest by age group. This is despite the fact that Gen Zers have the lowest monthly payments per person (including those with multiple loans), at an average of $577.
Millennials ages 29 to 44 with auto loans have the next-highest delinquency rate at 6.9% — and the second-highest average monthly payments at $735.
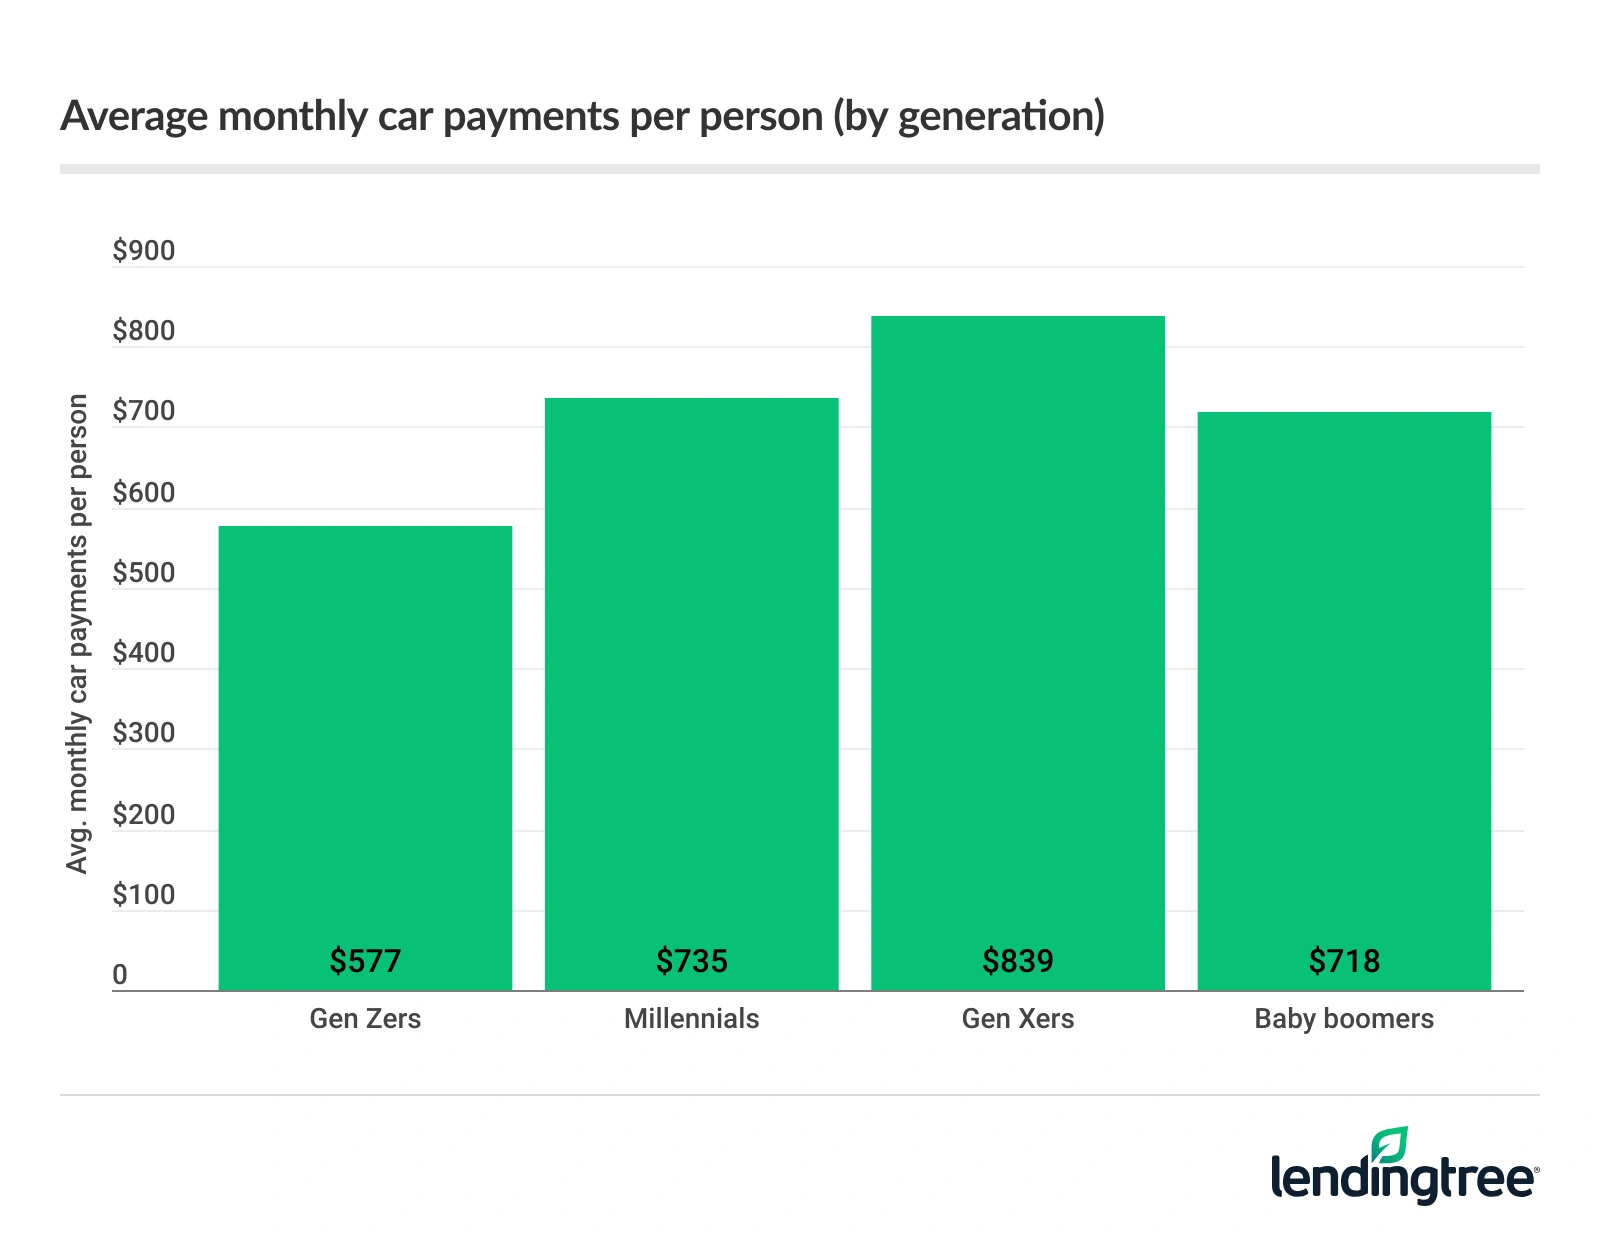
Meanwhile, baby boomers ages 61 to 79 have the lowest delinquency rate at 1.9% and the second-lowest monthly payments at an average of $718. Gen Xers ages 45 to 60 have the second-lowest delinquency rate (4.3%) and the highest monthly payments at $839.
Schulz says it makes sense that younger Americans would struggle the most with auto loan payments despite having lower payments.
“They don’t earn as much as their older counterparts,” he says. “They have less experience managing credit. They tend to have lower credit scores, meaning they’re likely paying higher interest rates. Add it all up and it should be no surprise to see Gen Zers and millennials struggling more than Gen Xers and boomers.”
Delinquency rates can be tied to higher monthly payments
Perhaps unsurprisingly, borrowers in states with higher delinquency rates often face heavier monthly car payment burdens. The national average car payment is $751 per person (including those with multiple loans) — but in the states where delinquency rates are highest, the monthly car payments are higher.
In Mississippi, monthly car payments hover at an average of $802 — and payments climb to $821 and $794 in Louisiana and Georgia, respectively.
Texas borrowers make the highest average monthly payments at $867 per person — 15.5% above the national average. The delinquency rate here among auto loan holders is 6.1%.
Schulz says that’s a big deal, especially because these aren’t typically high-income states.
“When you’re living on a tight budget, every dollar matters,” he says. “Those extra dollars are ones that can’t go toward paying other debts, building an emergency fund or working toward other goals. It just makes a challenging financial situation that much worse.”
In total, borrowers in 19 states pay above the national average. Meanwhile, borrowers in nine states pay at least 10.0% less than the national average, leading with Rhode Island (15.0%), Massachusetts (13.6%) and Oregon and Michigan (12.6% for both).
Full rankings: Where monthly car payments per person are highest/lowest
| Rank | State | Avg. monthly payments | % from avg. |
|---|---|---|---|
| 1 | Texas | $867 | 15.5% |
| 2 | Wyoming | $836 | 11.3% |
| 3 | Louisiana | $821 | 9.3% |
| 4 | Nevada | $811 | 8.0% |
| 5 | Florida | $804 | 7.1% |
| 5 | Alaska | $804 | 7.1% |
| 7 | California | $803 | 6.9% |
| 8 | Mississippi | $802 | 6.8% |
| 8 | Arkansas | $802 | 6.8% |
| 8 | New Mexico | $802 | 6.8% |
| 11 | Georgia | $794 | 5.7% |
| 12 | North Dakota | $789 | 5.1% |
| 13 | Maryland | $783 | 4.3% |
| 14 | Arizona | $779 | 3.7% |
| 15 | West Virginia | $776 | 3.3% |
| 16 | Tennessee | $767 | 2.1% |
| 17 | Alabama | $766 | 2.0% |
| 18 | Montana | $764 | 1.7% |
| 19 | Oklahoma | $763 | 1.6% |
| 20 | Hawaii | $743 | -1.1% |
| 21 | South Carolina | $741 | -1.3% |
| 22 | Washington | $740 | -1.5% |
| 23 | South Dakota | $738 | -1.7% |
| 24 | New York | $736 | -2.0% |
| 25 | North Carolina | $734 | -2.3% |
| 26 | New Jersey | $731 | -2.7% |
| 27 | Colorado | $727 | -3.2% |
| 28 | Virginia | $725 | -3.5% |
| 28 | Kansas | $725 | -3.5% |
| 30 | Utah | $721 | -4.0% |
| 31 | Illinois | $711 | -5.3% |
| 32 | Idaho | $710 | -5.5% |
| 33 | Delaware | $709 | -5.6% |
| 34 | Missouri | $706 | -6.0% |
| 34 | Iowa | $706 | -6.0% |
| 36 | New Hampshire | $703 | -6.4% |
| 37 | Kentucky | $700 | -6.8% |
| 38 | Nebraska | $697 | -7.2% |
| 39 | Connecticut | $695 | -7.5% |
| 40 | Vermont | $688 | -8.4% |
| 41 | Maine | $681 | -9.3% |
| 42 | Pennsylvania | $675 | -10.1% |
| 43 | Indiana | $674 | -10.2% |
| 43 | Ohio | $674 | -10.2% |
| 45 | Minnesota | $673 | -10.4% |
| 46 | Wisconsin | $665 | -11.4% |
| 47 | Michigan | $656 | -12.6% |
| 47 | Oregon | $656 | -12.6% |
| 49 | Massachusetts | $649 | -13.6% |
| 50 | Rhode Island | $638 | -15.0% |
Juggling auto loan payments: Top expert tips
If you’re struggling with auto loan payments, there are a few things you can do. We recommend the following:
- Be ruthless in prioritizing your spending. “The most effective budgets are ones that best represent what matters the most to us,” Schulz says. “Taking the time to track and assess your spending can allow you to see what you’re spending on most. Once you know that, you can decide what needs to be changed. It won’t be fun nor easy, but if you’re able to shake a few extra dollars loose to put toward paying down your debt or building your savings, you’ll be glad you did.”
- Don’t be afraid to seek help. “You don’t have to struggle in silence,” he says. “If you’re not sure you can pay your bills, call your lender and let them know. They may be able to work with you on a temporary hardship program to ease your burden a bit. You could also consider working with an accredited nonprofit credit counselor. They can help you with everything from learning the basics of money management to negotiating with creditors.”
- Explore refinancing options. If your credit has improved since you first took out your auto loan or if interest rates have dropped, refinancing could lower your monthly payments. Even a small reduction in your rate can make a noticeable difference over time. Just be sure to weigh the pros and cons — like fees or extending your loan term — before deciding.
You don’t have to struggle in silence. If you’re not sure you can pay your bills, call your lender and let them know.

Methodology
LendingTree researchers analyzed a sample of about 180,000 anonymized credit reports of LendingTree users from Jan. 1 to March 31, 2025 — the first quarter of 2025.
The analysis focused on users with active auto loan debts, including both individual and joint accounts. For each state, we calculated the following metrics:
- The percentage of consumers with at least one delinquent auto loan account
- The percentage of consumers with at least one account marked as late 30 days, late 60 days or late 90+ days (including 90 and 120 days)
- The average monthly payment per person (including people with multiple loans)
The analysis was conducted at both the national and state levels, as well as by generation. We defined generations based on the following age groups in 2025:
- Generation Z: 18 to 28
- Millennial: 29 to 44
- Generation X: 45 to 60
- Baby boomer: 61 to 79
Get auto loan offers from up to 5 lenders in minutes