Average Consumer Debt Up 3.7%, With Personal Loans, Mortgages Powering Growth
Debt can be a slippery slope, and more Americans are sliding down it. A LendingTree study found that U.S. consumers have increased their average total debt by 3.7% between the third quarters of 2024 and 2025. In fact, all but one state (shout-out to Missouri!) saw an increase in consumers’ average total debt between these periods.
Read on for a closer look at what’s driving these changes, including which types of debt grew the most and which states’ residents saw the biggest increases.
Key findings
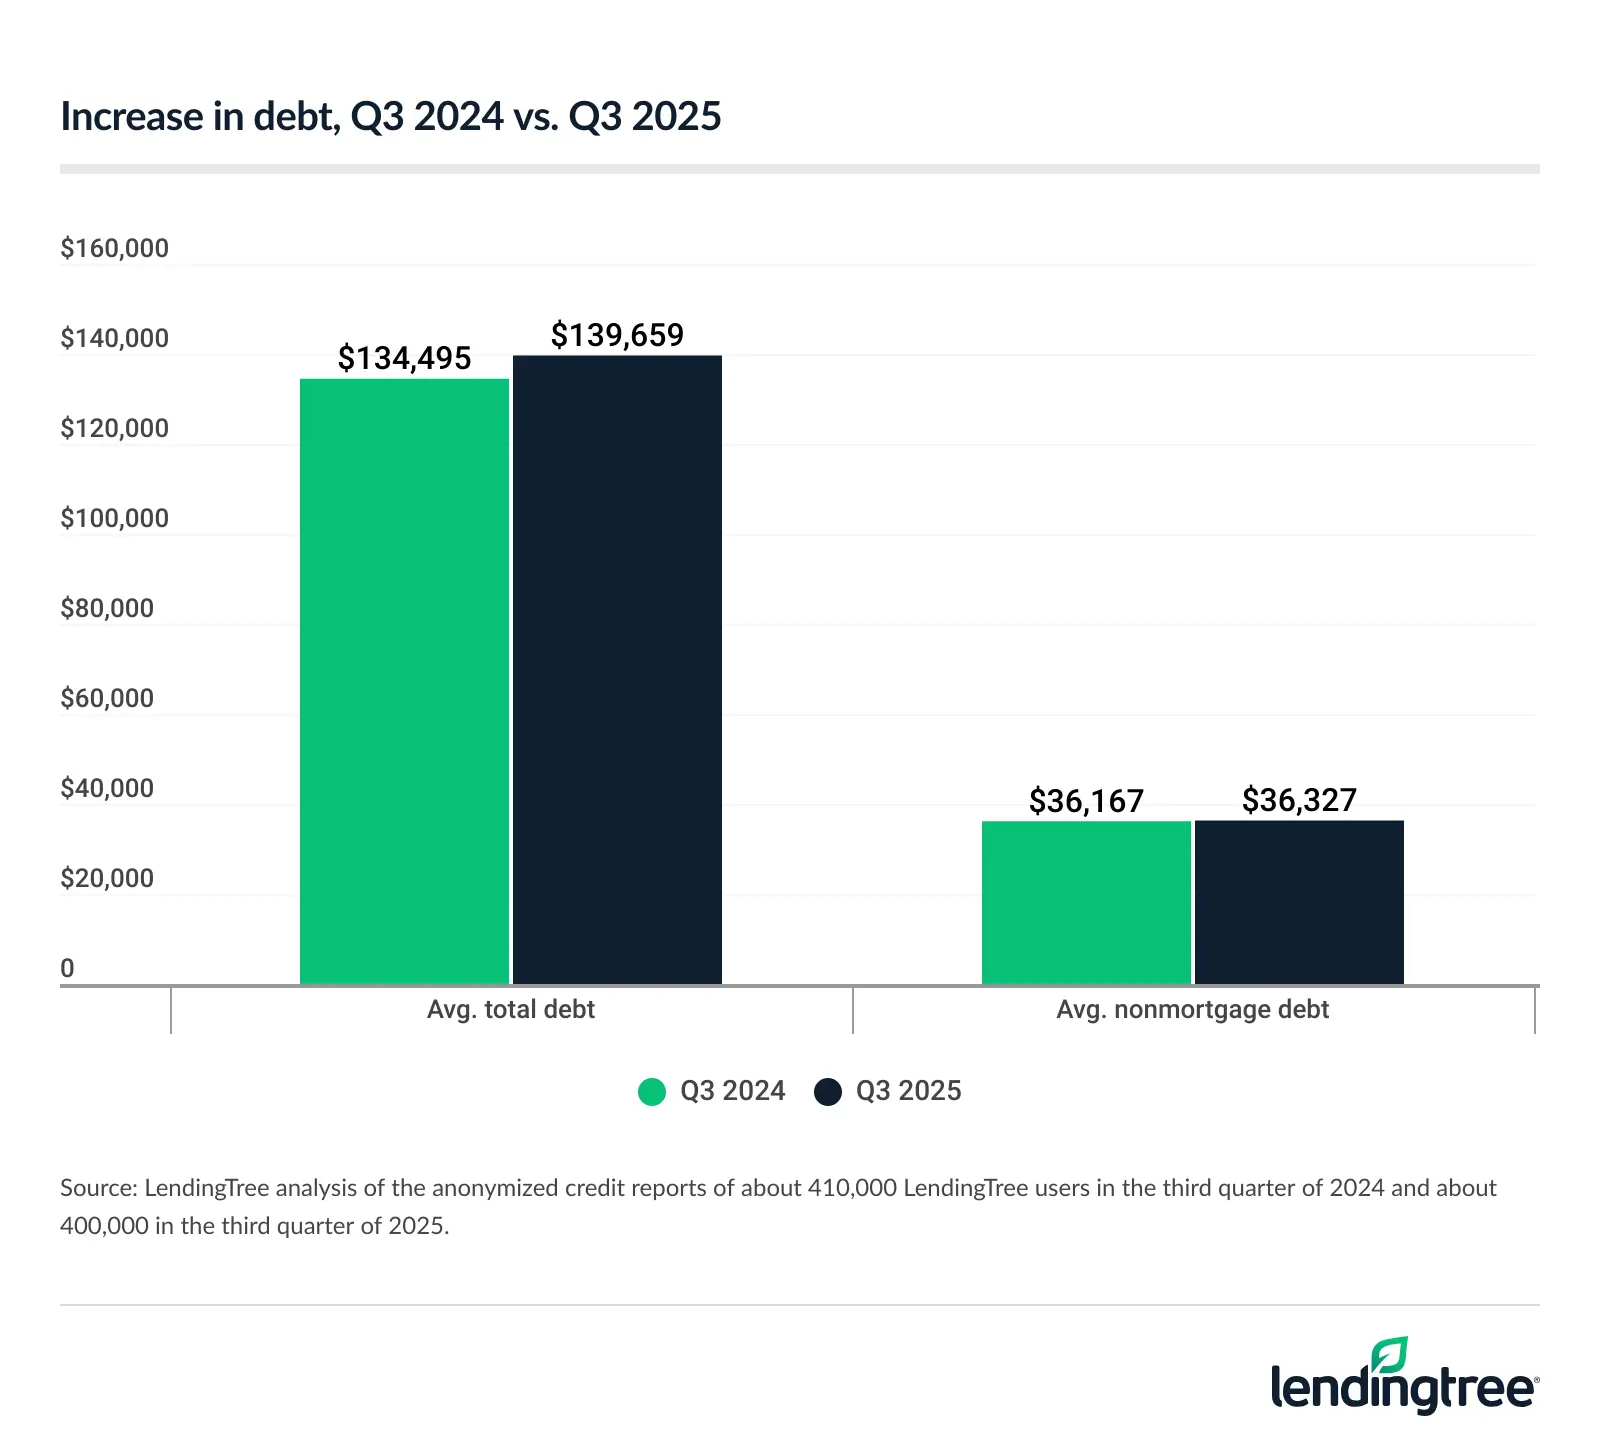
- Consumers’ average total debt rose between the third quarters of 2024 and 2025. Across the 50 states, the average total debt rose by 3.7%, or $5,164, from $134,495 to $139,659. Nonmortgage debt grew more slowly, up 0.4%, or $160, from $36,167 to $36,327.
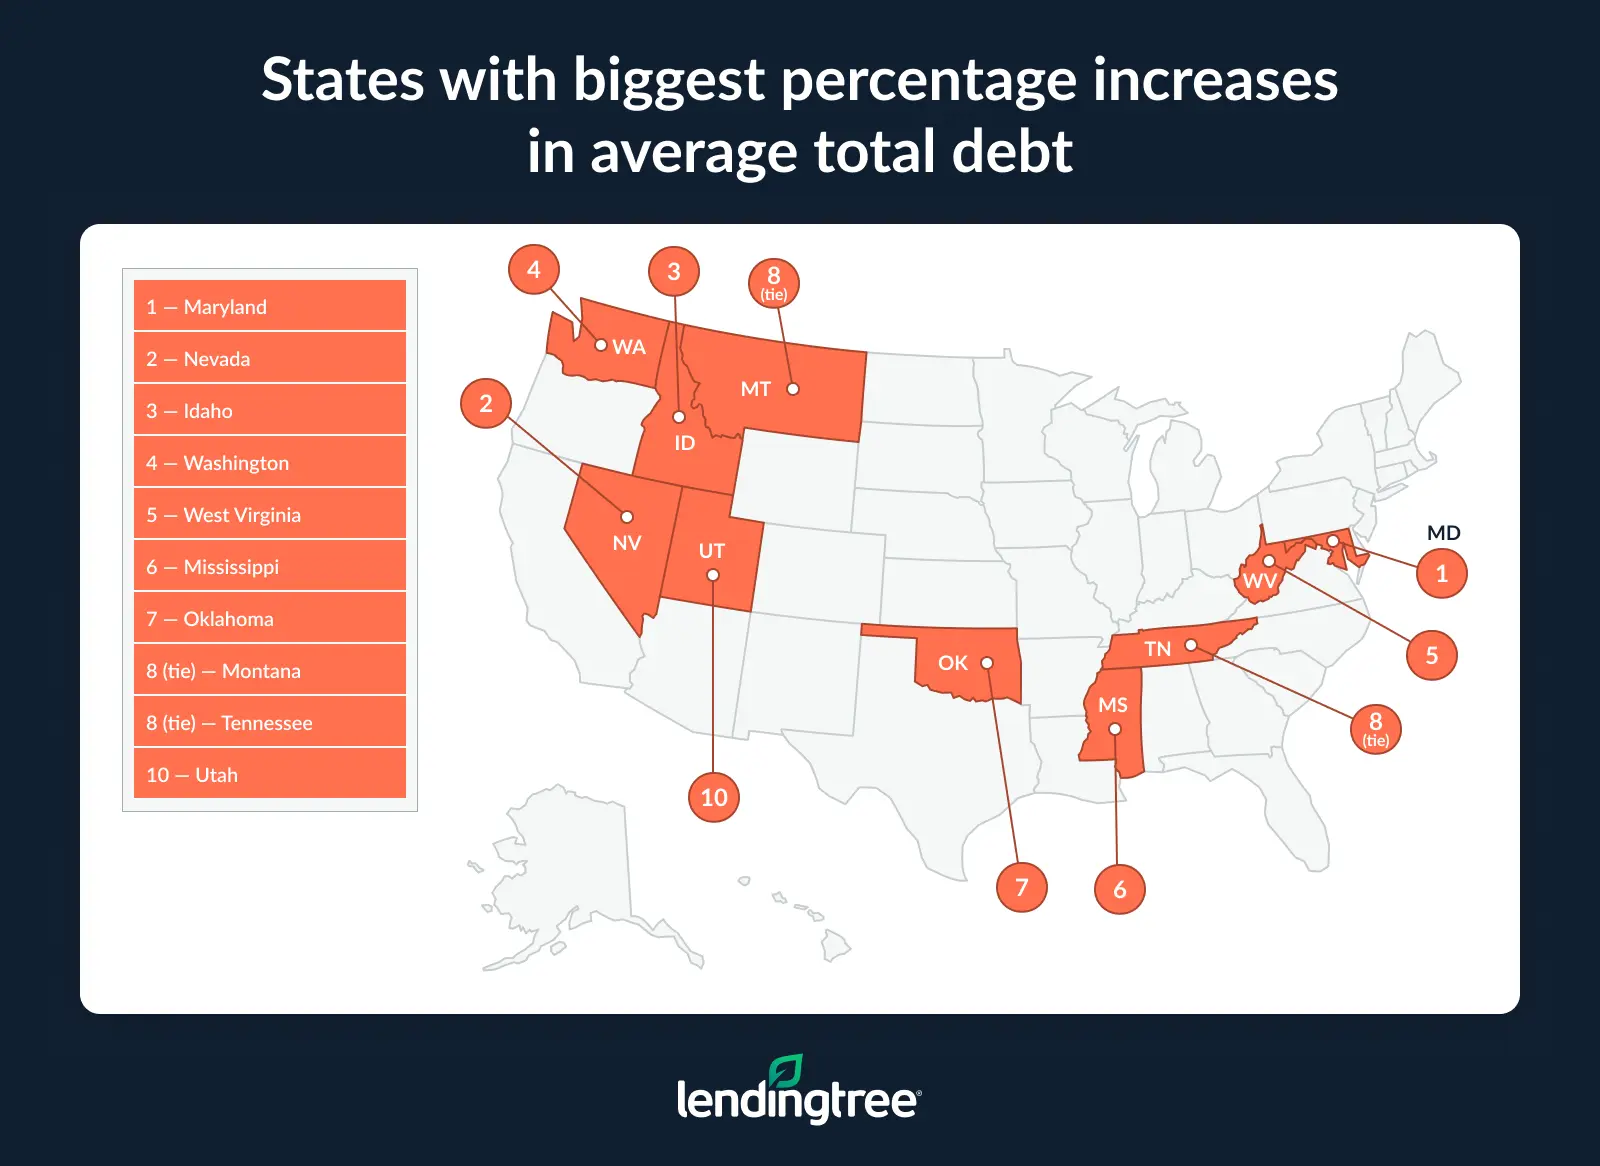
- Average total debt increased in every state but Missouri, where it dipped by 0.3%. Average debt balances between the third quarters of 2024 and 2025 increased the most in Maryland (10.3%), Nevada (9.6%) and Idaho (9.3%). Meanwhile, 28 states saw their average nonmortgage debt increase in this period.
- Trends differed across the six types of debt analyzed. Average personal loan debt grew the most (5.0%), ahead of average mortgage (4.8%), “other” (2.4%) and credit card (2.3%) debt. Average student loan (-1.6%) and auto loan (-0.9%) debt declined slightly.
- The three specific debt types with the strongest growth increased in most states. Average mortgage balances rose in 45 states, while average personal loan and credit card debts rose in 39 states.
Average total debt rises by 3.7%, or $5,164
Across the country, Americans saddled themselves with more debt in the past year. Between the third quarters of 2024 and 2025, consumers’ average total debt climbed 3.7%. Translated into dollars, that’s up $5,164 — from $134,495 in Q3 2024 to $139,659 in Q3 2025.
Looking more closely at the different types of debt, nonmortgage debt barely budged, rising just 0.4%. That’s up $160, from $36,167 in 2024 to $36,327 in 2025.
Why the increase? While times may be tough economically, the reason for consumers’ increased debt isn’t so cut-and-dry, according to Matt Schulz, LendingTree chief consumer finance analyst and author of “Ask Questions, Save Money, Make More: How to Take Control of Your Financial Life.”
“Whenever debt rises in the U.S., it’s partly a sign of struggle and partly a sign of confidence,” he says. “I have no doubt that we’re seeing that today, as some Americans feel great and are happy to spend freely, while others are just doing what they can to make ends meet. Given stubborn inflation, still-high interest rates and a tough job market, I tend to believe that most of the debt growth we’re seeing today is because of people struggling, but there’s never just one reason.”
Average total debt grew in all but 1 state
Missouri was the only state where the average total debt dipped between the third quarters of 2024 and 2025, dropping by 0.3%. Other states were close behind, with total debt increases of less than 0.5% in a number of states, including Wyoming, Maine, California, Delaware and Rhode Island.
Elsewhere, people racked up considerably more debt, with Maryland taking the top spot. There, the average total debt rose 10.3% between the third quarters of 2024 and 2025. Following Maryland with the steepest increases were Nevada (9.6%) and Idaho (9.3%).
Full rankings: Biggest increases/decreases in average total debt
| Rank | State | Avg. total debt, Q3 2024 | Avg. total debt, Q3 2025 | % change |
|---|---|---|---|---|
| 1 | Maryland | $170,251 | $187,750 | 10.3% |
| 2 | Nevada | $149,610 | $163,999 | 9.6% |
| 3 | Idaho | $148,157 | $161,941 | 9.3% |
| 4 | Washington | $191,619 | $208,574 | 8.8% |
| 5 | West Virginia | $92,699 | $100,416 | 8.3% |
| 6 | Mississippi | $83,200 | $89,527 | 7.6% |
| 7 | Oklahoma | $95,379 | $101,836 | 6.8% |
| 8 | Montana | $139,874 | $148,733 | 6.3% |
| 8 | Tennessee | $125,191 | $133,059 | 6.3% |
| 10 | Utah | $176,636 | $187,002 | 5.9% |
| 11 | Indiana | $104,987 | $111,102 | 5.8% |
| 11 | Massachusetts | $178,197 | $188,507 | 5.8% |
| 13 | Ohio | $101,497 | $106,991 | 5.4% |
| 14 | Michigan | $106,521 | $111,985 | 5.1% |
| 14 | New Hampshire | $139,173 | $146,271 | 5.1% |
| 16 | Arizona | $154,941 | $162,389 | 4.8% |
| 16 | Hawaii | $197,195 | $206,741 | 4.8% |
| 16 | Texas | $138,506 | $145,111 | 4.8% |
| 19 | North Dakota | $114,330 | $119,742 | 4.7% |
| 20 | New Jersey | $152,955 | $159,846 | 4.5% |
| 21 | North Carolina | $132,126 | $137,806 | 4.3% |
| 22 | Arkansas | $94,675 | $98,538 | 4.1% |
| 22 | Florida | $144,672 | $150,629 | 4.1% |
| 24 | Minnesota | $140,477 | $145,922 | 3.9% |
| 24 | Nebraska | $111,693 | $116,035 | 3.9% |
| 26 | South Carolina | $124,590 | $128,626 | 3.2% |
| 26 | Colorado | $195,523 | $201,875 | 3.2% |
| 26 | Oregon | $155,335 | $160,248 | 3.2% |
| 29 | Kentucky | $97,262 | $100,173 | 3.0% |
| 30 | Connecticut | $155,370 | $159,689 | 2.8% |
| 31 | South Dakota | $123,592 | $126,980 | 2.7% |
| 31 | Louisiana | $108,137 | $111,041 | 2.7% |
| 33 | New York | $137,852 | $140,879 | 2.2% |
| 34 | Virginia | $168,535 | $172,012 | 2.1% |
| 34 | Vermont | $122,985 | $125,512 | 2.1% |
| 36 | Iowa | $107,391 | $109,482 | 1.9% |
| 37 | Pennsylvania | $113,523 | $115,530 | 1.8% |
| 38 | Wisconsin | $108,810 | $110,661 | 1.7% |
| 39 | Illinois | $125,935 | $127,568 | 1.3% |
| 40 | Alabama | $104,629 | $105,768 | 1.1% |
| 41 | Georgia | $139,443 | $140,846 | 1.0% |
| 42 | Alaska | $156,938 | $158,224 | 0.8% |
| 42 | Kansas | $107,902 | $108,732 | 0.8% |
| 44 | New Mexico | $120,788 | $121,405 | 0.5% |
| 45 | Rhode Island | $135,849 | $136,406 | 0.4% |
| 46 | Delaware | $138,224 | $138,693 | 0.3% |
| 47 | California | $219,883 | $220,400 | 0.2% |
| 47 | Maine | $121,607 | $121,886 | 0.2% |
| 49 | Wyoming | $143,023 | $143,150 | 0.1% |
| 50 | Missouri | $107,045 | $106,691 | -0.3% |
As for nonmortgage debt specifically, Nebraska saw the biggest decrease. In the Cornhusker State, nonmortgage debt decreased by 5.4%. Iowa and New Mexico followed with 4.5% and 3.4% decreases, respectively.
Meanwhile, the biggest increase in nonmortgage debt was in West Virginia (5.4%). New Hampshire and Nevada followed with 5.2% and 4.1% increases, respectively.
Full rankings: Biggest increases/decreases in average nonmortgage debt
| Rank | State | Avg. nonmortgage debt, Q3 2024 | Avg. nonmortgage debt, Q3 2025 | % change |
|---|---|---|---|---|
| 1 | West Virginia | $36,866 | $38,850 | 5.4% |
| 2 | New Hampshire | $35,434 | $37,264 | 5.2% |
| 3 | Nevada | $36,388 | $37,867 | 4.1% |
| 4 | Minnesota | $33,621 | $34,962 | 4.0% |
| 5 | Washington | $33,019 | $34,318 | 3.9% |
| 6 | Hawaii | $34,510 | $35,831 | 3.8% |
| 7 | Vermont | $35,691 | $37,005 | 3.7% |
| 8 | Indiana | $33,039 | $34,182 | 3.5% |
| 9 | Wyoming | $35,452 | $36,560 | 3.1% |
| 10 | Idaho | $33,297 | $34,252 | 2.9% |
| 11 | Maryland | $40,819 | $41,806 | 2.4% |
| 12 | Colorado | $36,944 | $37,808 | 2.3% |
| 13 | Massachusetts | $33,788 | $34,548 | 2.2% |
| 14 | Oklahoma | $34,989 | $35,634 | 1.8% |
| 15 | New York | $34,665 | $35,252 | 1.7% |
| 16 | Maine | $34,787 | $35,355 | 1.6% |
| 16 | Rhode Island | $32,349 | $32,862 | 1.6% |
| 18 | Ohio | $34,199 | $34,672 | 1.4% |
| 18 | Tennessee | $36,146 | $36,659 | 1.4% |
| 20 | Mississippi | $38,459 | $38,946 | 1.3% |
| 21 | Delaware | $36,839 | $37,275 | 1.2% |
| 21 | Wisconsin | $31,475 | $31,850 | 1.2% |
| 23 | Connecticut | $36,348 | $36,612 | 0.7% |
| 24 | Illinois | $35,383 | $35,533 | 0.4% |
| 24 | Virginia | $37,574 | $37,723 | 0.4% |
| 26 | California | $35,855 | $35,975 | 0.3% |
| 27 | Montana | $35,992 | $36,025 | 0.1% |
| 27 | Utah | $33,533 | $33,554 | 0.1% |
| 29 | Florida | $40,367 | $40,387 | 0.0% |
| 29 | Texas | $43,509 | $43,509 | 0.0% |
| 31 | North Carolina | $37,265 | $37,123 | -0.4% |
| 31 | Oregon | $33,574 | $33,444 | -0.4% |
| 33 | North Dakota | $38,911 | $38,695 | -0.6% |
| 34 | Georgia | $42,748 | $42,306 | -1.0% |
| 34 | Kansas | $34,179 | $33,853 | -1.0% |
| 34 | Missouri | $33,684 | $33,331 | -1.0% |
| 37 | Alabama | $37,299 | $36,825 | -1.3% |
| 38 | Arizona | $36,809 | $36,302 | -1.4% |
| 38 | Michigan | $34,542 | $34,043 | -1.4% |
| 38 | South Dakota | $37,621 | $37,076 | -1.4% |
| 41 | Alaska | $39,445 | $38,763 | -1.7% |
| 42 | Pennsylvania | $36,245 | $35,596 | -1.8% |
| 43 | Kentucky | $32,686 | $32,051 | -1.9% |
| 43 | South Carolina | $38,516 | $37,774 | -1.9% |
| 45 | New Jersey | $37,233 | $36,494 | -2.0% |
| 46 | Arkansas | $37,025 | $36,189 | -2.3% |
| 47 | Louisiana | $39,854 | $38,781 | -2.7% |
| 48 | New Mexico | $39,906 | $38,560 | -3.4% |
| 49 | Iowa | $33,963 | $32,425 | -4.5% |
| 50 | Nebraska | $35,531 | $33,626 | -5.4% |
Average personal loan debt grew the most
When we looked at six categories of debt, average personal loan balances rose the most, increasing 5.0% year over year.
That was followed by average mortgage (4.8%) debt, “other” types of debt (2.4%) and credit card debt (2.3%).
Student loan and auto loan debt moved in the opposite direction, dipping 1.6% and 0.9%, respectively.
Why such a big jump in personal loan debt? Schulz says, in part, it’s because it’s easier to show rapid percentage growth when you start with a small total.
“While there’s a lot of personal loan debt in the U.S., the dollar values are typically far lower than for auto loans, student loans, credit cards and (definitely) mortgages,” he said. “Because of that, the $208 change from year to year added up to 5.0% growth. Compare that to $174 amounting to just a 2.3% rise in credit card debt, and even a $5,005 bump in mortgage debt adding up to just a 4.8% increase.”
Changes by debt type
| Type of debt | Avg. debt, Q3 2024 | Avg. debt, Q3 2025 | % change | $ change |
|---|---|---|---|---|
| Personal loans | $3,920 | $4,128 | 5.0% | $208 |
| Mortgages | $98,327 | $103,332 | 4.8% | $5,005 |
| Other | $1,900 | $1,947 | 2.4% | $47 |
| Credit cards | $7,349 | $7,523 | 2.3% | $174 |
| Auto loans | $12,359 | $12,254 | -0.9% | -$105 |
| Student loans | $10,639 | $10,475 | -1.6% | -$164 |
| Nonmortgage | $36,167 | $36,327 | 0.4% | $160 |
| Total | $134,495 | $139,659 | 3.7% | $5,164 |
Average mortgage debt grew in 45 states
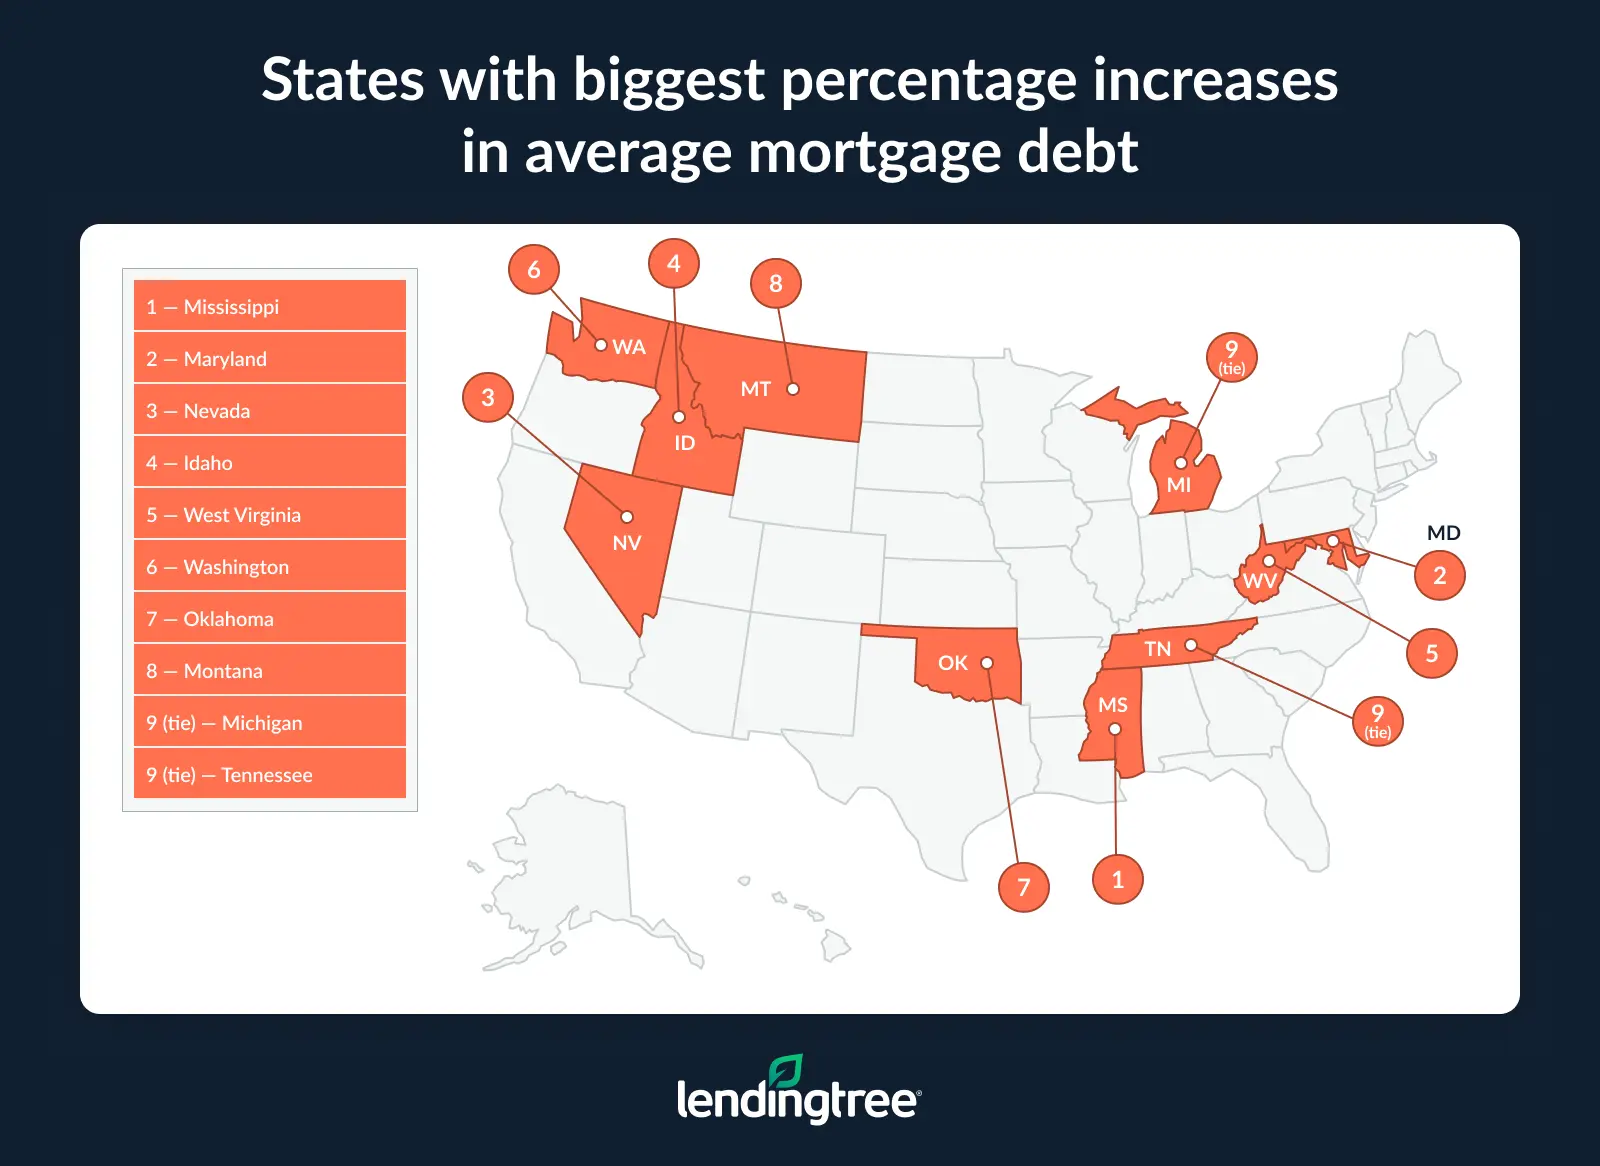
Mortgage debt grew in all but five states between the third quarters of 2024 and 2025. Mississippi saw the biggest increase (13.1%), with the average mortgage debt climbing to $50,581 in Q3 2025 from $44,742 in Q3 2024. The Magnolia State was followed by Maryland (12.8%) and Nevada (11.4%).
Full rankings: Biggest increases/decreases in average mortgage debt
| Rank | State | Avg. mortgage debt, Q3 2024 | Avg. mortgage debt, Q3 2025 | % change |
|---|---|---|---|---|
| 1 | Mississippi | $44,742 | $50,581 | 13.1% |
| 2 | Maryland | $129,432 | $145,944 | 12.8% |
| 3 | Nevada | $113,222 | $126,132 | 11.4% |
| 4 | Idaho | $114,861 | $127,689 | 11.2% |
| 5 | West Virginia | $55,832 | $61,566 | 10.3% |
| 6 | Washington | $158,599 | $174,256 | 9.9% |
| 7 | Oklahoma | $60,391 | $66,202 | 9.6% |
| 8 | Montana | $103,882 | $112,708 | 8.5% |
| 9 | Michigan | $71,979 | $77,942 | 8.3% |
| 9 | Tennessee | $89,045 | $96,400 | 8.3% |
| 11 | Arkansas | $57,650 | $62,349 | 8.2% |
| 11 | Nebraska | $76,162 | $82,408 | 8.2% |
| 13 | North Dakota | $75,419 | $81,046 | 7.5% |
| 13 | Ohio | $67,298 | $72,319 | 7.5% |
| 15 | Utah | $143,102 | $153,449 | 7.2% |
| 16 | Texas | $94,997 | $101,601 | 7.0% |
| 17 | Indiana | $71,948 | $76,920 | 6.9% |
| 18 | Arizona | $118,132 | $126,087 | 6.7% |
| 19 | Massachusetts | $144,409 | $153,960 | 6.6% |
| 19 | New Jersey | $115,722 | $123,352 | 6.6% |
| 21 | North Carolina | $94,862 | $100,683 | 6.1% |
| 22 | Louisiana | $68,283 | $72,260 | 5.8% |
| 23 | Florida | $104,304 | $110,243 | 5.7% |
| 24 | South Carolina | $86,074 | $90,852 | 5.6% |
| 25 | Kentucky | $64,577 | $68,122 | 5.5% |
| 26 | Hawaii | $162,684 | $170,909 | 5.1% |
| 26 | New Hampshire | $103,740 | $109,007 | 5.1% |
| 28 | Iowa | $73,428 | $77,058 | 4.9% |
| 29 | South Dakota | $85,971 | $89,904 | 4.6% |
| 30 | Oregon | $121,762 | $126,804 | 4.1% |
| 31 | Minnesota | $106,857 | $110,960 | 3.8% |
| 32 | Colorado | $158,578 | $164,067 | 3.5% |
| 33 | Connecticut | $119,023 | $123,077 | 3.4% |
| 33 | Pennsylvania | $77,278 | $79,934 | 3.4% |
| 35 | Virginia | $130,962 | $134,289 | 2.5% |
| 36 | New Mexico | $80,882 | $82,846 | 2.4% |
| 36 | Alabama | $67,330 | $68,943 | 2.4% |
| 36 | New York | $103,187 | $105,627 | 2.4% |
| 39 | Georgia | $96,695 | $98,540 | 1.9% |
| 39 | Wisconsin | $77,336 | $78,811 | 1.9% |
| 41 | Alaska | $117,493 | $119,461 | 1.7% |
| 42 | Illinois | $90,551 | $92,035 | 1.6% |
| 42 | Kansas | $73,723 | $74,879 | 1.6% |
| 44 | Vermont | $87,294 | $88,507 | 1.4% |
| 45 | California | $184,028 | $184,425 | 0.2% |
| 46 | Delaware | $101,384 | $101,418 | 0.0% |
| 46 | Missouri | $73,361 | $73,360 | 0.0% |
| 46 | Rhode Island | $103,501 | $103,543 | 0.0% |
| 49 | Maine | $86,820 | $86,532 | -0.3% |
| 50 | Wyoming | $107,572 | $106,590 | -0.9% |
Credit card debt increased the most in Washington (9.0%), with the average balance rising to $9,077 in Q3 2025, up from $8,329 in Q3 2024. It was followed by South Dakota (8.8%) and Nebraska (8.2%).
Full rankings: Biggest increases/decreases in average credit card debt
| Rank | State | Avg. credit card debt, Q3 2024 | Avg. credit card debt, Q3 2025 | % change |
|---|---|---|---|---|
| 1 | Washington | $8,329 | $9,077 | 9.0% |
| 2 | South Dakota | $6,678 | $7,266 | 8.8% |
| 3 | Nebraska | $6,591 | $7,130 | 8.2% |
| 4 | Wisconsin | $6,252 | $6,749 | 7.9% |
| 4 | Maryland | $8,956 | $9,660 | 7.9% |
| 6 | Michigan | $6,451 | $6,847 | 6.1% |
| 6 | New Jersey | $9,210 | $9,768 | 6.1% |
| 8 | Hawaii | $8,963 | $9,501 | 6.0% |
| 9 | Idaho | $6,936 | $7,329 | 5.7% |
| 10 | Massachusetts | $8,792 | $9,260 | 5.3% |
| 10 | Minnesota | $7,006 | $7,380 | 5.3% |
| 10 | Oregon | $7,391 | $7,780 | 5.3% |
| 13 | Illinois | $7,974 | $8,341 | 4.6% |
| 14 | New Hampshire | $8,369 | $8,726 | 4.3% |
| 15 | Arizona | $8,007 | $8,347 | 4.2% |
| 16 | Colorado | $8,608 | $8,950 | 4.0% |
| 17 | Connecticut | $9,448 | $9,805 | 3.8% |
| 18 | Maine | $7,188 | $7,449 | 3.6% |
| 19 | Missouri | $6,236 | $6,457 | 3.5% |
| 20 | North Carolina | $7,089 | $7,329 | 3.4% |
| 21 | Iowa | $6,277 | $6,449 | 2.7% |
| 22 | New York | $8,895 | $9,105 | 2.4% |
| 23 | Montana | $7,289 | $7,447 | 2.2% |
| 23 | Ohio | $6,427 | $6,567 | 2.2% |
| 25 | North Dakota | $6,616 | $6,753 | 2.1% |
| 26 | Virginia | $8,278 | $8,440 | 2.0% |
| 27 | Utah | $7,548 | $7,695 | 1.9% |
| 28 | Indiana | $6,007 | $6,116 | 1.8% |
| 29 | Nevada | $8,278 | $8,399 | 1.5% |
| 30 | California | $9,305 | $9,423 | 1.3% |
| 31 | Pennsylvania | $7,143 | $7,228 | 1.2% |
| 32 | Tennessee | $5,838 | $5,899 | 1.0% |
| 32 | Vermont | $7,626 | $7,702 | 1.0% |
| 34 | Delaware | $7,748 | $7,814 | 0.9% |
| 34 | Georgia | $8,033 | $8,107 | 0.9% |
| 36 | Alabama | $5,867 | $5,909 | 0.7% |
| 37 | Kentucky | $5,391 | $5,403 | 0.2% |
| 38 | Alaska | $9,331 | $9,340 | 0.1% |
| 38 | Kansas | $7,016 | $7,021 | 0.1% |
| 40 | Florida | $9,224 | $9,212 | -0.1% |
| 40 | South Carolina | $6,728 | $6,723 | -0.1% |
| 42 | Texas | $8,435 | $8,421 | -0.2% |
| 43 | Rhode Island | $8,185 | $8,090 | -1.2% |
| 44 | Mississippi | $4,988 | $4,915 | -1.5% |
| 45 | Wyoming | $7,029 | $6,887 | -2.0% |
| 46 | Arkansas | $5,404 | $5,291 | -2.1% |
| 47 | Louisiana | $5,610 | $5,469 | -2.5% |
| 48 | Oklahoma | $6,157 | $5,987 | -2.8% |
| 49 | West Virginia | $5,609 | $5,273 | -6.0% |
| 50 | New Mexico | $6,676 | $5,916 | -11.4% |
When it came to personal loan debt, the biggest spike was in West Virginia, where the average balance jumped by 32.4%, from $3,994 in Q3 2024 to $5,290 in Q3 2025. Indiana and Kansas followed with 19.7% and 19.1% increases, respectively.
Full rankings: Biggest increases/decreases in average personal loan debt
| Rank | State | Avg. personal loan debt, Q3 2024 | Avg. personal loan debt, Q3 2025 | % change |
|---|---|---|---|---|
| 1 | West Virginia | $3,994 | $5,290 | 32.4% |
| 2 | Indiana | $3,331 | $3,988 | 19.7% |
| 3 | Kansas | $3,010 | $3,584 | 19.1% |
| 4 | Montana | $4,090 | $4,860 | 18.8% |
| 5 | New Mexico | $4,678 | $5,523 | 18.1% |
| 6 | Utah | $3,212 | $3,689 | 14.9% |
| 7 | Washington | $3,618 | $4,128 | 14.1% |
| 8 | Missouri | $3,219 | $3,670 | 14.0% |
| 9 | Nebraska | $3,351 | $3,765 | 12.4% |
| 10 | Tennessee | $4,486 | $5,023 | 12.0% |
| 11 | Alaska | $3,999 | $4,473 | 11.9% |
| 12 | Kentucky | $3,538 | $3,890 | 9.9% |
| 12 | Rhode Island | $3,588 | $3,944 | 9.9% |
| 14 | South Carolina | $3,838 | $4,196 | 9.3% |
| 15 | Idaho | $3,629 | $3,962 | 9.2% |
| 16 | Massachusetts | $3,066 | $3,340 | 8.9% |
| 16 | Iowa | $3,583 | $3,901 | 8.9% |
| 18 | Ohio | $3,164 | $3,436 | 8.6% |
| 19 | Hawaii | $4,698 | $5,098 | 8.5% |
| 20 | Florida | $3,844 | $4,163 | 8.3% |
| 21 | Virginia | $4,052 | $4,358 | 7.6% |
| 22 | New Hampshire | $3,897 | $4,148 | 6.4% |
| 23 | Wyoming | $4,542 | $4,827 | 6.3% |
| 24 | Illinois | $3,309 | $3,510 | 6.1% |
| 25 | North Carolina | $4,179 | $4,411 | 5.6% |
| 26 | Nevada | $4,113 | $4,289 | 4.3% |
| 27 | California | $3,773 | $3,933 | 4.2% |
| 28 | Mississippi | $4,447 | $4,631 | 4.1% |
| 29 | Texas | $4,660 | $4,835 | 3.8% |
| 30 | Arizona | $4,063 | $4,212 | 3.7% |
| 31 | Oklahoma | $3,972 | $4,060 | 2.2% |
| 32 | New York | $3,437 | $3,508 | 2.1% |
| 32 | Louisiana | $5,169 | $5,275 | 2.1% |
| 34 | Pennsylvania | $3,763 | $3,825 | 1.6% |
| 34 | Wisconsin | $3,395 | $3,450 | 1.6% |
| 36 | Colorado | $4,162 | $4,223 | 1.5% |
| 37 | Alabama | $4,055 | $4,108 | 1.3% |
| 38 | Georgia | $3,857 | $3,889 | 0.8% |
| 39 | Maryland | $4,269 | $4,293 | 0.6% |
| 40 | Oregon | $3,397 | $3,363 | -1.0% |
| 41 | Arkansas | $4,318 | $4,204 | -2.6% |
| 42 | Minnesota | $4,628 | $4,480 | -3.2% |
| 43 | North Dakota | $5,093 | $4,875 | -4.3% |
| 44 | Connecticut | $3,629 | $3,461 | -4.6% |
| 45 | Delaware | $3,951 | $3,764 | -4.7% |
| 46 | Vermont | $3,774 | $3,582 | -5.1% |
| 47 | Maine | $3,825 | $3,619 | -5.4% |
| 48 | South Dakota | $4,664 | $4,329 | -7.2% |
| 49 | New Jersey | $4,460 | $4,084 | -8.4% |
| 50 | Michigan | $3,214 | $2,911 | -9.4% |
West Virginia also took the lead with the biggest increase in auto loan debt. The average in the Mountain State rose 7.8% — from $16,023 in Q3 2024 to $17,266 in Q3 2025. It was followed by Mississippi and Oklahoma, which saw 6.0% and 5.4% increases, respectively.
Full rankings: Biggest increases/decreases in average auto loan debt
| Rank | State | Avg. auto loan debt, Q3 2024 | Avg. auto loan debt, Q3 2025 | % change |
|---|---|---|---|---|
| 1 | West Virginia | $16,023 | $17,266 | 7.8% |
| 2 | Mississippi | $13,073 | $13,859 | 6.0% |
| 3 | Oklahoma | $13,841 | $14,593 | 5.4% |
| 4 | New Mexico | $15,804 | $16,558 | 4.8% |
| 5 | South Carolina | $12,262 | $12,818 | 4.5% |
| 6 | Vermont | $12,959 | $13,451 | 3.8% |
| 7 | Nevada | $12,712 | $13,057 | 2.7% |
| 8 | Georgia | $13,032 | $13,373 | 2.6% |
| 9 | Indiana | $11,819 | $12,083 | 2.2% |
| 10 | Pennsylvania | $10,694 | $10,864 | 1.6% |
| 11 | Connecticut | $9,931 | $10,069 | 1.4% |
| 12 | Wyoming | $14,761 | $14,959 | 1.3% |
| 13 | Texas | $16,410 | $16,588 | 1.1% |
| 14 | Louisiana | $15,252 | $15,387 | 0.9% |
| 15 | Nebraska | $11,654 | $11,725 | 0.6% |
| 16 | Massachusetts | $9,216 | $9,253 | 0.4% |
| 16 | Utah | $12,494 | $12,540 | 0.4% |
| 18 | Oregon | $10,366 | $10,393 | 0.3% |
| 19 | Maryland | $12,232 | $12,261 | 0.2% |
| 20 | Maine | $12,570 | $12,567 | 0.0% |
| 21 | Minnesota | $9,769 | $9,758 | -0.1% |
| 22 | Ohio | $11,576 | $11,554 | -0.2% |
| 23 | South Dakota | $12,466 | $12,430 | -0.3% |
| 24 | Florida | $14,566 | $14,491 | -0.5% |
| 25 | Kentucky | $11,439 | $11,339 | -0.9% |
| 26 | New Hampshire | $12,570 | $12,434 | -1.1% |
| 27 | North Carolina | $12,479 | $12,296 | -1.5% |
| 28 | Rhode Island | $9,914 | $9,736 | -1.8% |
| 28 | Washington | $11,229 | $11,032 | -1.8% |
| 30 | Wisconsin | $10,313 | $10,089 | -2.2% |
| 31 | Alabama | $13,683 | $13,358 | -2.4% |
| 32 | Idaho | $12,599 | $12,249 | -2.8% |
| 32 | Montana | $13,034 | $12,674 | -2.8% |
| 34 | Tennessee | $13,468 | $13,076 | -2.9% |
| 35 | Colorado | $11,837 | $11,464 | -3.2% |
| 36 | Kansas | $11,746 | $11,360 | -3.3% |
| 37 | Hawaii | $8,853 | $8,524 | -3.7% |
| 38 | New Jersey | $10,452 | $10,025 | -4.1% |
| 39 | Arkansas | $14,590 | $13,975 | -4.2% |
| 40 | Alaska | $14,205 | $13,599 | -4.3% |
| 41 | Delaware | $11,857 | $11,327 | -4.5% |
| 42 | Michigan | $11,113 | $10,599 | -4.6% |
| 42 | North Dakota | $15,239 | $14,539 | -4.6% |
| 44 | Iowa | $12,151 | $11,585 | -4.7% |
| 45 | Arizona | $13,201 | $12,535 | -5.0% |
| 46 | New York | $9,746 | $9,228 | -5.3% |
| 47 | Missouri | $11,729 | $11,037 | -5.9% |
| 48 | California | $11,956 | $11,221 | -6.1% |
| 49 | Illinois | $10,888 | $10,150 | -6.8% |
| 50 | Virginia | $12,185 | $11,343 | -6.9% |
Meanwhile, student loan debt saw the biggest increase in Wyoming — a 9.5% jump from $6,560 in Q3 2024 to $7,183 in Q3 2025. New Hampshire followed with an 8.7% increase and Maine with an 8.3% increase.
Full rankings: Biggest increases/decreases in average student loan debt
| Rank | State | Avg. student loan debt, Q3 2024 | Avg. student loan debt, Q3 2025 | % change |
|---|---|---|---|---|
| 1 | Wyoming | $6,560 | $7,183 | 9.5% |
| 2 | New Hampshire | $9,467 | $10,288 | 8.7% |
| 3 | Maine | $9,607 | $10,406 | 8.3% |
| 4 | New York | $11,406 | $12,299 | 7.8% |
| 5 | Nevada | $9,349 | $10,052 | 7.5% |
| 6 | Colorado | $10,329 | $11,067 | 7.1% |
| 7 | California | $9,142 | $9,700 | 6.1% |
| 8 | Rhode Island | $9,520 | $10,043 | 5.5% |
| 9 | Vermont | $9,945 | $10,449 | 5.1% |
| 10 | Delaware | $11,872 | $12,452 | 4.9% |
| 11 | Idaho | $7,683 | $7,983 | 3.9% |
| 11 | Minnesota | $10,611 | $11,023 | 3.9% |
| 13 | Indiana | $10,192 | $10,448 | 2.5% |
| 14 | Massachusetts | $11,425 | $11,702 | 2.4% |
| 15 | Maryland | $13,721 | $13,958 | 1.7% |
| 16 | Tennessee | $10,418 | $10,582 | 1.6% |
| 17 | Ohio | $11,378 | $11,537 | 1.4% |
| 18 | Virginia | $11,887 | $12,029 | 1.2% |
| 19 | Illinois | $12,042 | $12,143 | 0.8% |
| 20 | Washington | $7,799 | $7,856 | 0.7% |
| 21 | Hawaii | $8,834 | $8,831 | 0.0% |
| 22 | Mississippi | $13,836 | $13,804 | -0.2% |
| 23 | Arizona | $9,383 | $9,326 | -0.6% |
| 24 | Kansas | $10,494 | $10,341 | -1.5% |
| 25 | Utah | $7,814 | $7,671 | -1.8% |
| 26 | Florida | $10,422 | $10,220 | -1.9% |
| 26 | North Carolina | $11,721 | $11,501 | -1.9% |
| 26 | North Dakota | $9,566 | $9,384 | -1.9% |
| 29 | Texas | $11,158 | $10,937 | -2.0% |
| 30 | Wisconsin | $10,120 | $9,888 | -2.3% |
| 31 | New Jersey | $11,879 | $11,574 | -2.6% |
| 32 | West Virginia | $9,567 | $9,281 | -3.0% |
| 33 | Arkansas | $10,759 | $10,411 | -3.2% |
| 34 | Michigan | $12,256 | $11,849 | -3.3% |
| 35 | Oklahoma | $9,168 | $8,826 | -3.7% |
| 36 | Alabama | $11,429 | $10,994 | -3.8% |
| 37 | Connecticut | $12,423 | $11,917 | -4.1% |
| 38 | Pennsylvania | $12,811 | $12,197 | -4.8% |
| 39 | Nebraska | $10,252 | $9,745 | -4.9% |
| 40 | Georgia | $15,694 | $14,869 | -5.3% |
| 41 | South Dakota | $10,352 | $9,780 | -5.5% |
| 42 | Oregon | $10,526 | $9,930 | -5.7% |
| 43 | Alaska | $9,278 | $8,699 | -6.2% |
| 44 | Missouri | $10,870 | $10,103 | -7.1% |
| 45 | Montana | $9,120 | $8,287 | -9.1% |
| 46 | Kentucky | $10,679 | $9,634 | -9.8% |
| 47 | Louisiana | $12,164 | $10,743 | -11.7% |
| 48 | South Carolina | $13,492 | $11,901 | -11.8% |
| 49 | Iowa | $10,740 | $9,026 | -16.0% |
| 50 | New Mexico | $10,814 | $8,881 | -17.9% |
Expert tips on managing debt
Debt can be daunting, but there are ways to make having it less stressful and to make eliminating it happen more quickly. Schulz offers the following tips:
- Budget, budget, budget. You can’t make a meaningful plan to attack your debt if you don’t know how much is coming in and how much is going out of your household regularly. Once you know that, you can start to make decisions based on your spending priorities.
- Get your interest rates down. High interest rates wreck budgets, but there are things you can do to help yourself. A 0% balance transfer credit card can be a powerful weapon in your arsenal against credit card debt, though you’ll likely need good credit to get one. If you don’t have it, a debt consolidation loan can help, too. You could even call your credit card issuer to ask for a lower rate on your card — it works more often than you’d think. If your situation is more dire, an accredited nonprofit credit counselor can be a hugely helpful guide.
- Be good to yourself. Paying off debt isn’t a linear thing. You’ll have ups and downs. You may go a little wild spending one weekend and then regret what you’ve done, but that doesn’t mean you should lose hope, or focus. “Don’t beat yourself up about it,” Schulz says. “As long as you don’t do it too often or to too big a degree, you’re fine. Just keep your eyes on the prize and keep moving forward.”
Methodology
LendingTree researchers analyzed a sample of about 400,000 anonymized credit reports of LendingTree users from July, August and September 2025 and compared that with a sample of about 410,000 anonymized credit reports of LendingTree users from July, August and September 2024 — the third quarters of 2025 and 2024.
Researchers used this data to calculate average debt balances nationally and by state. We calculated:
- Total debt
- Nonmortgage debt
- Mortgage debt
- Auto loan debt
- Student loan debt
- Credit card debt
- Personal loan debt
- “Other” debt
Get debt consolidation loan offers from up to 5 lenders in minutes