Households Face Rising Utility Costs — These Metros Have the Highest Bills


It’s expensive to keep your utilities on, and those costs are rising.
According to a LendingTree study, households across the 50 largest U.S. metros spend an average of $310.38 a month on utility bills. Looking at each major utility, households that pay for electricity, gas, heating and water spend an average of $202.26, $117.80, $67.33 and $66.32 a month, respectively.
Here’s a closer look.
Key findings
- Across the 50 most populous U.S. metros, households that pay for electricity spend an average of $202.26 a month — the highest among the major utilities. Households that pay for gas, heating and water spend an average of $117.80, $67.33 and $66.32, respectively. Overall, households pay an average of $310.38 a month in utility costs.
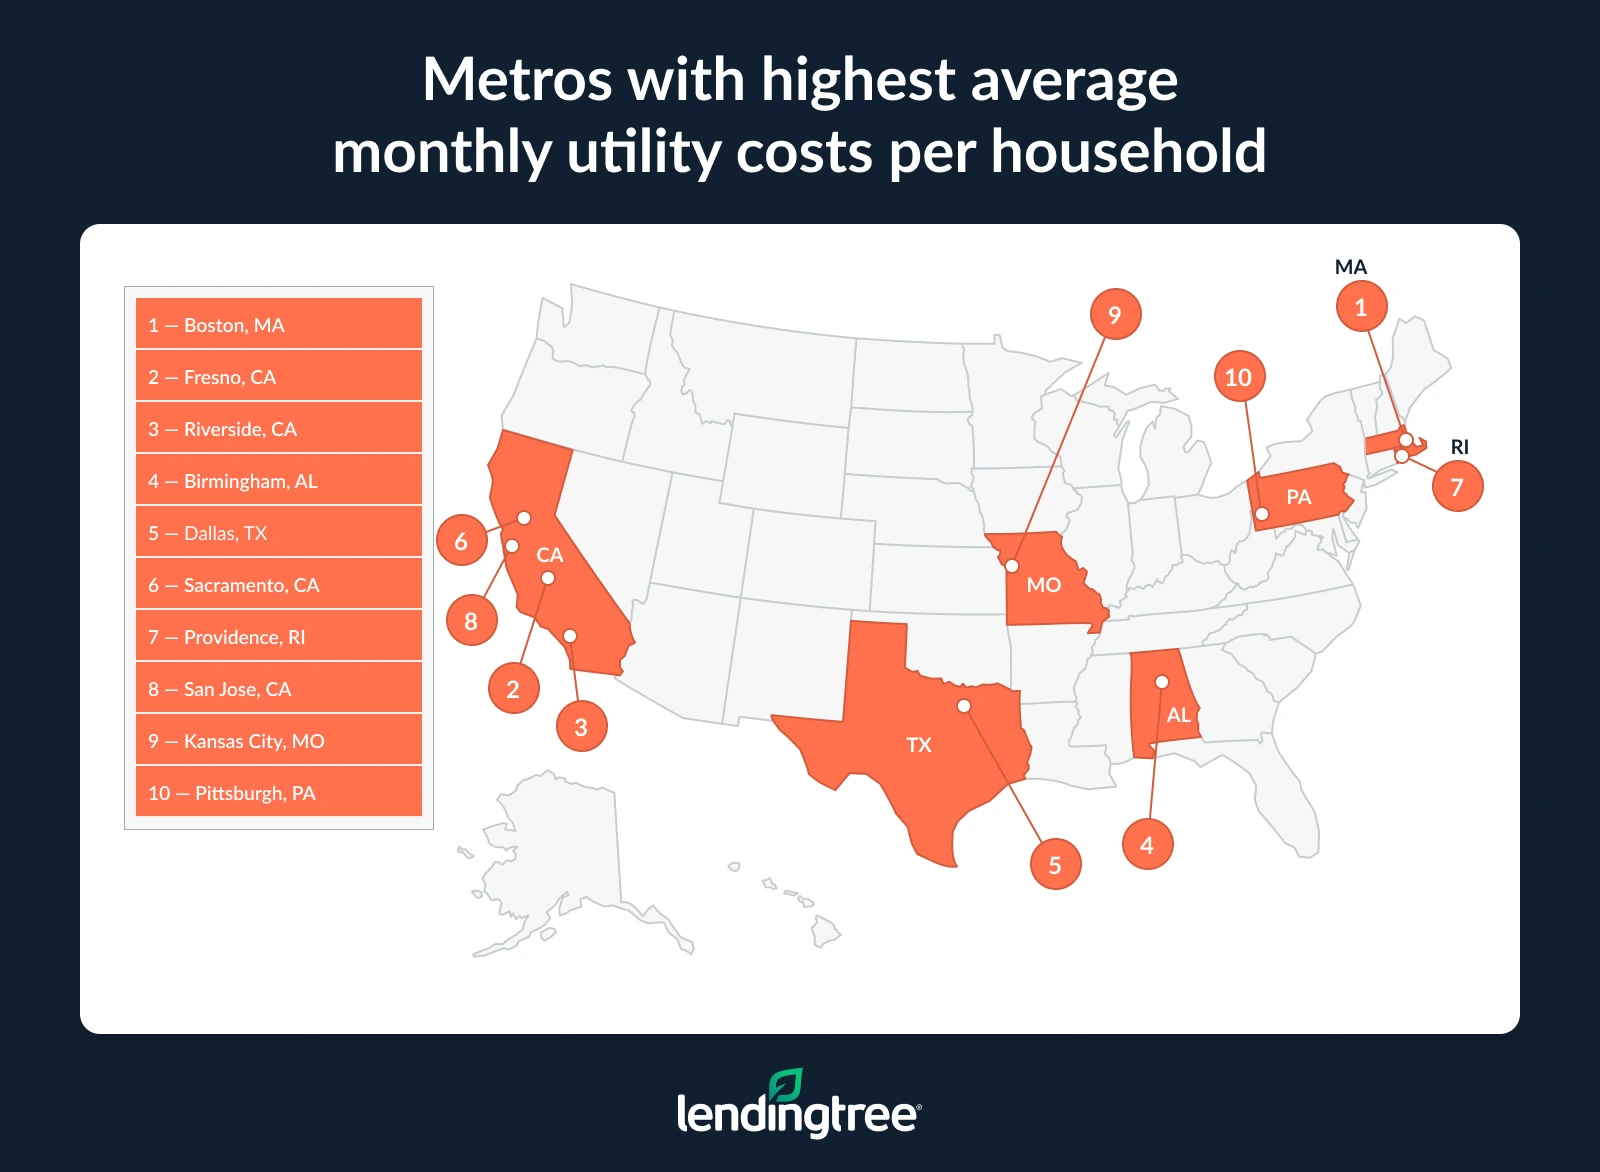
- Boston households face the highest per-household utility costs, averaging $393.84 a month. California metros are close behind, with Fresno ($376.83), Riverside ($364.61), Sacramento ($348.87) and San Jose ($344.18) in the top 10.
- The cost of utilities rose 6.0% between 2022 and 2023 in the 50 largest metros. That’s an increase of $17.46 a month or $209.54 a year. The largest increases were in Las Vegas (16.7%), Tampa, Fla. (13.5%), and Riverside (13.2%).
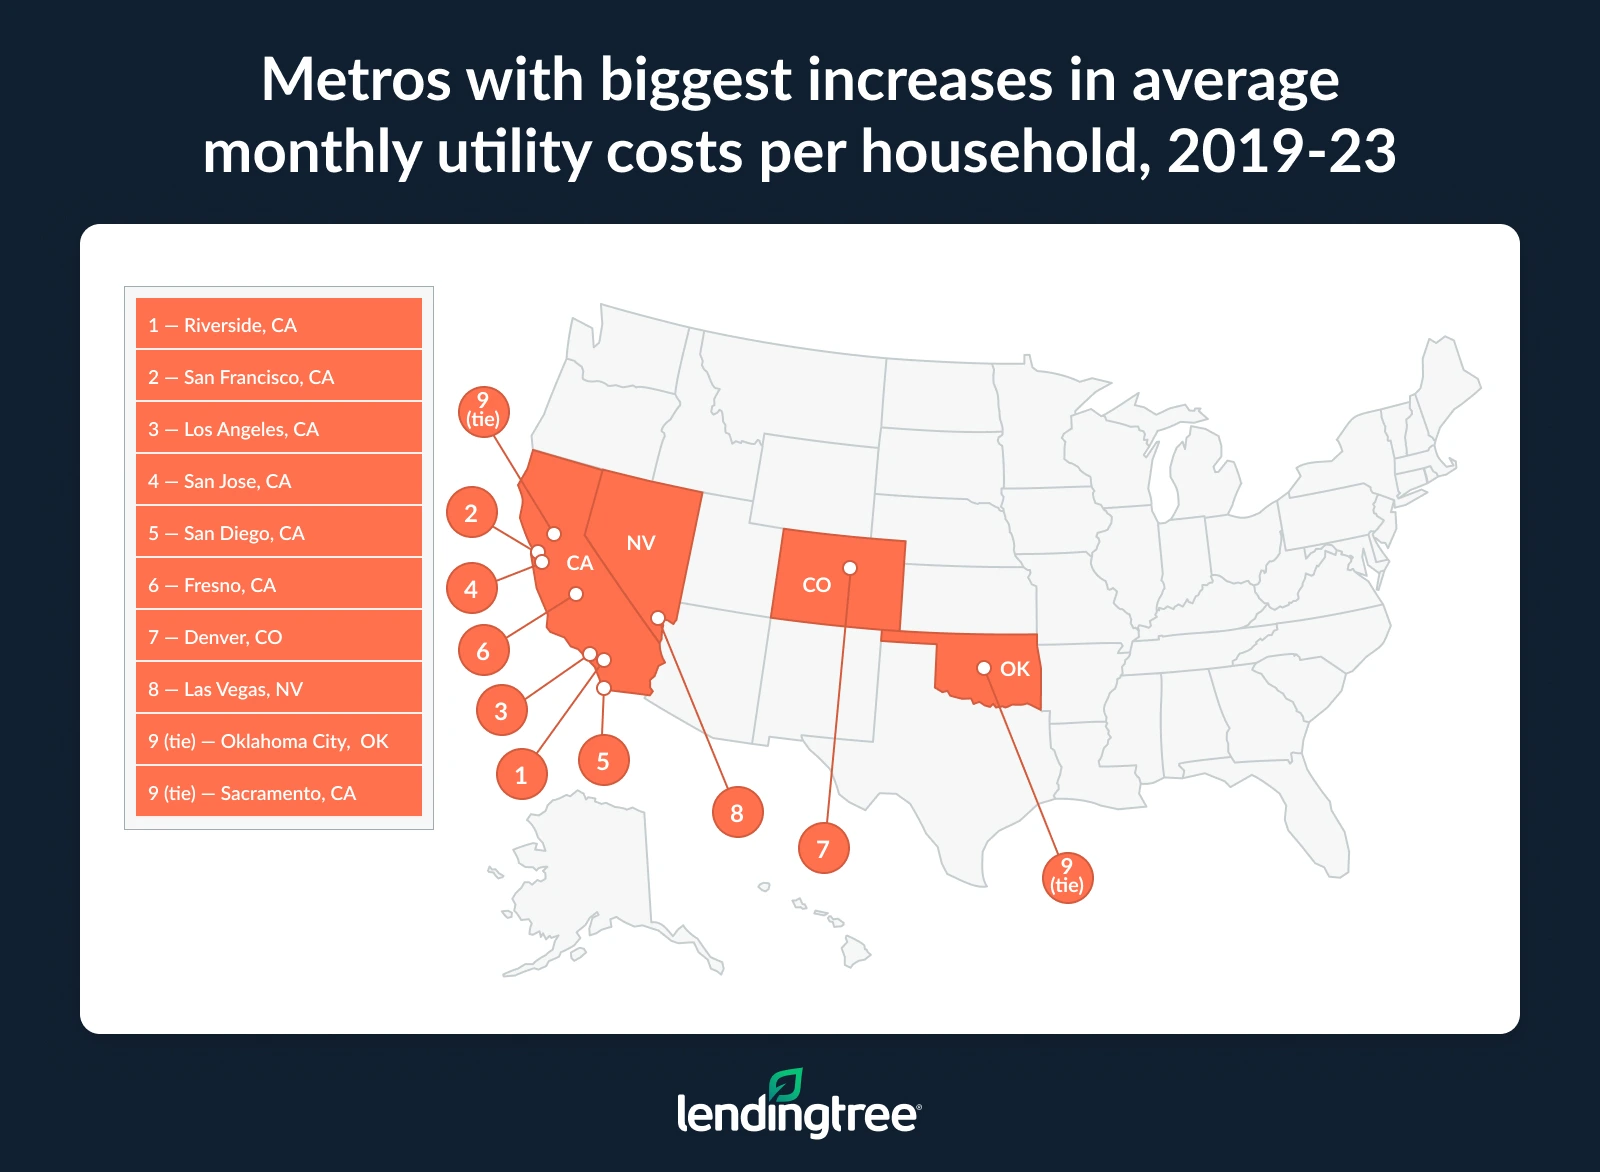
- Looking more broadly, utilities increased by 25.9% between 2019 and 2023. That’s an increase of $63.84 a month or $766.03 a year. California dominated, with its metros occupying each top-five spot: Riverside (52.8%), San Francisco (49.5%), Los Angeles (48.9%), San Jose (48.7%) and San Diego (47.1%).
- Households across the 50 metros spend an average of 4.3% of their median monthly income on utilities. Fresno (6.4%) is at the top, ahead of Birmingham, Ala. (6.2%), and Memphis, Tenn. (6.0%).
Utilities cost households $310.38 a month in 50 largest metros
Households in the 50 largest U.S. metros spend an average of $310.38 a month on utilities, according to our analysis of 2023 U.S. Census Bureau data — the latest available.
Electricity accounts for the largest average share of the bill, at $202.26 a month among households that pay for it. Following, households that pay for gas, heating and water pay an average of $117.80, $67.33 and $66.32, respectively.
At a glance: Monthly bill averages across the 50 largest metros
| Utility type | Monthly cost |
|---|---|
| Electricity | $202.26 |
| Gas | $117.80 |
| Heating | $67.33 |
| Water | $66.32 |
| Average | $310.38 |
Matt Schulz — LendingTree chief consumer finance analyst and author of “Ask Questions, Save Money, Make More: How to Take Control of Your Financial Life” — says those high costs mean consumers may tighten their belts.
“Money that goes to utilities is money that can’t go toward building an emergency fund, paying down high-interest debt or pursuing other goals,” he says. “It may even force people to take on a little debt from time to time, especially when these bills peak in the cold winter or sweltering summer.”
Not only can that hinder consumers, but many have also made sacrifices to keep the lights on. In fact, 34.3% of Americans have reported cutting back on or skipping necessary expenses to pay for utilities, according to a LendingTree study on energy bills.
Northeast, California households see steepest utility costs
As for where households face the highest average utility costs, look to the Northeast and California. Boston ranks first, with an average monthly utility cost of $393.84, ahead of California’s Fresno and Riverside at $376.83 and $364.61, respectively. Two other California metros — Sacramento and San Jose — also land in the top 10, as do two other Northeastern metros: Providence, R.I. and Pittsburgh.
That’s mainly due to fluctuations in temperature throughout the year, which require regular cooling and heating depending on the season.
Schulz says those high bills can be frustrating. “These aren’t just bills you can cancel like a Netflix subscription,” he says. “Sure, you can be diligent about turning off the lights when you leave a room, and you can keep your place a little warmer in the summer and a little colder in the winter, but you can’t make the bill disappear entirely.”
These aren’t just bills you can cancel like a Netflix subscription.

Conversely, Charlotte, N.C. has the lowest average utility bills per household, at $261.92. Nashville, Tenn. ($262.32), and Salt Lake City ($262.98), follow
Full rankings: Metros with highest/lowest average monthly utility costs per household
| Rank | Metro | Avg. electricity cost | Avg. gas cost | Avg. water cost | Avg. heating cost | Avg. cost per household |
|---|---|---|---|---|---|---|
| 1 | Boston, MA | $222.31 | $180.26 | $77.47 | $194.92 | $393.84 |
| 2 | Fresno, CA | $266.94 | $138.01 | $70.07 | $67.44 | $376.83 |
| 3 | Riverside, CA | $217.22 | $104.05 | $76.70 | $58.24 | $364.61 |
| 4 | Birmingham, AL | $254.85 | $108.09 | $60.59 | $37.28 | $358.36 |
| 5 | Dallas, TX | $243.92 | $105.35 | $74.76 | $34.44 | $351.44 |
| 6 | Sacramento, CA | $194.69 | $128.80 | $88.49 | $50.73 | $348.87 |
| 7 | Providence, RI | $200.13 | $158.72 | $64.35 | $160.54 | $346.86 |
| 8 | San Jose, CA | $223.62 | $133.17 | $101.74 | $64.49 | $344.18 |
| 9 | Kansas City, MO | $195.22 | $124.74 | $65.79 | $59.62 | $342.77 |
| 10 | Pittsburgh, PA | $180.42 | $138.40 | $75.77 | $118.06 | $340.21 |
| 11 | San Francisco, CA | $222.66 | $137.04 | $93.53 | $45.97 | $338.28 |
| 12 | Philadelphia, PA | $210.64 | $146.89 | $65.48 | $139.41 | $337.31 |
| 13 | Detroit, MI | $187.93 | $133.80 | $71.63 | $66.09 | $333.99 |
| 14 | Oklahoma City, OK | $209.35 | $116.65 | $63.61 | $37.56 | $328.23 |
| 15 | Houston, TX | $242.06 | $71.96 | $61.76 | $36.67 | $327.98 |
| 16 | New York, NY | $206.37 | $151.38 | $69.57 | $207.74 | $324.27 |
| 17 | Los Angeles, CA | $201.05 | $97.67 | $74.74 | $47.37 | $319.58 |
| 18 | Memphis, TN | $255.73 | $96.77 | $33.83 | $33.41 | $317.56 |
| 19 | Las Vegas, NV | $215.74 | $88.44 | $54.25 | $45.11 | $316.61 |
| 20 | Virginia Beach, VA | $205.67 | $117.75 | $78.76 | $73.19 | $312.78 |
| 21 | San Diego, CA | $205.35 | $119.89 | $100.48 | $45.10 | $312.73 |
| 22 | Atlanta, GA | $195.26 | $120.28 | $51.40 | $46.73 | $312.07 |
| 23 | Louisville, KY | $205.57 | $123.51 | $72.99 | $55.01 | $311.00 |
| 24 | Baltimore, MD | $227.26 | $147.70 | $51.34 | $106.49 | $309.70 |
| 25 | Indianapolis, IN | $194.92 | $124.16 | $53.95 | $55.09 | $308.58 |
| 26 | St. Louis, MO | $186.93 | $118.26 | $62.71 | $45.97 | $305.74 |
| 27 | Phoenix, AZ | $225.34 | $74.48 | $65.02 | $45.22 | $302.96 |
| 28 | Orlando, FL | $253.07 | $97.04 | $56.98 | $44.12 | $301.15 |
| 29 | Cincinnati, OH | $215.81 | $137.49 | $58.21 | $73.11 | $300.80 |
| 30 | Columbus, OH | $178.58 | $110.31 | $61.83 | $72.20 | $299.64 |
| 31 | Richmond, VA | $206.25 | $133.19 | $65.40 | $83.95 | $298.94 |
| 32 | Seattle, WA | $178.19 | $121.23 | $94.14 | $81.89 | $295.68 |
| 33 | Austin, TX | $201.60 | $77.20 | $63.27 | $37.59 | $292.32 |
| 34 | Washington, D.C. | $187.46 | $120.12 | $65.80 | $96.73 | $292.00 |
| 35 | Minneapolis, MN | $168.68 | $129.52 | $56.77 | $79.09 | $291.71 |
| 36 | Chicago, IL | $147.19 | $134.08 | $66.40 | $64.92 | $291.24 |
| 37 | Tampa, FL | $235.51 | $97.84 | $68.29 | $34.03 | $289.69 |
| 38 | Cleveland, OH | $140.32 | $121.82 | $72.25 | $64.39 | $289.37 |
| 39 | Portland, OR | $162.07 | $103.82 | $89.01 | $65.43 | $284.91 |
| 40 | Milwaukee, WI | $204.69 | $136.43 | $66.91 | $81.94 | $284.21 |
| 41 | San Antonio, TX | $225.01 | $87.62 | $58.08 | $39.27 | $283.43 |
| 42 | Denver, CO | $179.22 | $120.22 | $64.98 | $37.65 | $279.79 |
| 43 | Miami, FL | $231.37 | $110.12 | $67.44 | $44.35 | $279.46 |
| 44 | Jacksonville, FL | $224.41 | $112.48 | $55.73 | $32.19 | $275.11 |
| 45 | Raleigh, NC | $186.95 | $96.32 | $54.66 | $38.25 | $273.37 |
| 46 | Buffalo, NY | $146.36 | $133.02 | $37.32 | $120.02 | $273.26 |
| 47 | Grand Rapids, MI | $152.03 | $106.63 | $51.70 | $78.03 | $268.28 |
| 48 | Salt Lake City, UT | $132.42 | $105.68 | $57.50 | $42.00 | $262.98 |
| 49 | Nashville, TN | $184.10 | $93.11 | $51.60 | $36.34 | $262.32 |
| 50 | Charlotte, NC | $174.70 | $98.63 | $50.89 | $41.12 | $261.92 |
Costs rose average of 6.0% between 2022, 2023
Utility bills are undoubtedly high, and they’re only going up. Between 2022 and 2023, per-household costs for utilities increased by an average of 6.0% across the 50 largest metros. That translates to an extra $17.46 a month or $209.54 a year.
The biggest increase was in Las Vegas. At 16.7%, costs rose $45.22 a month or a whopping $546.66 a year. Tampa, Fla., followed with a 13.5% increase, adding $34.46 a month or $413.51 a year. Riverside, Calif., rounded out the top three with a 13.2% increase, adding $42.38 a month or $508.60 a year.
In total, six of the 10 metros with the biggest increases were in the West.
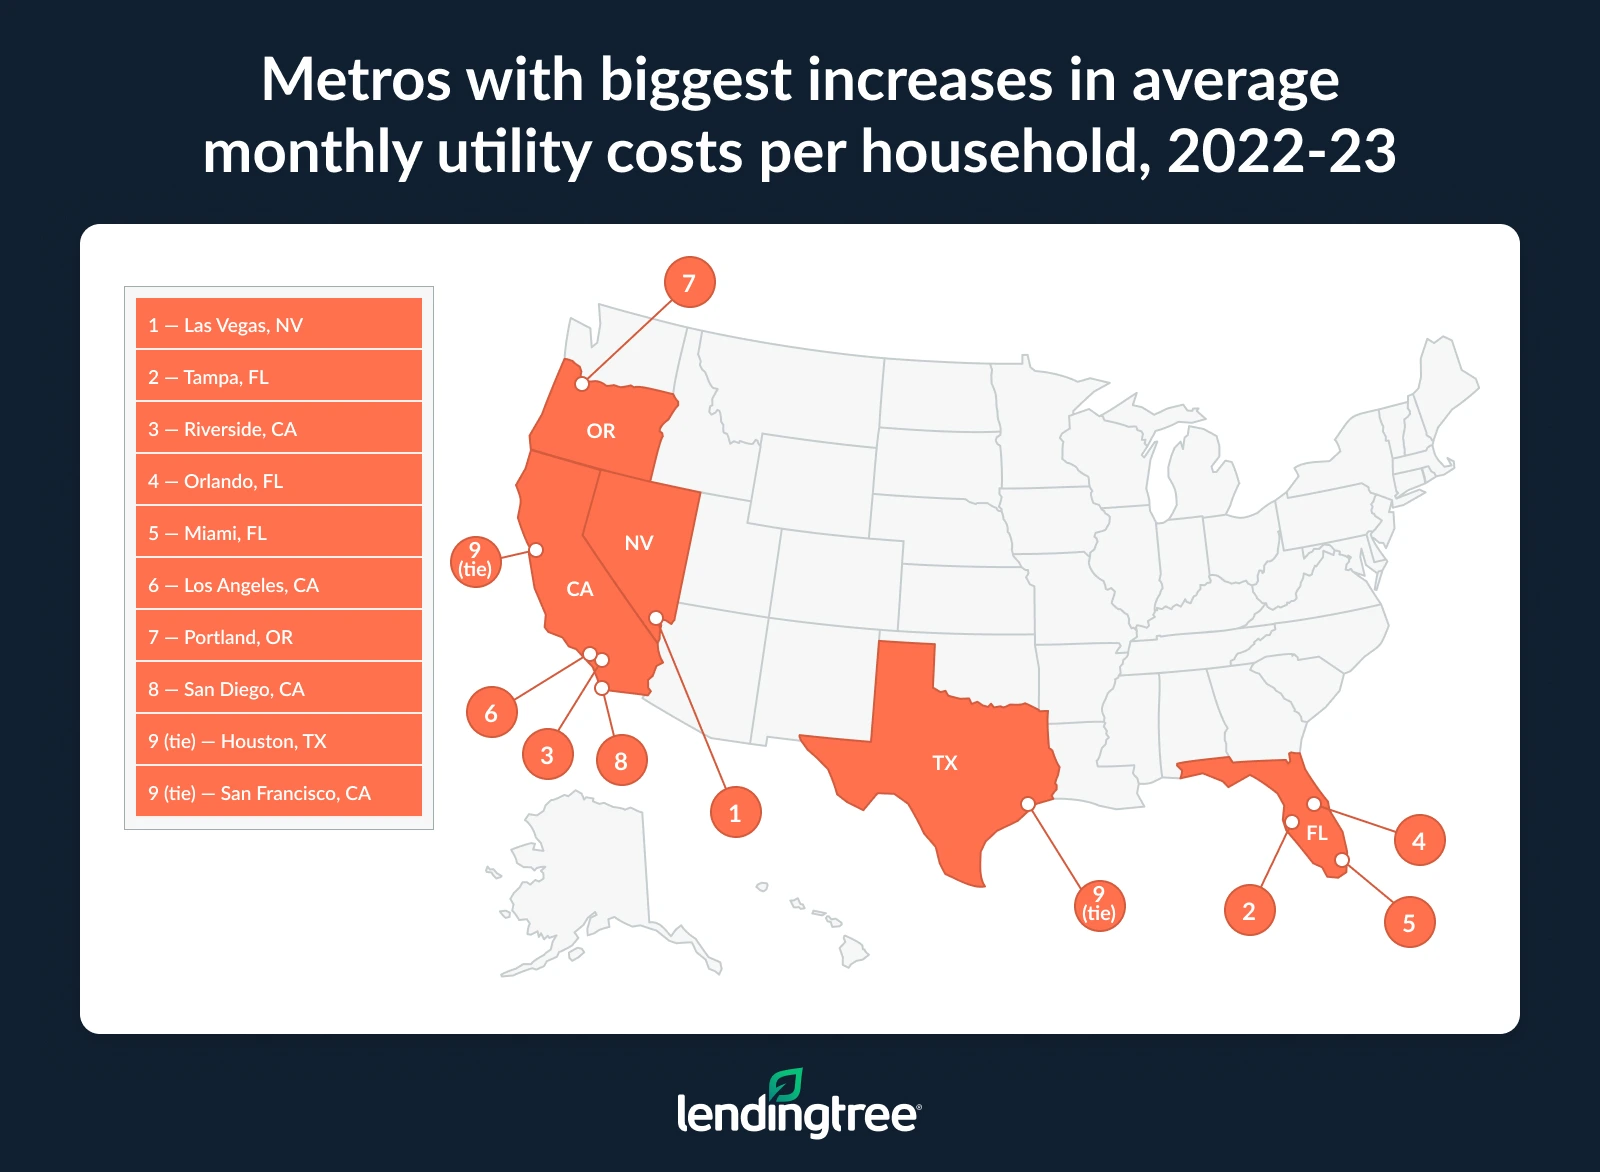
Meanwhile, just four metros saw decreases: Nashville (5.7%), Memphis, Tenn. (5.6%), Chicago (1.9%) and Louisville, Ky. (1.8%).
Expanding that timeline, utility costs jumped 25.9% per household between 2019 and 2023. That means households in the 50 largest metros were spending an extra $63.84 a month or $766.03 a year for utilities.
Western metros again dominated the list, comprising nine of the top 10 spots. Notably, the top six were in California, with Riverside leading the way at an increase of 52.8% — an extra $126.04 a month or $1,512.51 a year. San Francisco followed, with costs rising 49.5% (an extra $112.07 a month or $1,344.86 a year), along with Los Angeles, with costs rising 48.9% (an extra $105.01 a month or $1,260.08 a year).
Schulz says these increases can be a massive strain on consumers.
“When something gets 24% more expensive in such a short period, it can be tough for households,” he says. “It isn’t as if their salaries likely grew that fast during that time. That cost growth likely forces many households to make difficult choices, especially when it’s combined with other rising costs. For some, it may mean dialing back your summer vacation or canceling streaming services. For others, it may mean missing a payment on a credit card or other bill. Either way, it means less margin for error, and that’s never good.”
Conversely, costs rose the least in Charlotte (8.1%), Nashville (9.0%) and Raleigh, N.C. (12.5%).
Full rankings: Change in average monthly utility costs per household by metro, 2022-23
| Rank | Metro | Avg. cost per household, 2022 | Avg. cost per household, 2023 | $ change | % change |
|---|---|---|---|---|---|
| 1 | Las Vegas, NV | $271.39 | $316.61 | $45.22 | 16.7% |
| 2 | Tampa, FL | $255.24 | $289.69 | $34.46 | 13.5% |
| 3 | Riverside, CA | $322.23 | $364.61 | $42.38 | 13.2% |
| 4 | Orlando, FL | $266.53 | $301.15 | $34.62 | 13.0% |
| 5 | Miami, FL | $248.96 | $279.46 | $30.50 | 12.3% |
| 6 | Los Angeles, CA | $285.48 | $319.58 | $34.10 | 11.9% |
| 7 | Portland, OR | $255.07 | $284.91 | $29.84 | 11.7% |
| 8 | San Diego, CA | $280.12 | $312.73 | $32.62 | 11.6% |
| 9 | Houston, TX | $294.72 | $327.98 | $33.26 | 11.3% |
| 9 | San Francisco, CA | $304.02 | $338.28 | $34.26 | 11.3% |
| 11 | Denver, CO | $253.36 | $279.79 | $26.44 | 10.4% |
| 12 | San Jose, CA | $312.58 | $344.18 | $31.61 | 10.1% |
| 13 | Birmingham, AL | $326.69 | $358.36 | $31.67 | 9.7% |
| 14 | Fresno, CA | $344.22 | $376.83 | $32.62 | 9.5% |
| 15 | Kansas City, MO | $315.67 | $342.77 | $27.10 | 8.6% |
| 16 | Pittsburgh, PA | $313.70 | $340.21 | $26.50 | 8.4% |
| 17 | Oklahoma City, OK | $305.90 | $328.23 | $22.33 | 7.3% |
| 18 | Salt Lake City, UT | $245.41 | $262.98 | $17.57 | 7.2% |
| 19 | Dallas, TX | $328.61 | $351.44 | $22.83 | 6.9% |
| 20 | Boston, MA | $368.90 | $393.84 | $24.94 | 6.8% |
| 21 | Phoenix, AZ | $284.35 | $302.96 | $18.61 | 6.5% |
| 22 | Baltimore, MD | $291.59 | $309.70 | $18.11 | 6.2% |
| 23 | Virginia Beach, VA | $294.69 | $312.78 | $18.08 | 6.1% |
| 24 | Sacramento, CA | $329.21 | $348.87 | $19.66 | 6.0% |
| 25 | Columbus, OH | $282.84 | $299.64 | $16.80 | 5.9% |
| 26 | Cincinnati, OH | $285.07 | $300.80 | $15.73 | 5.5% |
| 27 | St. Louis, MO | $290.50 | $305.74 | $15.24 | 5.2% |
| 28 | Austin, TX | $278.20 | $292.32 | $14.12 | 5.1% |
| 29 | Grand Rapids, MI | $255.41 | $268.28 | $12.86 | 5.0% |
| 30 | Providence, RI | $330.60 | $346.86 | $16.27 | 4.9% |
| 31 | Richmond, VA | $285.65 | $298.94 | $13.29 | 4.7% |
| 32 | Philadelphia, PA | $323.29 | $337.31 | $14.02 | 4.3% |
| 33 | Atlanta, GA | $300.23 | $312.07 | $11.83 | 3.9% |
| 33 | Washington, D.C. | $281.12 | $292.00 | $10.88 | 3.9% |
| 35 | Raleigh, NC | $263.49 | $273.37 | $9.88 | 3.7% |
| 35 | Seattle, WA | $285.07 | $295.68 | $10.61 | 3.7% |
| 37 | Buffalo, NY | $264.35 | $273.26 | $8.91 | 3.4% |
| 37 | Milwaukee, WI | $274.98 | $284.21 | $9.23 | 3.4% |
| 39 | Cleveland, OH | $280.54 | $289.37 | $8.82 | 3.1% |
| 40 | Charlotte, NC | $255.09 | $261.92 | $6.83 | 2.7% |
| 41 | Minneapolis, MN | $284.35 | $291.71 | $7.36 | 2.6% |
| 42 | Detroit, MI | $327.29 | $333.99 | $6.70 | 2.0% |
| 42 | Indianapolis, IN | $302.49 | $308.58 | $6.09 | 2.0% |
| 44 | New York, NY | $318.19 | $324.27 | $6.08 | 1.9% |
| 45 | Jacksonville, FL | $270.13 | $275.11 | $4.97 | 1.8% |
| 46 | San Antonio, TX | $279.91 | $283.43 | $3.52 | 1.3% |
| 47 | Louisville, KY | $316.86 | $311.00 | -$5.86 | -1.8% |
| 48 | Chicago, IL | $297.00 | $291.24 | -$5.76 | -1.9% |
| 49 | Memphis, TN | $336.38 | $317.56 | -$18.82 | -5.6% |
| 50 | Nashville, TN | $278.21 | $262.32 | -$15.89 | -5.7% |
Full rankings: Change in average monthly utility costs per household by metro, 2019-23
| Rank | Metro | Avg. cost per household, 2019 | Avg. cost per household, 2023 | $ change | % change |
|---|---|---|---|---|---|
| 1 | Riverside, CA | $238.57 | $364.61 | $126.04 | 52.8% |
| 2 | San Francisco, CA | $226.21 | $338.28 | $112.07 | 49.5% |
| 3 | Los Angeles, CA | $214.57 | $319.58 | $105.01 | 48.9% |
| 4 | San Jose, CA | $231.47 | $344.18 | $112.71 | 48.7% |
| 5 | San Diego, CA | $212.61 | $312.73 | $100.12 | 47.1% |
| 6 | Fresno, CA | $262.16 | $376.83 | $114.67 | 43.7% |
| 7 | Denver, CO | $202.72 | $279.79 | $77.07 | 38.0% |
| 8 | Las Vegas, NV | $232.37 | $316.61 | $84.24 | 36.3% |
| 9 | Oklahoma City, OK | $242.92 | $328.23 | $85.30 | 35.1% |
| 9 | Sacramento, CA | $258.23 | $348.87 | $90.64 | 35.1% |
| 11 | Boston, MA | $295.66 | $393.84 | $98.19 | 33.2% |
| 12 | Portland, OR | $215.44 | $284.91 | $69.47 | 32.2% |
| 13 | Tampa, FL | $220.45 | $289.69 | $69.24 | 31.4% |
| 14 | Buffalo, NY | $210.47 | $273.26 | $62.79 | 29.8% |
| 15 | Pittsburgh, PA | $264.10 | $340.21 | $76.11 | 28.8% |
| 15 | Minneapolis, MN | $226.50 | $291.71 | $65.20 | 28.8% |
| 17 | Houston, TX | $254.96 | $327.98 | $73.02 | 28.6% |
| 17 | Dallas, TX | $273.27 | $351.44 | $78.17 | 28.6% |
| 19 | Orlando, FL | $234.28 | $301.15 | $66.87 | 28.5% |
| 20 | Miami, FL | $217.66 | $279.46 | $61.80 | 28.4% |
| 21 | Milwaukee, WI | $222.84 | $284.21 | $61.37 | 27.5% |
| 22 | Providence, RI | $272.81 | $346.86 | $74.06 | 27.1% |
| 23 | Seattle, WA | $238.06 | $295.68 | $57.61 | 24.2% |
| 24 | Salt Lake City, UT | $211.93 | $262.98 | $51.05 | 24.1% |
| 25 | Cincinnati, OH | $242.59 | $300.80 | $58.21 | 24.0% |
| 26 | Cleveland, OH | $234.24 | $289.37 | $55.12 | 23.5% |
| 27 | Columbus, OH | $242.91 | $299.64 | $56.73 | 23.4% |
| 28 | New York, NY | $262.93 | $324.27 | $61.34 | 23.3% |
| 29 | Detroit, MI | $272.76 | $333.99 | $61.23 | 22.4% |
| 30 | Chicago, IL | $238.40 | $291.24 | $52.84 | 22.2% |
| 31 | Grand Rapids, MI | $219.89 | $268.28 | $48.39 | 22.0% |
| 31 | Baltimore, MD | $253.94 | $309.70 | $55.76 | 22.0% |
| 33 | Virginia Beach, VA | $261.16 | $312.78 | $51.62 | 19.8% |
| 34 | St. Louis, MO | $255.84 | $305.74 | $49.90 | 19.5% |
| 35 | Louisville, KY | $260.41 | $311.00 | $50.59 | 19.4% |
| 35 | San Antonio, TX | $237.44 | $283.43 | $45.99 | 19.4% |
| 37 | Philadelphia, PA | $282.90 | $337.31 | $54.41 | 19.2% |
| 38 | Kansas City, MO | $290.26 | $342.77 | $52.51 | 18.1% |
| 39 | Phoenix, AZ | $257.16 | $302.96 | $45.80 | 17.8% |
| 40 | Austin, TX | $249.09 | $292.32 | $43.23 | 17.4% |
| 41 | Indianapolis, IN | $263.05 | $308.58 | $45.53 | 17.3% |
| 42 | Memphis, TN | $271.16 | $317.56 | $46.39 | 17.1% |
| 43 | Birmingham, AL | $307.70 | $358.36 | $50.66 | 16.5% |
| 43 | Washington, D.C. | $250.73 | $292.00 | $41.27 | 16.5% |
| 45 | Richmond, VA | $257.50 | $298.94 | $41.44 | 16.1% |
| 46 | Jacksonville, FL | $237.78 | $275.11 | $37.33 | 15.7% |
| 47 | Atlanta, GA | $270.88 | $312.07 | $41.19 | 15.2% |
| 48 | Raleigh, NC | $242.98 | $273.37 | $30.39 | 12.5% |
| 49 | Nashville, TN | $240.77 | $262.32 | $21.55 | 9.0% |
| 50 | Charlotte, NC | $242.38 | $261.92 | $19.54 | 8.1% |
Households spend 4.3% of median income on utilities
On average, U.S. households across the 50 largest metros spend 4.3% of their median monthly income on utilities The median household income in the 50 metros is $7,205.21 a month, and consumers spend $310.38 on utilities.
At a glance: Percentage of median monthly income on utilities across the 50 largest metros
| Avg. utility cost per household, 2023 | $310.38 |
| Median monthly household income, 2023 | $7,205.21 |
| % of income spent on utilities | 4.3% |
Those in Fresno spend the biggest share of their income on utilities. With a median household income of $5,928.33 a month, consumers spend $376.83 a month on utilities, or 6.4%. Birmingham, Ala. (6.2%), and Memphis (6.0%) follow.
“If you’re spending that big a percentage of your income on utilities, there’s a good chance you’re not saving as much as you’d like, investing as much as you’d like, paying down your debts as quickly as you’d like and more,” Schulz says. “It makes it that much harder for you to firm up your financial foundation, and that can leave you more vulnerable when times turn sour.”
Metros that spend highest percentage of median monthly income on utilities
| Rank | Metro | Avg. utility cost per household, 2023 | Median monthly household income, 2023 | % of income spent on utilities |
|---|---|---|---|---|
| 1 | Fresno, CA | $376.83 | $5,928.33 | 6.4% |
| 2 | Birmingham, AL | $358.36 | $5,773.67 | 6.2% |
| 3 | Memphis, TN | $317.56 | $5,335.42 | 6.0% |
Meanwhile, San Jose ranks last, with residents here spending just 2.7% of their median income on utilities. Washington, D.C. (2.9%) follows, with San Francisco and Seattle next lowest, both at 3.2%.
Full rankings: Metros that spend highest/lowest percentage of median monthly income on utilities
| Rank | Metro | Avg. monthly total cost, 2023 | Median monthly household income, 2023 | % of income spent on utilities |
|---|---|---|---|---|
| 1 | Fresno, CA | $376.83 | $5,928.33 | 6.4% |
| 2 | Birmingham, AL | $358.36 | $5,773.67 | 6.2% |
| 3 | Memphis, TN | $317.56 | $5,335.42 | 6.0% |
| 4 | Oklahoma City, OK | $328.23 | $5,824.58 | 5.6% |
| 4 | Pittsburgh, PA | $340.21 | $6,044.33 | 5.6% |
| 6 | Detroit, MI | $333.99 | $6,047.83 | 5.5% |
| 7 | Louisville, KY | $311.00 | $5,743.42 | 5.4% |
| 8 | Kansas City, MO | $342.77 | $6,653.50 | 5.2% |
| 9 | Cleveland, OH | $289.37 | $5,632.17 | 5.1% |
| 9 | Las Vegas, NV | $316.61 | $6,255.42 | 5.1% |
| 11 | Providence, RI | $346.86 | $6,944.17 | 5.0% |
| 11 | Riverside, CA | $364.61 | $7,320.25 | 5.0% |
| 11 | Houston, TX | $327.98 | $6,621.92 | 5.0% |
| 14 | Dallas, TX | $351.44 | $7,238.33 | 4.9% |
| 15 | Tampa, FL | $289.69 | $6,061.92 | 4.8% |
| 15 | Indianapolis, IN | $308.58 | $6,495.58 | 4.8% |
| 17 | Virginia Beach, VA | $312.78 | $6,610.42 | 4.7% |
| 17 | Buffalo, NY | $273.26 | $5,821.75 | 4.7% |
| 17 | St. Louis, MO | $305.74 | $6,518.67 | 4.7% |
| 17 | Orlando, FL | $301.15 | $6,448.17 | 4.7% |
| 17 | Philadelphia, PA | $337.31 | $7,238.92 | 4.7% |
| 22 | San Antonio, TX | $283.43 | $6,099.58 | 4.6% |
| 22 | Columbus, OH | $299.64 | $6,449.17 | 4.6% |
| 22 | Cincinnati, OH | $300.80 | $6,487.00 | 4.6% |
| 25 | Milwaukee, WI | $284.21 | $6,417.17 | 4.4% |
| 25 | Sacramento, CA | $348.87 | $7,916.00 | 4.4% |
| 25 | Miami, FL | $279.46 | $6,355.92 | 4.4% |
| 28 | Atlanta, GA | $312.07 | $7,208.75 | 4.3% |
| 28 | Jacksonville, FL | $275.11 | $6,420.33 | 4.3% |
| 28 | Boston, MA | $393.84 | $9,224.75 | 4.3% |
| 28 | Richmond, VA | $298.94 | $7,027.67 | 4.3% |
| 32 | Phoenix, AZ | $302.96 | $7,141.67 | 4.2% |
| 32 | Los Angeles, CA | $319.58 | $7,663.33 | 4.2% |
| 34 | Grand Rapids, MI | $268.28 | $6,498.25 | 4.1% |
| 34 | New York, NY | $324.27 | $7,935.00 | 4.1% |
| 36 | Chicago, IL | $291.24 | $7,255.92 | 4.0% |
| 37 | Baltimore, MD | $309.70 | $7,857.42 | 3.9% |
| 37 | Charlotte, NC | $261.92 | $6,771.83 | 3.9% |
| 39 | Nashville, TN | $262.32 | $7,057.08 | 3.7% |
| 39 | Minneapolis, MN | $291.71 | $7,925.17 | 3.7% |
| 41 | San Diego, CA | $312.73 | $8,639.50 | 3.6% |
| 41 | Portland, OR | $284.91 | $7,910.42 | 3.6% |
| 41 | Austin, TX | $292.32 | $8,209.00 | 3.6% |
| 44 | Raleigh, NC | $273.37 | $8,008.00 | 3.4% |
| 45 | Salt Lake City, UT | $262.98 | $7,867.42 | 3.3% |
| 45 | Denver, CO | $279.79 | $8,587.92 | 3.3% |
| 47 | Seattle, WA | $295.68 | $9,228.67 | 3.2% |
| 47 | San Francisco, CA | $338.28 | $10,649.33 | 3.2% |
| 49 | Washington, D.C. | $292.00 | $10,122.42 | 2.9% |
| 50 | San Jose, CA | $344.18 | $12,766.83 | 2.7% |
Saving despite high utility bills: Top expert tips
It can be difficult to see so many different costs rise while incomes may not rise as quickly, and utilities are no exception.
“The best advice is to control what you can control,” Schulz says. “Money can be so stressful because so often we feel completely powerless and helpless. But you have more power over your money than you realize, and wielding some of that power can be enormously helpful.”
In particular, we recommend the following:
- Ruthlessly prioritize your spending. “So many of us have things we can cut back on when times get tough to free up funds for savings, debt payment and other financial goals,” Schulz says. “You have to look for them, though.”
- Get your interest rates down. “Maybe that’s through a 0% balance transfer credit card or a low-interest personal loan,” he says. “Maybe it’s through a phone call to your lender or a visit to a credit counselor. If you have good credit, there’s a decent chance you can lower your rates on some of your high-interest debts, but you won’t know if you don’t try.”
- Automate your payments and your savings. “There’s little in life more expensive than crummy credit,” he says. “Setting up automatic payments can help you protect your credit by making sure you never miss a payment. Meanwhile, automating your savings can help ensure that you consistently set aside at least a little bit of cash each paycheck, even while paying down debt. It may not seem like you’re accomplishing much, but it’ll be worth it.”
Methodology
LendingTree analysts used U.S. Census Bureau 2019, 2022 and 2023 American Community Survey (ACS) microdata with one-year estimates via IPUMS to estimate monthly utility costs per household across the 50 largest U.S. metros, and their changes over time.
For each utility (electricity, gas, water and home heating), we calculated weighted average annual costs among households that pay that bill and divided the result by 12 to find the monthly average bill for each utility type.
We also report the monthly utility cost per household, which is the average total monthly bill a household pays in utilities, regardless of the utilities for which they pay.
The results were used to calculate, by metro:
- Average monthly utility costs per household, 2023
- Change in average monthly utility costs per household, 2022-23
- Change in average monthly utility costs per household, 2019-23
- Spending of median monthly income on utilities, 2023
Percentage changes were calculated using unrounded figures. Rankings are based on percentage change unless otherwise noted.
Get debt consolidation loan offers from up to 5 lenders in minutes