Shopping Around for Mortgage Could Save Borrowers $80,000+ Over Lifetime of Loan


Home prices are expensive, and today’s mortgage rates don’t help. While rates may be high, finding a competitive offer can make a significant difference.
According to our analysis of LendingTree’s online loan marketplace data, borrowers could save a staggering $80,024 on average by shopping around for a loan. Here’s what we found.
Key findings
- Borrowers could save an average of $80,024 over the life of a 30-year, fixed-rate mortgage by shopping around. That’s the equivalent of saving $222 a month or $2,667 a year by choosing the best offer. The same analysis in 2024 found that shoppers could save an average of $76,410 — $3,614 less than they stand to save this year.
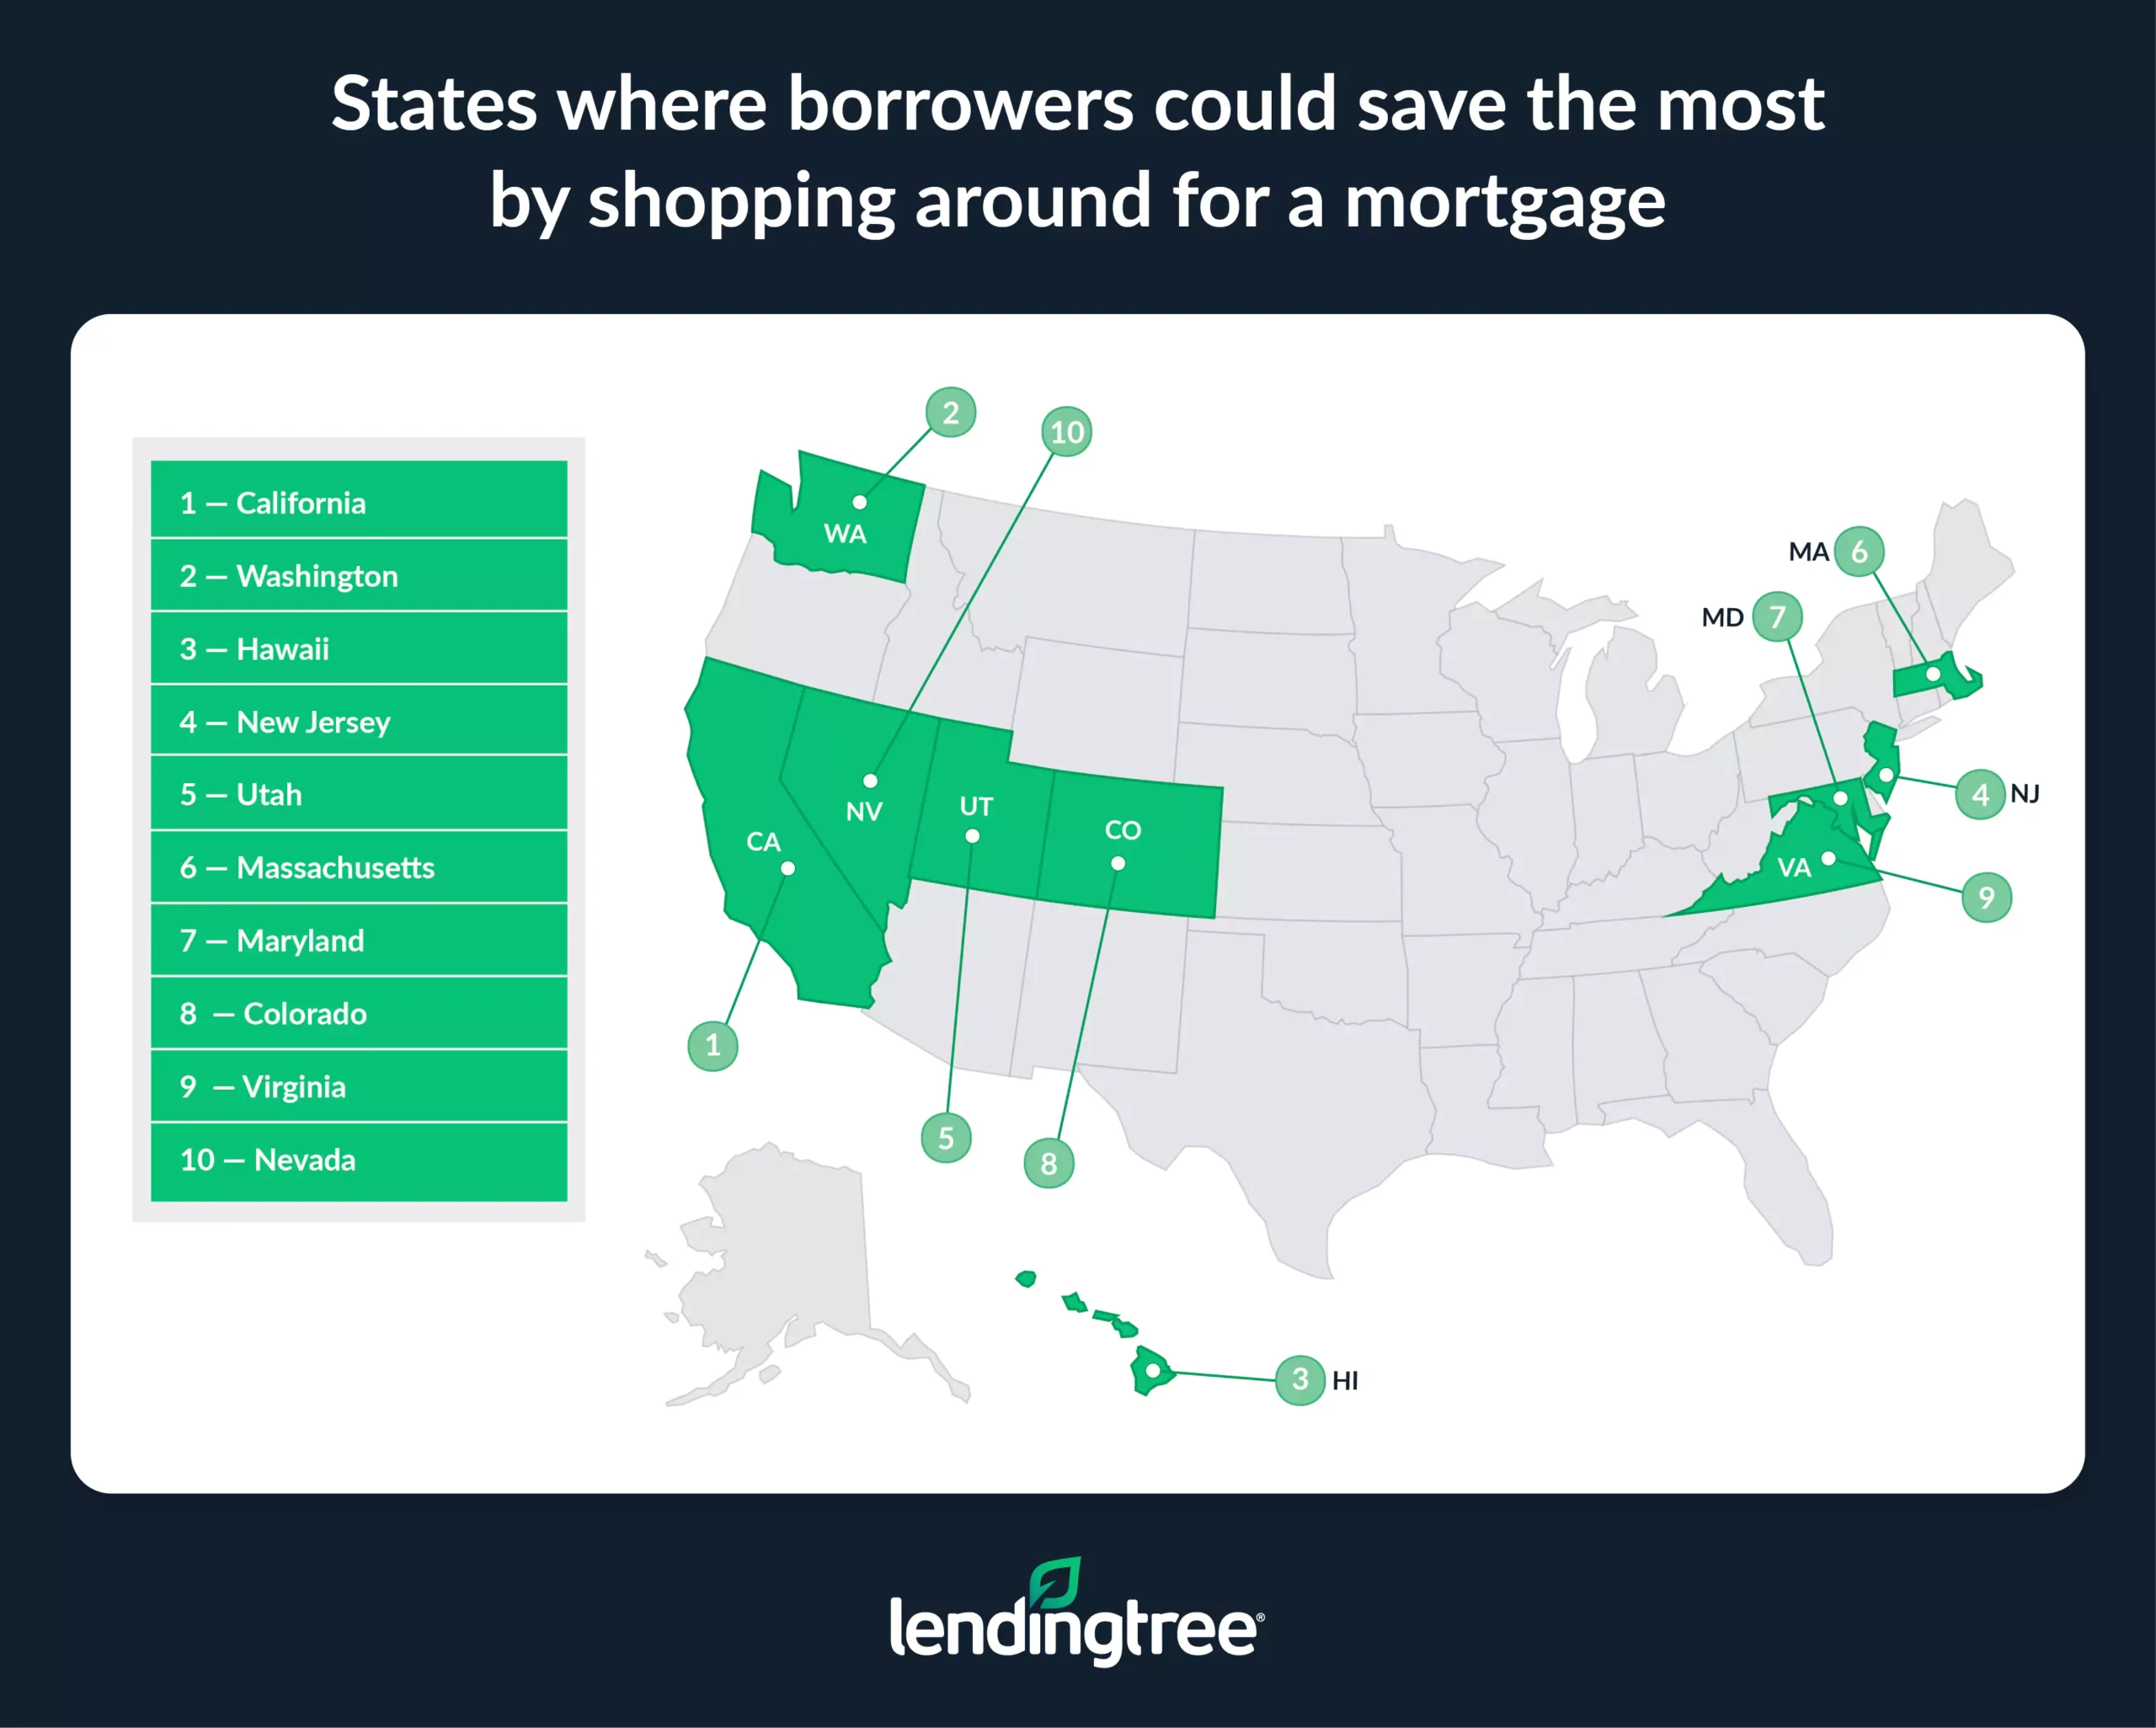
- California, Washington and Hawaii top the list of states where mortgage shoppers could benefit the most. Lifetime savings in these states are $118,393 (California), $109,012 (Washington) and $105,473 (Hawaii). In total, borrowers in seven states could save over $100,000 on 30-year mortgages by securing the best rates.
- No matter where you live, mortgage rate shopping pays off. Even in Louisiana — the state with the lowest potential savings — borrowers could still save more than $44,000 over the life of a 30-year loan, reducing monthly payments by $124.
- The average gap between the lowest and highest APRs offered to borrowers is 0.99 percentage points. This figure varies by state, with Minnesota having the widest spread (1.15 percentage points) and New York and Louisiana having the smallest (0.73 for both). In 20 states, the APR difference is higher than 1.00 percentage points — a big opportunity for savings.
Borrowers could save significantly by shopping around
On average, borrowers could save $80,024 over the life of a 30-year, fixed-rate mortgage — just by shopping around for the best rate. To put that in perspective, that’s $1,486 more than the median household income in 2023.
This staggering lifetime figure breaks down to $222 a month or $2,667 a year in savings.
How much borrowers could save by shopping around for a mortgage (nationally)
| Avg. lowest offered APR | Avg. highest offered APR | Spread (% points) | Avg. requested mortgage amount | Monthly payment, lowest avg. APR | Monthly payment, highest avg. APR | Monthly savings | Yearly savings | Lifetime savings |
|---|---|---|---|---|---|---|---|---|
| 6.83% | 7.82% | 0.99 | $330,144 | $2,159 | $2,381 | $222 | $2,667 | $80,024 |
Matt Schulz — LendingTree chief consumer finance analyst and author of “Ask Questions, Save Money, Make More: How to Take Control of Your Financial Life” — says those savings can be enormously significant. “That’s money that can instead be used toward other financial goals,” he says. “It can turbocharge your savings for an emergency fund or your investing for retirement. It can make it far easier to pay down lingering high-interest debt. It’s a big deal.”
When we last conducted this study in 2024, we found that shoppers could save an average of $76,410. That means borrowers can save $3,614 more this year than they could before.
Want to make sure you get your lowest mortgage rates? Submit your loan estimate offer to get a better home loan rate quote or get $250 on LendingTree.
Shoppers in expensive states could find the most savings
Looking by state, borrowers in California could save the most money, with lifetime savings of $118,393. Washington ($109,012) and Hawaii ($105,473) follow. That’s understandable, given how expensive homebuying is in these states. California ($510,776) and Hawaii ($506,980) have the highest and second-highest average requested mortgage amounts, while Washington ($437,948) ranks fourth.
Borrowers in seven states could save over $100,000 on 30-year mortgages by securing the best rates.
“The bigger the price of the home, the bigger the savings for shopping around for a lower rate,” Schulz says. “If the possibility of saving $100,000 or more over the life of a loan doesn’t motivate you to shop around for a better interest rate deal, I’m not sure anything will.”
On the other end of the list, borrowers in Louisiana could save $44,586 — and although that’s the lowest by state, it still saves a valuable $124 in monthly payments or $1,486 per year. West Virginia ($46,519) and Mississippi ($49,846) follow. West Virginia ($211,642) and Mississippi ($229,724) have the lowest and second-lowest average requested mortgage amounts, while Louisiana ($247,469) ranks seventh.
How much borrowers could save by shopping around for a mortgage (by state)
| Rank | State | Avg. lowest offered APR | Avg. highest offered APR | Spread (% points) | Avg. requested mortgage amount | Monthly payment, lowest avg. APR | Monthly payment, highest avg. APR | Monthly savings | Yearly savings | Lifetime savings |
|---|---|---|---|---|---|---|---|---|---|---|
| 1 | California | 6.76% | 7.71% | 0.95 | $510,776 | $3,316 | $3,645 | $329 | $3,946 | $118,393 |
| 2 | Washington | 6.73% | 7.75% | 1.02 | $437,948 | $2,835 | $3,138 | $303 | $3,634 | $109,012 |
| 3 | Hawaii | 6.89% | 7.74% | 0.85 | $506,980 | $3,336 | $3,629 | $293 | $3,516 | $105,473 |
| 4 | New Jersey | 6.72% | 7.76% | 1.04 | $412,283 | $2,666 | $2,957 | $291 | $3,488 | $104,638 |
| 5 | Utah | 6.73% | 7.79% | 1.06 | $398,227 | $2,578 | $2,864 | $286 | $3,436 | $103,090 |
| 6 | Massachusetts | 6.80% | 7.74% | 0.94 | $440,867 | $2,874 | $3,155 | $281 | $3,375 | $101,254 |
| 7 | Maryland | 6.69% | 7.80% | 1.11 | $369,951 | $2,385 | $2,663 | $278 | $3,341 | $100,228 |
| 8 | Colorado | 6.75% | 7.74% | 0.99 | $407,269 | $2,642 | $2,915 | $273 | $3,280 | $98,413 |
| 9 | Virginia | 6.69% | 7.79% | 1.10 | $357,937 | $2,307 | $2,574 | $267 | $3,203 | $96,084 |
| 10 | Nevada | 6.83% | 7.87% | 1.04 | $368,780 | $2,412 | $2,673 | $261 | $3,133 | $93,992 |
| 11 | Rhode Island | 6.76% | 7.79% | 1.03 | $357,369 | $2,320 | $2,570 | $250 | $2,998 | $89,950 |
| 12 | Connecticut | 6.77% | 7.78% | 1.01 | $354,425 | $2,304 | $2,547 | $243 | $2,916 | $87,476 |
| 13 | Oregon | 6.82% | 7.78% | 0.96 | $355,552 | $2,323 | $2,555 | $232 | $2,783 | $83,491 |
| 14 | Minnesota | 6.64% | 7.79% | 1.15 | $296,278 | $1,900 | $2,131 | $231 | $2,769 | $83,063 |
| 15 | North Carolina | 6.78% | 7.86% | 1.08 | $311,551 | $2,027 | $2,256 | $229 | $2,745 | $82,364 |
| 16 | Georgia | 6.82% | 7.88% | 1.06 | $312,955 | $2,044 | $2,270 | $226 | $2,710 | $81,299 |
| 17 | New Hampshire | 6.89% | 7.83% | 0.94 | $350,298 | $2,305 | $2,529 | $224 | $2,691 | $80,730 |
| 18 | Arizona | 6.84% | 7.78% | 0.94 | $350,277 | $2,293 | $2,517 | $224 | $2,686 | $80,572 |
| 19 | Idaho | 6.87% | 7.83% | 0.96 | $337,882 | $2,219 | $2,439 | $221 | $2,650 | $79,492 |
| 20 | Montana | 6.89% | 7.82% | 0.93 | $341,988 | $2,250 | $2,467 | $217 | $2,599 | $77,962 |
| 21 | Florida | 6.86% | 7.83% | 0.97 | $324,268 | $2,127 | $2,341 | $214 | $2,569 | $77,072 |
| 22 | Texas | 6.75% | 7.75% | 1.00 | $311,583 | $2,021 | $2,232 | $211 | $2,536 | $76,068 |
| 23 | South Carolina | 6.82% | 7.87% | 1.05 | $293,858 | $1,920 | $2,130 | $210 | $2,520 | $75,600 |
| 24 | South Dakota | 6.70% | 7.84% | 1.14 | $269,509 | $1,739 | $1,948 | $209 | $2,502 | $75,060 |
| 25 | Alaska | 6.74% | 7.65% | 0.91 | $337,670 | $2,188 | $2,396 | $208 | $2,495 | $74,858 |
| 26 | Wyoming | 6.84% | 7.83% | 0.99 | $306,067 | $2,003 | $2,210 | $206 | $2,474 | $74,218 |
| 27 | Delaware | 6.86% | 7.83% | 0.97 | $308,332 | $2,022 | $2,226 | $204 | $2,443 | $73,285 |
| 28 | Tennessee | 6.89% | 7.86% | 0.97 | $303,700 | $1,998 | $2,199 | $201 | $2,409 | $72,263 |
| 29 | Pennsylvania | 6.87% | 7.90% | 1.03 | $284,001 | $1,865 | $2,064 | $199 | $2,393 | $71,780 |
| 30 | North Dakota | 6.77% | 7.85% | 1.08 | $270,808 | $1,760 | $1,959 | $199 | $2,385 | $71,564 |
| 31 | New Mexico | 6.89% | 7.86% | 0.97 | $299,824 | $1,973 | $2,171 | $198 | $2,378 | $71,341 |
| 32 | Wisconsin | 6.69% | 7.80% | 1.11 | $262,600 | $1,693 | $1,890 | $198 | $2,371 | $71,143 |
| 33 | Illinois | 6.90% | 7.85% | 0.95 | $303,111 | $1,996 | $2,193 | $196 | $2,355 | $70,639 |
| 34 | Nebraska | 6.72% | 7.82% | 1.10 | $261,766 | $1,693 | $1,888 | $195 | $2,345 | $70,348 |
| 35 | Maine | 6.92% | 7.84% | 0.92 | $294,022 | $1,940 | $2,125 | $184 | $2,212 | $66,373 |
| 36 | Vermont | 6.89% | 7.86% | 0.97 | $276,973 | $1,822 | $2,005 | $183 | $2,197 | $65,905 |
| 37 | New York | 7.03% | 7.76% | 0.73 | $367,188 | $2,450 | $2,633 | $183 | $2,194 | $65,812 |
| 38 | Ohio | 6.85% | 7.91% | 1.06 | $249,708 | $1,636 | $1,817 | $180 | $2,165 | $64,944 |
| 39 | Alabama | 6.91% | 7.93% | 1.02 | $254,394 | $1,677 | $1,854 | $177 | $2,125 | $63,760 |
| 40 | Missouri | 6.80% | 7.83% | 1.03 | $249,216 | $1,625 | $1,799 | $175 | $2,094 | $62,824 |
| 41 | Kansas | 6.95% | 7.91% | 0.96 | $256,594 | $1,699 | $1,867 | $168 | $2,018 | $60,552 |
| 42 | Oklahoma | 6.96% | 7.92% | 0.96 | $253,141 | $1,677 | $1,843 | $166 | $1,992 | $59,760 |
| 43 | Michigan | 6.98% | 7.92% | 0.94 | $248,621 | $1,651 | $1,810 | $160 | $1,917 | $57,496 |
| 44 | Iowa | 6.86% | 7.84% | 0.98 | $231,034 | $1,515 | $1,670 | $154 | $1,850 | $55,490 |
| 45 | Arkansas | 7.04% | 7.98% | 0.94 | $234,846 | $1,569 | $1,720 | $151 | $1,814 | $54,428 |
| 46 | Indiana | 7.04% | 7.93% | 0.89 | $244,240 | $1,632 | $1,780 | $149 | $1,785 | $53,546 |
| 47 | Kentucky | 7.04% | 7.89% | 0.85 | $239,426 | $1,599 | $1,739 | $139 | $1,670 | $50,098 |
| 48 | Mississippi | 7.07% | 7.95% | 0.88 | $229,724 | $1,539 | $1,678 | $138 | $1,662 | $49,846 |
| 49 | West Virginia | 7.11% | 8.00% | 0.89 | $211,642 | $1,424 | $1,553 | $129 | $1,551 | $46,519 |
| 50 | Louisiana | 7.17% | 7.90% | 0.73 | $247,469 | $1,675 | $1,799 | $124 | $1,486 | $44,586 |
APRs vary widely
The reason for these savings? The gap between the highest and lowest APRs. On average, that gap is 0.99 percentage points.
Because of that difference, Schulz believes a good credit score is absolutely crucial when shopping for a mortgage.
“There’s little in life that is more expensive than having crummy credit,” he says. “It can cost you a small fortune over your lifetime in the form of high interest rates, increased fees and other less-than-favorable loan terms. The stakes are the highest when you’re applying for a mortgage, but bad credit is costly when considering credit cards, auto loans, personal loans and other financial tools as well.”
The difference in percentage points varies by state. The states with the highest spread are:
- Minnesota (1.15 percentage points)
- South Dakota (1.14)
- Wisconsin and Maryland (1.11 for both)
In 20 states, the APR difference is higher than 1.00 percentage points. On the other hand, New York and Louisiana have the smallest spread (0.73 for both), followed by Kentucky and Hawaii (0.85 for both) and Mississippi (0.88).
Since mortgage rates can vary significantly among lenders, it’s wise not to settle for the first offer you receive. For every $100,000 borrowed, shopping for a better rate could save the average borrower more than $24,000 over 30 years, based on the nationwide average difference between the lowest and highest APR offered to homebuyers.
Finding the best mortgage rate: Top expert tips
Shopping for a home is stressful enough, but it’s crucial to take the time to shop around for a good loan. We offer the following advice:
- Cast a wide net when shopping around. “Don’t just compare the big megabanks,” Schulz says. “You’re doing yourself a disservice if you don’t look at offers from smaller banks, credit unions, independent mortgage companies and others. LendingTree can help with that.”
- Consider shorter loan terms. “If you’re interested in a lower mortgage rate, opting for a 15-year mortgage can get you there,” he says. “It’s important to understand that this type of loan will likely bring a higher monthly payment than the traditional 30-year mortgage, but if you can swing it, the savings can be substantial.”
- Boost your credit score before applying. Your credit score plays a major role in the mortgage rates you’re offered. Taking a few months to pay down debt, avoid new credit inquiries and make on-time payments can really help out — and potentially save you thousands over the life of your loan.
Methodology
LendingTree analyzed data from more than 80,000 users of LendingTree’s online loan marketplace who received two or more offers for 30-year, fixed-rate mortgages from lenders between Jan. 1 and April 30, 2025. We analyzed the spread between the lowest and highest APRs offered to individual users in each state (excluding D.C.), only including users who received two or more loan offers. For each state, we calculated the following:
- The average of the lowest APRs offered to borrowers
- The average of the highest APRs offered to borrowers
Using these averages, we estimated the monthly payments based on the average mortgage amount requested in each state. The difference between the payments at the high and low rates indicates how much a borrower could save by choosing a lower APR. We then converted these monthly savings into annual and lifetime savings.
To avoid distortion by outliers, we averaged the lowest and highest APRs received by each individual user instead of comparing a single lowest and highest APR in each state.
View mortgage loan offers from up to 5 lenders in minutes