LendingTree Study Finds Black Homebuyers Are More Likely to Take Out High-Cost Loans
In recent months, mortgage rates have hovered around record lows. Lower rates usually result in smaller monthly payments and greater savings. However, not all consumers can take advantage of low rates. Depending on factors like their income, employment history and credit score, the rates that some borrowers receive may be significantly higher than record lows.
Black homebuyers are more likely to be saddled with higher rates than other homebuyers, hitting their wallets the hardest.
To demonstrate how the rates offered to Black homebuyers are often higher than rates offered to homebuyers of other races and ethnicities, LendingTree used data from the Home Mortgage Disclosure Act, or HMDA, to look at the share of Black homebuyers and owners who received “high-cost” mortgage purchase and refinance loans in 2019.
A “high-cost mortgage” refers to home loans with an APR higher than the benchmark Average Prime Offer Rate (APOR), as defined by the Federal Financial Institutions Examination Council (FFIEC). The APOR changes over time*, depending on what rates in a given period are.
In analyzing these high-cost loans, LendingTree found that Black borrowers are much more likely to receive high-cost loans than the overall population in many of the nation’s largest metros.
Key findings
- In all 50 of the metros looked at in LendingTree’s study, Black homebuyers are more likely to receive high-cost purchase loans than the overall population. The average spread between the overall share of high-cost mortgage loans and the share of high-priced mortgage loans for Black buyers is 8.99%.
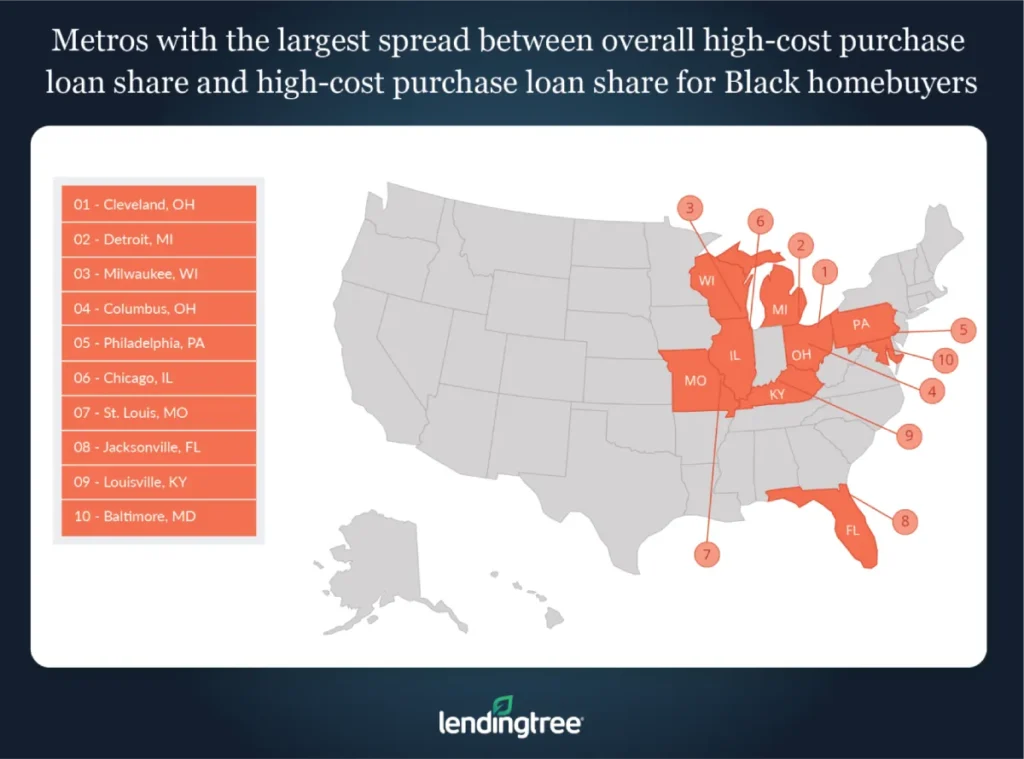
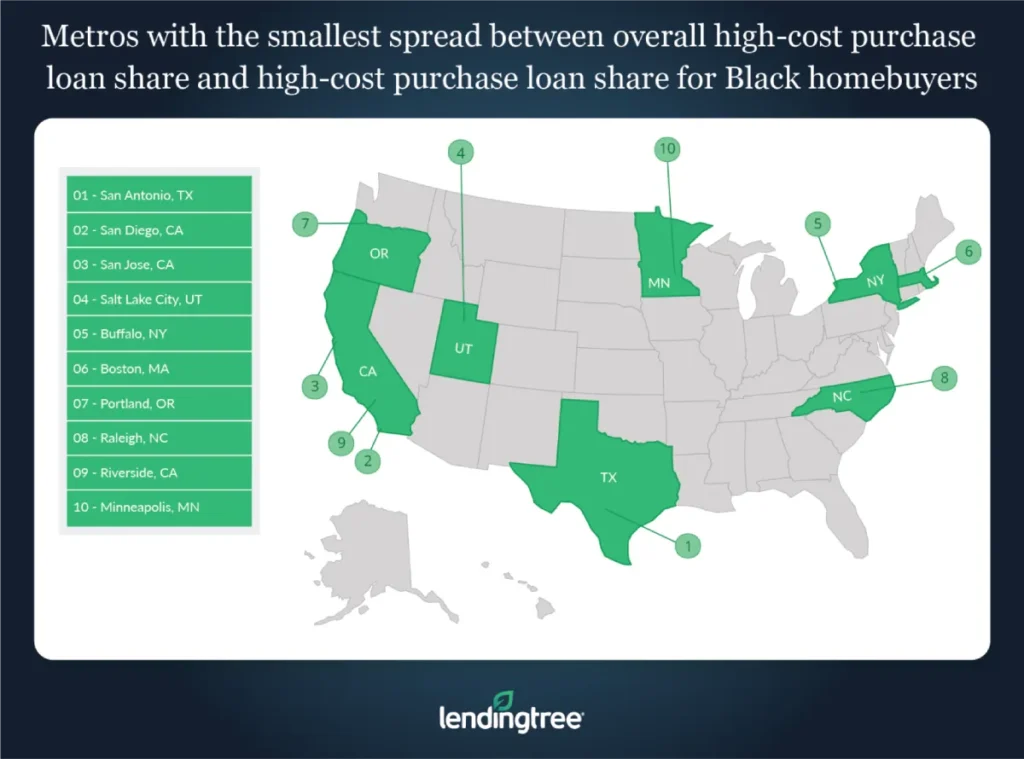
- Cleveland, Detroit and Milwaukee are the metros with the widest spread between the overall share of high-cost mortgage loans and the share of high-cost mortgage loans taken out by Black homeowners. Meanwhile, San Antonio, San Diego and San Jose, Calif. are the metros with the smallest gap. The average spread in the metros with the widest gap is 16.4%, compared with only 1.6% in metros where the gap is narrowest.
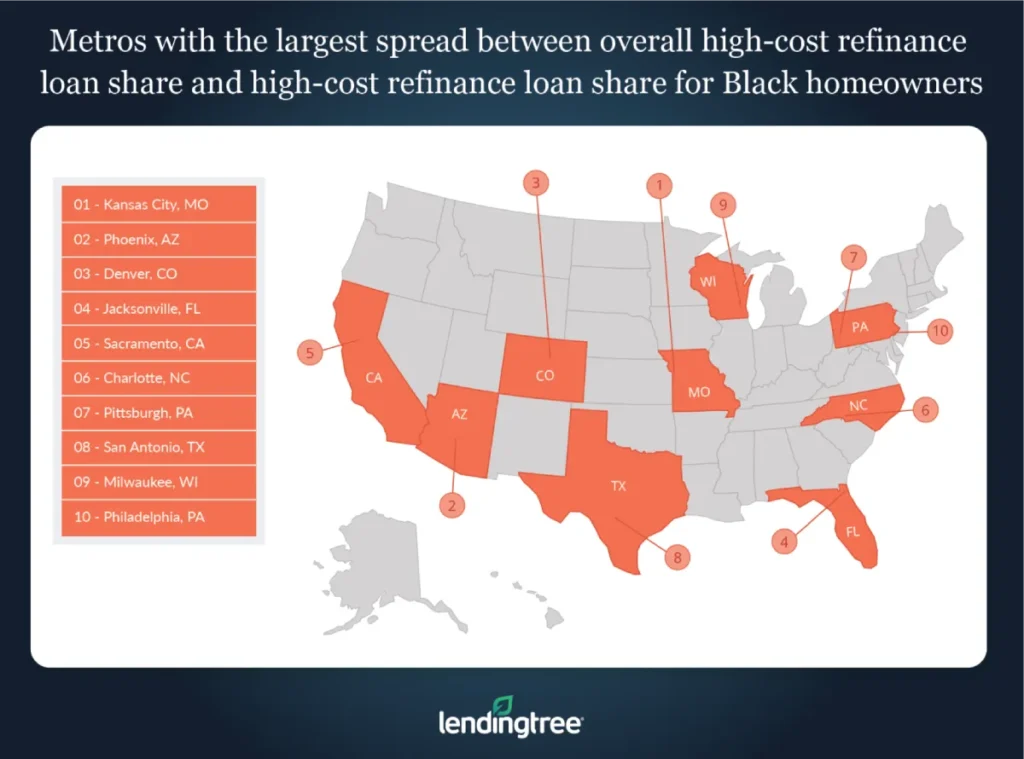
- For mortgage refinances, high-priced loans are less common but they still exist. In Kansas City, Mo., Phoenix and Denver, the spread between the overall share of high-cost refinance loans and the share of high-cost refinances loans taken out by Black homeowners is the widest. In these three metros, the average spread is 4.8%, which suggests that both Black and non-Black homeowners are unlikely to take out a high-cost refinance loan.
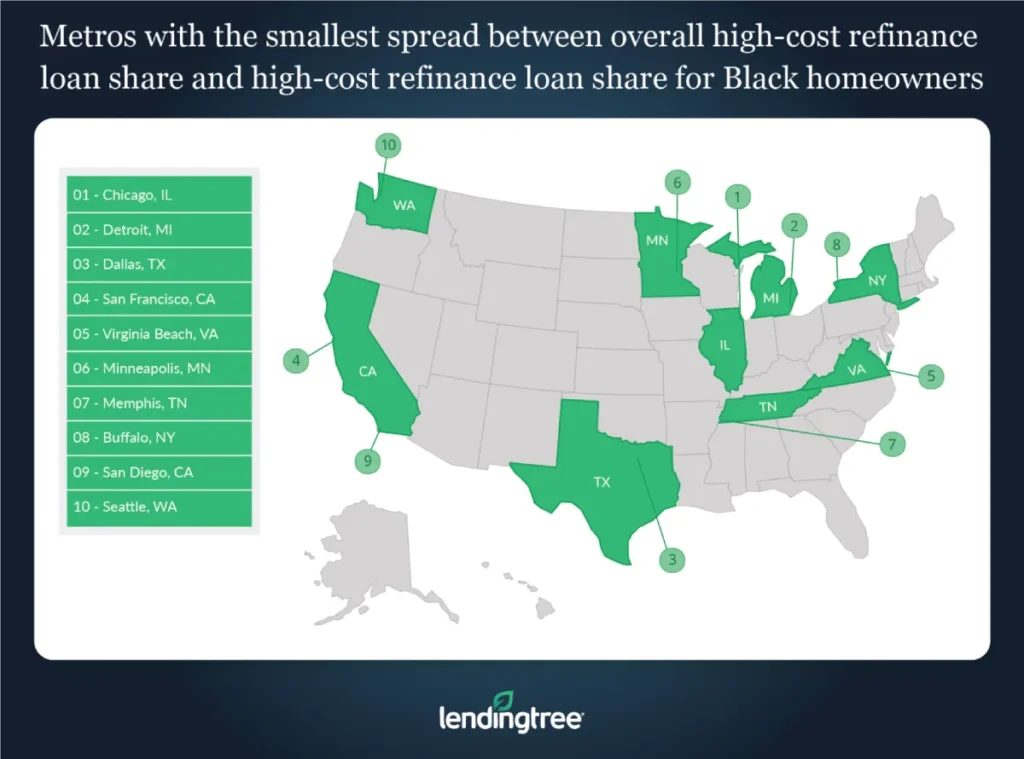
- Surprisingly, there are 2 metros where Black homeowners are less likely to receive a high-cost refinance: Chicago and Detroit. In Detroit, the share of Black homeowners who take out high-cost refinance loans is 0.05% lower than that of the overall population. In Chicago, they are 0.41% less likely.
- On the county level, the disparity between the share of Black homebuyers and refinance borrowers and the share of the overall population who receive high-priced loans can be extreme. In some counties, 100% of Black borrowers receive both high-cost purchase or refinance loans, even if those counties have relatively large Black populations. As a result, spreads in some counties are more than 90%. However, there are some counties where Black borrowers are less likely to receive a high-cost loan than the overall population.
Metros with largest spread between overall share of high-cost mortgage loans and share of high-cost mortgage purchase loans taken out by Black homebuyers
No. 1: Cleveland
- Overall share of mortgage loans that are high cost: 9.46%
- Share of high-cost mortgage loans taken out by Black homebuyers: 26.56%
- Spread between the overall share of high-cost mortgage loans and the share of high-cost mortgage loans taken out by Black homebuyers: 17.10%
No. 2: Detroit
- Overall share of mortgage loans that are high cost: 9.90%
- Share of high-cost mortgage loans taken out by Black homebuyers: 26.53%
- Spread between the overall share of high-cost mortgage loans and the share of high-cost mortgage loans taken out by Black homebuyers: 16.63%
No. 3: Milwaukee
- Overall share of mortgage loans that are high cost: 5.08%
- Share of high-cost mortgage loans taken out by Black homebuyers: 20.48%
- Spread between the overall share of high-cost mortgage loans and the share of high-cost mortgage loans taken out by Black homebuyers: 15.41%
Metros with smallest spread between overall share of high-cost mortgage loans and share of high-cost mortgage loans taken out by Black homebuyers
No. 1: San Antonio
- Overall share of mortgage loans that are high cost: 9.94%
- Share of high-cost mortgage loans taken out by Black homebuyers: 10.48%
- Spread between the overall share of high-cost mortgage loans and the share of high-cost mortgage loans taken out by Black homebuyers: 0.54%
No. 2: San Diego
- Overall share of mortgage loans that are high cost: 2.80%
- Share of high-cost mortgage loans taken out by Black homebuyers: 10.48%
- Spread between the overall share of high-cost mortgage loans and the share of high-cost mortgage loans taken out by Black homebuyers: 1.59%
No. 3: San Jose, Calif.
- Overall share of mortgage loans that are high-cost: 1.92%
- Share of high-cost mortgage loans taken out by Black homebuyers: 4.49%
- Spread between the overall share of high-cost mortgage loans and the share of high-cost mortgage loans taken out by Black homebuyers: 2.57%
Metros with largest spread between overall share of high-priced mortgage refinance loans and share of high-priced mortgage refinance loans taken out by Black homeowners
No. 1: Kansas City, Mo.
- Overall share of mortgage refinance loans that are high cost: 2.79%
- Share of high-cost mortgage refinance loans taken out by Black homeowners: 7.87%
- Spread between the overall share of high-cost mortgage mortgage refinance loans and the share of high-cost mortgage refinance loans taken out by Black homeowners: 5.08%
No. 2: Phoenix
- Overall share of mortgage refinance loans that are high cost: 1.78%
- Share of high-cost mortgage refinance loans taken out by Black homeowners: 6.84%
- Spread between the overall share of high-cost mortgage mortgage refinance loans and the share of high-cost mortgage refinance loans taken out by Black homeowners: 5.07%
No. 3: Denver
- Overall share of mortgage refinance loans that are high cost: 3.90%
- Share of high-cost mortgage refinance loans taken out by Black homeowners: 8.08%
- Spread between the overall share of high-cost mortgage mortgage refinance loans and the share of high-cost mortgage refinance loans taken out by Black homeowners: 4.19%
Metros with smallest spread between overall share of high-cost mortgage refinance loans and share of high-cost mortgage refinance loans taken out by Black homeowners
No. 1: Chicago
- Overall share of mortgage refinance loans that are high cost: 1.90%
- Share of high-cost mortgage refinance loans taken out by Black homeowners: 1.49%
- Spread between the overall share of high-cost mortgage mortgage refinance loans and the share of high-cost mortgage refinance loans taken out by Black homeowners: -0.41%
No. 2: Detroit
- Overall share of mortgage refinance loans that are high cost: 1.02%
- Share of high-cost mortgage refinance loans taken out by Black homeowners: 0.97%
- Spread between the overall share of high-cost mortgage mortgage refinance loans and the share of high-cost mortgage refinance loans taken out by Black homeowners: –0.05%
No. 3: Dallas
- Overall share of mortgage refinance loans that are high cost: 3.92%
- Share of high-cost mortgage refinance loans taken out by Black homeowners: 4.22%
- Spread between the overall share of high-cost mortgage mortgage refinance loans and the share of high-cost mortgage refinance loans taken out by Black homeowners: 0.30%
Methodology
To conduct this study, LendingTree analyzed mortgage application records from the Federal Financial Institutions Examination Council’s Home Mortgage Disclosure Act 2020 data set, the most recent available, which includes mortgage applications made during 2019.
*How much higher the annual percentage rate (APR) must be than the APOR depends on the type of mortgage loans. For first-lien mortgages, the APR must be 1.5 percentage points or higher; for jumbo loans, it must be 2.5 percentage points or higher; and for second-lien mortgages, the APR must be 3.5 percentage points or higher.
LendingTree research analyst Jacob Channel contributed to this study.
View mortgage loan offers from up to 5 lenders in minutes