Property Taxes Rose in Every Large US Metro Between 2021 and 2023


Becoming a homeowner is an exciting milestone, but it comes with less glamorous baggage: property taxes.
According to a LendingTree analysis, median property taxes in the U.S. rose by an average of 10.4% between 2021 and 2023 (the latest year of available data). And property taxes vary significantly across the 50 largest metros, ranging from $1,091 to $9,937.
Here’s what we found.
Key findings
- Homeowners pay a median property tax of $2,969 annually, or about $247 a month. Homeowners without a mortgage pay a median of $2,474 in property taxes, while those with a mortgage pay a higher median of $3,343 — $869 more.
- Property taxes increased in each of the 50 largest metros between 2021 and 2023. In 11 metros, the increase was lower than the national average of 10.4%. The three metros with the lowest increases are Pittsburgh (4.4%), Philadelphia (8.2%) and Milwaukee (8.3%). In contrast, Tampa, Fla. (23.3%), Indianapolis (19.8%) and Dallas (19.0%) saw the highest property tax increases.
- Among the 50 largest metros, Birmingham, Ala., has the lowest median property taxes at $1,091. Memphis, Tenn., and Louisville, Ky., follow at $1,856 and $1,912, respectively. Despite both being among the lowest, Birmingham’s property taxes are 41.2% lower than Memphis’.
- New York, San Jose, Calif., and San Francisco have the highest median property taxes. The median amounts: New York ($9,937), San Jose ($9,554) and San Francisco ($8,156). Among the 10 metros with the highest property taxes, four are in California and two are in Texas.
- Among the large metros, Birmingham and Phoenix pay the smallest percentage of their home value in property taxes. Homeowners in these metros each have an effective tax rate of 0.48%, ahead of Las Vegas and Denver at 0.50%. Conversely, the highest rates are in Buffalo, N.Y. (2.11%), Chicago (2.08%) and Cleveland (1.74%).
Median property taxes in U.S. are $2,969 annually
Across the U.S., homeowners pay a median property tax of $2,969 annually. That’s $247 a month.
Those with a mortgage pay significantly more than those without a mortgage. Homeowners with a mortgage pay a median of $3,343, while homeowners without pay $2,474, or $869 less.
“It may not seem like an earth-shattering amount of money, but that equates to about $70 to $75 a month that can’t go toward paying bills or reaching other financial goals,” says Matt Schulz, LendingTree chief consumer finance analyst and author of “Ask Questions, Save Money, Make More: How to Take Control of Your Financial Life.” “It’s an even bigger deal when you also have a mortgage.”
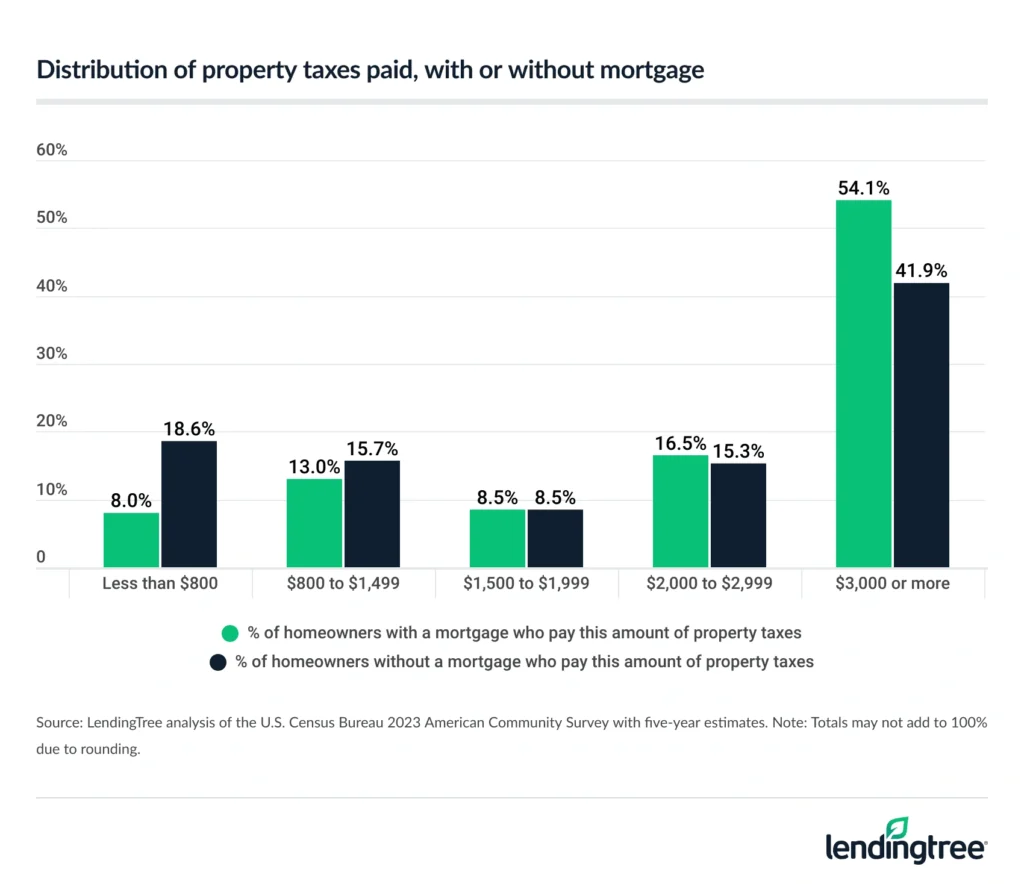
Households without a mortgage are 2.3 times more likely to pay less than $800 in property taxes than households with a mortgage. While 18.6% of mortgage-free households pay less than $800, just 8.0% of mortgage holders do.
More than half (54.1%) of American households with a mortgage pay $3,000 or more in property taxes, versus a smaller 41.9% of households without a mortgage.
Property taxes rose in all large metros
Property taxes rose by an average of 10.4% nationally between 2021 and 2023, largely driven by rising home prices in the same time frame.
In 11 of the 50 largest U.S. metros, the increase was lower than the national average of 10.4%. Pittsburgh saw the smallest increase, rising 4.4%. Philadelphia (8.2%) and Milwaukee (8.3%) followed.
Conversely, property taxes in Tampa, Fla., jumped by a significant 23.3% — the largest by metro. As a state without income tax, Florida relies on property and sales taxes to fund projects. And those taxes will continue to rise: In 2024, voters in Hillsborough County — which includes Tampa — OK’d a property tax increase of $1 per every $1,000 in assessed value to improve teacher pay and school programs.
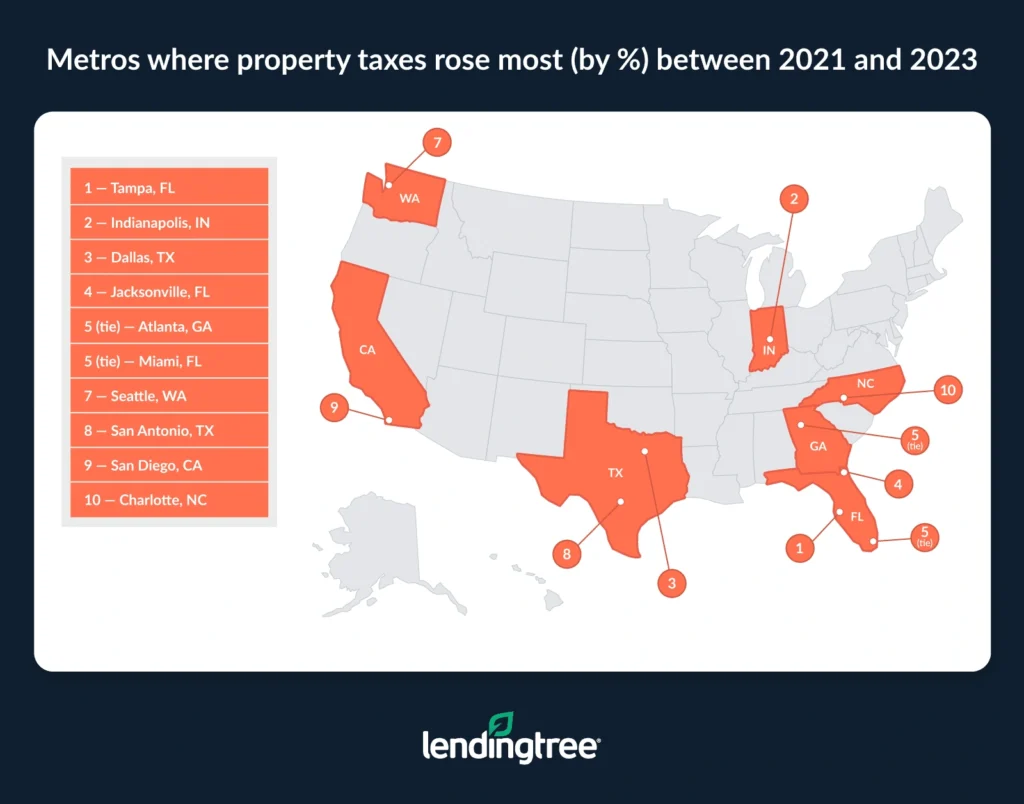
Indianapolis (19.8%) and Dallas (19.0%) saw the next biggest property tax jumps between 2021 and 2023.
This would have put strain on some homeowners, Schulz says.
“Most people’s financial margin for error is so small right now, thanks to inflation and the general cost of life, that any increase may become even more difficult to manage,” he says. “And these types of increases aren’t things you can cancel like a Netflix subscription, so it’ll likely require some sacrifice to handle it.”
Full rankings: Metros with largest/smallest % increase in median property taxes paid, 2021 to 2023
| Rank | Metro | Property taxes, 2023 | Property taxes, 2022 | Property taxes, 2021 | % change, 2021 to 2023 |
|---|---|---|---|---|---|
| 1 | Tampa, FL | $2,385 | $2,185 | $1,935 | 23.3% |
| 2 | Indianapolis, IN | $2,029 | $1,867 | $1,694 | 19.8% |
| 3 | Dallas, TX | $5,589 | $5,266 | $4,695 | 19.0% |
| 4 | Jacksonville, FL | $2,401 | $2,256 | $2,022 | 18.7% |
| 5 | Atlanta, GA | $2,738 | $2,560 | $2,308 | 18.6% |
| 5 | Miami, FL | $3,570 | $3,315 | $3,011 | 18.6% |
| 7 | Seattle, WA | $5,832 | $5,543 | $4,927 | 18.4% |
| 8 | San Antonio, TX | $4,331 | $4,086 | $3,664 | 18.2% |
| 9 | San Diego, CA | $5,542 | $5,214 | $4,697 | 18.0% |
| 10 | Charlotte, NC | $2,205 | $2,047 | $1,875 | 17.6% |
| 11 | Orlando, FL | $2,592 | $2,458 | $2,213 | 17.1% |
| 12 | San Francisco, CA | $8,156 | $7,721 | $7,000 | 16.5% |
| 12 | San Jose, CA | $9,554 | $9,062 | $8,200 | 16.5% |
| 14 | Los Angeles, CA | $5,621 | $5,321 | $4,829 | 16.4% |
| 15 | Salt Lake City, UT | $2,701 | $2,562 | $2,329 | 16.0% |
| 15 | Sacramento, CA | $4,254 | $4,023 | $3,666 | 16.0% |
| 17 | Denver, CO | $2,873 | $2,708 | $2,479 | 15.9% |
| 18 | Richmond, VA | $2,410 | $2,285 | $2,088 | 15.4% |
| 19 | Louisville, KY | $1,912 | $1,822 | $1,670 | 14.5% |
| 20 | Riverside, CA | $3,784 | $3,591 | $3,310 | 14.3% |
| 21 | Portland, OR | $4,643 | $4,482 | $4,064 | 14.2% |
| 22 | Oklahoma City, OK | $2,053 | $1,944 | $1,799 | 14.1% |
| 23 | Nashville, TN | $1,976 | $1,888 | $1,734 | 14.0% |
| 24 | Austin, TX | $6,973 | $6,688 | $6,128 | 13.8% |
| 25 | Raleigh, NC | $2,712 | $2,601 | $2,386 | 13.7% |
| 26 | Las Vegas, NV | $1,990 | $1,898 | $1,752 | 13.6% |
| 27 | Minneapolis, MN | $3,833 | $3,660 | $3,378 | 13.5% |
| 28 | Birmingham, AL | $1,091 | $1,076 | $962 | 13.4% |
| 28 | Houston, TX | $4,713 | $4,529 | $4,155 | 13.4% |
| 30 | Phoenix, AZ | $1,927 | $1,847 | $1,701 | 13.3% |
| 30 | Fresno, CA | $2,685 | $2,605 | $2,370 | 13.3% |
| 32 | Kansas City, MO | $2,921 | $2,793 | $2,603 | 12.2% |
| 33 | Columbus, OH | $3,835 | $3,677 | $3,422 | 12.1% |
| 34 | Washington, DC | $5,082 | $4,860 | $4,546 | 11.8% |
| 35 | Cincinnati, OH | $2,901 | $2,786 | $2,603 | 11.4% |
| 36 | Virginia Beach, VA | $2,652 | $2,547 | $2,386 | 11.1% |
| 37 | New York, NY | $9,937 | $9,614 | $8,951 | 11.0% |
| 38 | Grand Rapids, MI | $2,898 | $2,789 | $2,619 | 10.7% |
| 39 | Buffalo, NY | $4,432 | $4,310 | $4,012 | 10.5% |
| 40 | Detroit, MI | $3,292 | $3,197 | $2,985 | 10.3% |
| 41 | Boston, MA | $6,696 | $6,506 | $6,076 | 10.2% |
| 42 | St. Louis, MO | $2,828 | $2,755 | $2,580 | 9.6% |
| 43 | Providence, RI | $4,793 | $4,681 | $4,381 | 9.4% |
| 44 | Baltimore, MD | $3,833 | $3,734 | $3,507 | 9.3% |
| 44 | Chicago, IL | $6,266 | $6,090 | $5,734 | 9.3% |
| 46 | Memphis, TN | $1,856 | $1,815 | $1,704 | 8.9% |
| 47 | Cleveland, OH | $3,507 | $3,484 | $3,234 | 8.4% |
| 48 | Milwaukee, WI | $4,390 | $4,322 | $4,052 | 8.3% |
| 49 | Philadelphia, PA | $4,993 | $4,903 | $4,613 | 8.2% |
| 50 | Pittsburgh, PA | $2,776 | $2,780 | $2,658 | 4.4% |
Median property taxes range from $1,091 to $9,937
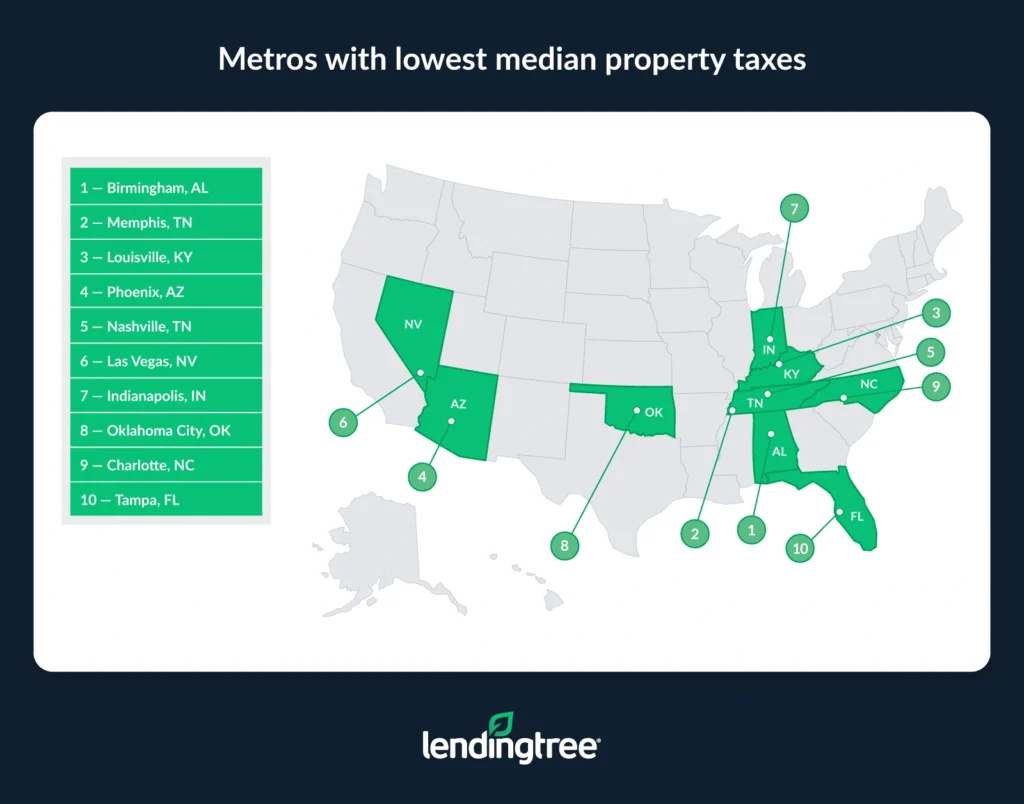
Looking at the metros with the lowest median property taxes, Birmingham, Ala., ranks first, at just $1,091. In a distant second, property taxes in Memphis, Tenn., are $1,856. Even as the two lowest, homeowners in Birmingham pay 41.2% less than those in Memphis.
Louisville, Ky. ($1,912), rounds out the top three.
All three metros are among those with the lowest median home values, according to a 2024 LendingTree analysis. Although Memphis has lower median home values than Birmingham, Alabama significantly limits the property tax hikes homeowners can face.
Conversely, New York homeowners pay the most in property taxes, at a whopping median of $9,937. San Jose ($9,554) and San Francisco ($8,156) follow. Among the 10 metros with the highest property taxes, four are in California (San Jose, San Francisco, Los Angeles and San Diego) and two are in Texas (Austin and Dallas).
That’s understandable, given that median home values in these areas are among the highest in the nation.
“Those states are known for their relatively high tax rates and housing prices,” Schulz says. “And as a homeowner in Austin, I can tell you I’m not surprised to find my metro near the top. Property taxes are super expensive here. As Austin has boomed in recent years, many people have moved here from California and other places because of relatively low housing prices, only to be unpleasantly surprised by the size of their yearly property tax bill. It’s a big deal.”
Homeowners with mortgages typically pay higher property taxes in nearly all metros, except for Seattle, Salt Lake City and Boston.
Full rankings: Metros with smallest/largest median property taxes
| Rank | Metro | Median paid on all homes | Median paid on homes with mortgages | Median paid on homes without mortgages |
|---|---|---|---|---|
| 1 | Birmingham, AL | $1,091 | $1,216 | $838 |
| 2 | Memphis, TN | $1,856 | $2,007 | $1,516 |
| 3 | Louisville, KY | $1,912 | $1,999 | $1,730 |
| 4 | Phoenix, AZ | $1,927 | $1,974 | $1,808 |
| 5 | Nashville, TN | $1,976 | $2,014 | $1,904 |
| 6 | Las Vegas, NV | $1,990 | $2,040 | $1,888 |
| 7 | Indianapolis, IN | $2,029 | $2,112 | $1,857 |
| 8 | Oklahoma City, OK | $2,053 | $2,287 | $1,667 |
| 9 | Charlotte, NC | $2,205 | $2,381 | $1,756 |
| 10 | Tampa, FL | $2,385 | $2,751 | $1,767 |
| 11 | Jacksonville, FL | $2,401 | $2,570 | $1,986 |
| 12 | Richmond, VA | $2,410 | $2,413 | $2,404 |
| 13 | Orlando, FL | $2,592 | $2,767 | $2,175 |
| 14 | Virginia Beach, VA | $2,652 | $2,660 | $2,632 |
| 15 | Fresno, CA | $2,685 | $2,869 | $2,223 |
| 16 | Salt Lake City, UT | $2,701 | $2,682 | $2,754 |
| 17 | Raleigh, NC | $2,712 | $2,775 | $2,504 |
| 18 | Atlanta, GA | $2,738 | $2,945 | $2,100 |
| 19 | Pittsburgh, PA | $2,776 | $3,060 | $2,428 |
| 20 | St. Louis, MO | $2,828 | $2,933 | $2,629 |
| 21 | Denver, CO | $2,873 | $2,922 | $2,738 |
| 22 | Grand Rapids, MI | $2,898 | $2,976 | $2,767 |
| 23 | Cincinnati, OH | $2,901 | $3,058 | $2,623 |
| 24 | Kansas City, MO | $2,921 | $3,051 | $2,695 |
| 25 | Detroit, MI | $3,292 | $3,596 | $2,821 |
| 26 | Cleveland, OH | $3,507 | $3,684 | $3,194 |
| 27 | Miami, FL | $3,570 | $3,942 | $2,975 |
| 28 | Riverside, CA | $3,784 | $4,181 | $2,774 |
| 29 | Minneapolis, MN | $3,833 | $3,857 | $3,777 |
| 29 | Baltimore, MD | $3,833 | $3,908 | $3,660 |
| 31 | Columbus, OH | $3,835 | $3,996 | $3,402 |
| 32 | Sacramento, CA | $4,254 | $4,579 | $3,388 |
| 33 | San Antonio, TX | $4,331 | $5,124 | $2,963 |
| 34 | Milwaukee, WI | $4,390 | $4,459 | $4,256 |
| 35 | Buffalo, NY | $4,432 | $4,752 | $3,933 |
| 36 | Portland, OR | $4,643 | $4,644 | $4,639 |
| 37 | Houston, TX | $4,713 | $5,573 | $3,478 |
| 38 | Providence, RI | $4,793 | $4,828 | $4,726 |
| 39 | Philadelphia, PA | $4,993 | $5,226 | $4,540 |
| 40 | Washington, DC | $5,082 | $5,086 | $5,068 |
| 41 | San Diego, CA | $5,542 | $6,119 | $3,929 |
| 42 | Dallas, TX | $5,589 | $6,294 | $4,086 |
| 43 | Los Angeles, CA | $5,621 | $6,259 | $4,109 |
| 44 | Seattle, WA | $5,832 | $5,810 | $5,891 |
| 45 | Chicago, IL | $6,266 | $6,552 | $5,679 |
| 46 | Boston, MA | $6,696 | $6,691 | $6,707 |
| 47 | Austin, TX | $6,973 | $7,368 | $5,997 |
| 48 | San Francisco, CA | $8,156 | $9,287 | $5,713 |
| 49 | San Jose, CA | $9,554 | $10,000+ | $6,346 |
| 50 | New York, NY | $9,937 | $10,000+ | $9,510 |
2 metros have effective tax rate of just 0.48%
Looking at property taxes as a percentage of home values, Birmingham and Phoenix tie for the lowest effective tax rate, at 0.48% for both. However, the median home value in Phoenix is significantly higher than that in Birmingham, at $401,400 and $226,200, respectively.
Las Vegas and Denver follow at 0.50%. While Las Vegas has a median home value of $400,800, Denver has a significantly higher median home value of $570,300.
Metros where homeowners pay smallest percentage of home value in property taxes
| Rank | Metro | Median home value, 2023 | Property taxes, 2023 | Effective tax rate |
|---|---|---|---|---|
| 1 | Birmingham, AL | $226,200 | $1,091 | 0.48% |
| 1 | Phoenix, AZ | $401,400 | $1,927 | 0.48% |
| 3 | Las Vegas, NV | $400,800 | $1,990 | 0.50% |
| 3 | Denver, CO | $570,300 | $2,873 | 0.50% |
Meanwhile, Buffalo, N.Y., has the highest effective tax rate at 2.11%, with a median home value of $209,600. Chicago (2.08% and $301,900) and Cleveland (1.74% and $201,000) follow.
Full rankings: Metros where homeowners pay smallest/highest percentage of home value in property taxes
| Rank | Metro | Median home value, 2023 | Property taxes, 2023 | Effective tax rate |
|---|---|---|---|---|
| 1 | Birmingham, AL | $226,200 | $1,091 | 0.48% |
| 1 | Phoenix, AZ | $401,400 | $1,927 | 0.48% |
| 3 | Las Vegas, NV | $400,800 | $1,990 | 0.50% |
| 3 | Denver, CO | $570,300 | $2,873 | 0.50% |
| 5 | Nashville, TN | $376,800 | $1,976 | 0.52% |
| 6 | Salt Lake City, UT | $478,200 | $2,701 | 0.56% |
| 7 | Los Angeles, CA | $825,300 | $5,621 | 0.68% |
| 8 | Charlotte, NC | $319,400 | $2,205 | 0.69% |
| 9 | San Diego, CA | $791,600 | $5,542 | 0.70% |
| 10 | Raleigh, NC | $381,000 | $2,712 | 0.71% |
| 10 | San Jose, CA | $1,342,700 | $9,554 | 0.71% |
| 12 | San Francisco, CA | $1,113,800 | $8,156 | 0.73% |
| 13 | Richmond, VA | $325,800 | $2,410 | 0.74% |
| 13 | Fresno, CA | $363,300 | $2,685 | 0.74% |
| 15 | Sacramento, CA | $559,000 | $4,254 | 0.76% |
| 16 | Orlando, FL | $338,500 | $2,592 | 0.77% |
| 16 | Riverside, CA | $493,600 | $3,784 | 0.77% |
| 18 | Tampa, FL | $306,100 | $2,385 | 0.78% |
| 18 | Jacksonville, FL | $308,900 | $2,401 | 0.78% |
| 20 | Memphis, TN | $228,100 | $1,856 | 0.81% |
| 20 | Louisville, KY | $236,400 | $1,912 | 0.81% |
| 22 | Atlanta, GA | $335,100 | $2,738 | 0.82% |
| 23 | Indianapolis, IN | $244,000 | $2,029 | 0.83% |
| 23 | Virginia Beach, VA | $318,000 | $2,652 | 0.83% |
| 25 | Seattle, WA | $673,500 | $5,832 | 0.87% |
| 26 | Miami, FL | $405,600 | $3,570 | 0.88% |
| 26 | Portland, OR | $526,500 | $4,643 | 0.88% |
| 28 | Washington, DC | $553,000 | $5,082 | 0.92% |
| 29 | Oklahoma City, OK | $214,700 | $2,053 | 0.96% |
| 30 | Baltimore, MD | $373,300 | $3,833 | 1.03% |
| 31 | Minneapolis, MN | $354,400 | $3,833 | 1.08% |
| 32 | Kansas City, MO | $265,400 | $2,921 | 1.10% |
| 32 | Boston, MA | $610,900 | $6,696 | 1.10% |
| 34 | Grand Rapids, MI | $261,600 | $2,898 | 1.11% |
| 35 | Cincinnati, OH | $240,200 | $2,901 | 1.21% |
| 36 | St. Louis, MO | $232,100 | $2,828 | 1.22% |
| 37 | Providence, RI | $385,900 | $4,793 | 1.24% |
| 38 | Pittsburgh, PA | $204,500 | $2,776 | 1.36% |
| 39 | Detroit, MI | $237,100 | $3,292 | 1.39% |
| 40 | Columbus, OH | $274,300 | $3,835 | 1.40% |
| 41 | Philadelphia, PA | $326,700 | $4,993 | 1.53% |
| 42 | Milwaukee, WI | $283,800 | $4,390 | 1.55% |
| 43 | Austin, TX | $434,800 | $6,973 | 1.60% |
| 44 | San Antonio, TX | $258,700 | $4,331 | 1.67% |
| 45 | Dallas, TX | $330,300 | $5,589 | 1.69% |
| 45 | New York, NY | $587,400 | $9,937 | 1.69% |
| 47 | Houston, TX | $275,200 | $4,713 | 1.71% |
| 48 | Cleveland, OH | $201,000 | $3,507 | 1.74% |
| 49 | Chicago, IL | $301,900 | $6,266 | 2.08% |
| 50 | Buffalo, NY | $209,600 | $4,432 | 2.11% |
Dealing with higher property tax rates: Top expert tips
Life is getting more expensive, and higher property taxes may be a tipping point for some homeowners feeling the financial pinch. To help offset those costs, Schulz recommends the following:
- Earn some interest on those tax payments. “This won’t work if your property tax payments are part of your mortgage payments, but for others, setting aside your estimated property tax amount in a high-yield savings account can be a great idea,” he says. “Returns are no longer at record highs, but they’re still often over 4%. That means that if you leave $3,000 in one of those accounts for a year, you’ll earn about $120 in interest for having done nothing more than being planful with that money and leaving it alone.”
- Make sure you’re getting all the property tax exemptions you’re qualified for. “Not everyone pays the same property taxes,” he says. “For example, those 65 and older may be partially exempt from property taxes in many areas. Some home improvements and homesteads qualify for tax exemptions as well. Do some Googling and see what you might qualify for.”
- Consider appealing your property tax assessment. If you believe your property taxes are higher than they should be, you can challenge the assessment with your local tax assessor. Look at comparable homes in your area to see if your home is assessed higher than others with similar features.
Methodology
LendingTree researchers analyzed the U.S. Census Bureau 2023, 2022 and 2021 American Community Surveys with five-year estimates to determine the median real estate tax paid for homes in the 50 largest U.S. metros.
Additionally, analysts calculated the effective tax rate by dividing the median property taxes paid by the median value of owner-occupied housing units.
The Census Bureau uses the term “real estate tax” to define a tax charged on an “entire property (land and buildings) payable to all taxing jurisdictions, including special assessments, school taxes, county taxes and so forth.”
Real estate taxes are often referred to as property taxes. The terms are used interchangeably in this study.
View mortgage loan offers from up to 5 lenders in minutes
Recommended Articles