Same-Sex Couples Who Live Together Thrive the Most in California, Florida


Some metros don’t just celebrate Pride — they help same-sex couples build a life.
That’s crucial, particularly because same-sex couples who live together in the 100 largest metros are 33.0% less likely to be married and 17.9% less likely to own homes than all cohabitating couples.
This LendingTree study looks at homeownership, marriage and cohabitation rates, and household income to find the metros where same-sex couples who live together are thriving. We’ll also go over homebuying tips for same-sex couples.
Key findings
- Across the 100 largest metros, same-sex couples who live together are 33.0% less likely to be married and 17.9% less likely to be homeowners than all cohabitating couples. Of note, cohabitating same-sex couples make 5.3% more on average, but that could partially be because they’re more likely to live in higher cost-of-living areas.
- Cohabitating same-sex couples thrive the most in California, Florida and New England. Riverside, Calif., has the highest overall score, ahead of San Francisco and North Port, Fla. Across the top 10 metros, three each are in California, Florida and New England.
- Provo, Utah, Wichita, Kan., and Knoxville, Tenn., rank last. Provo has the lowest homeownership rate among cohabitating same-sex couples and the largest gap in that rate compared to all cohabitating couples. Wichita has the second-lowest homeownership rate (and second-largest gap), and Knoxville has the lowest average household income (adjusted for cost of living) among these same-sex couples.
- Same-sex couples who live together in Florida are the most likely to be homeowners. 79.6% of cohabitating same-sex couples in North Port are homeowners — the highest by metro. Three of the top five metros are in Florida. Meanwhile, San Fran has the highest percentage of couples living together who are same-sex, at 3.1%.
- Adjusted for cost of living, cohabitating same-sex couples make the most in San Jose, Calif. Here, the average household income among these same-sex couples is $211,261. San Fran ($209,453) and Washington, D.C. ($200,072), follow.
Same-sex couples less likely to be married or own homes
Given the historic inequities same-sex couples face, it’s understandably more difficult for these couples to settle down together. When analyzing the 100 largest U.S. metros, we found that same-sex couples who live together are 33.0% less likely to be married. While 86.9% of all cohabitating couples are married, just 58.2% of cohabitating same-sex couples are.
Of course, that could be because some same-sex couples may not prioritize a traditional union like marriage, particularly because same-sex marriage was only legalized in 2015. Concerns about same-sex marriage protections may also give couples pause.
Perhaps more concerningly, same-sex couples are 17.9% less likely to be homeowners than all cohabitating couples. Just 61.5% of these cohabitating couples are homeowners, compared with 74.9% of all cohabitating couples.
There’s some good news, though: Cohabitating same-sex couples make 5.3% more on average, at $160,600 versus $152,446, but that could partially be because they’re more likely to live in higher cost-of-living areas. The metros with the most same-sex couples living together are New York, Los Angeles and Chicago, with San Francisco, Miami and Dallas not far behind.
100-metro look: All cohabitating couples vs. cohabitating same-sex couples
| All cohabitating couples | Cohabitating same-sex couples | Gap | |
|---|---|---|---|
| % who are married | 86.9% | 58.2% | -33.0% |
| Avg. household income | $152,446 | $160,600 | 5.3% |
| Homeownership rate | 74.9% | 61.5% | -17.9% |
California, Florida, New England same-sex couples thrive
Same-sex couples who live together thrive the most in one California metro: Riverside. Of note, cohabitating same-sex couples in the metro make 21.5% more than all cohabitating couples (the second-highest gap) and are 4.0% more likely to be homeowners (also the second-highest gap). The homeownership rate among cohabitating same-sex couples there is 75.4% — the sixth-highest.
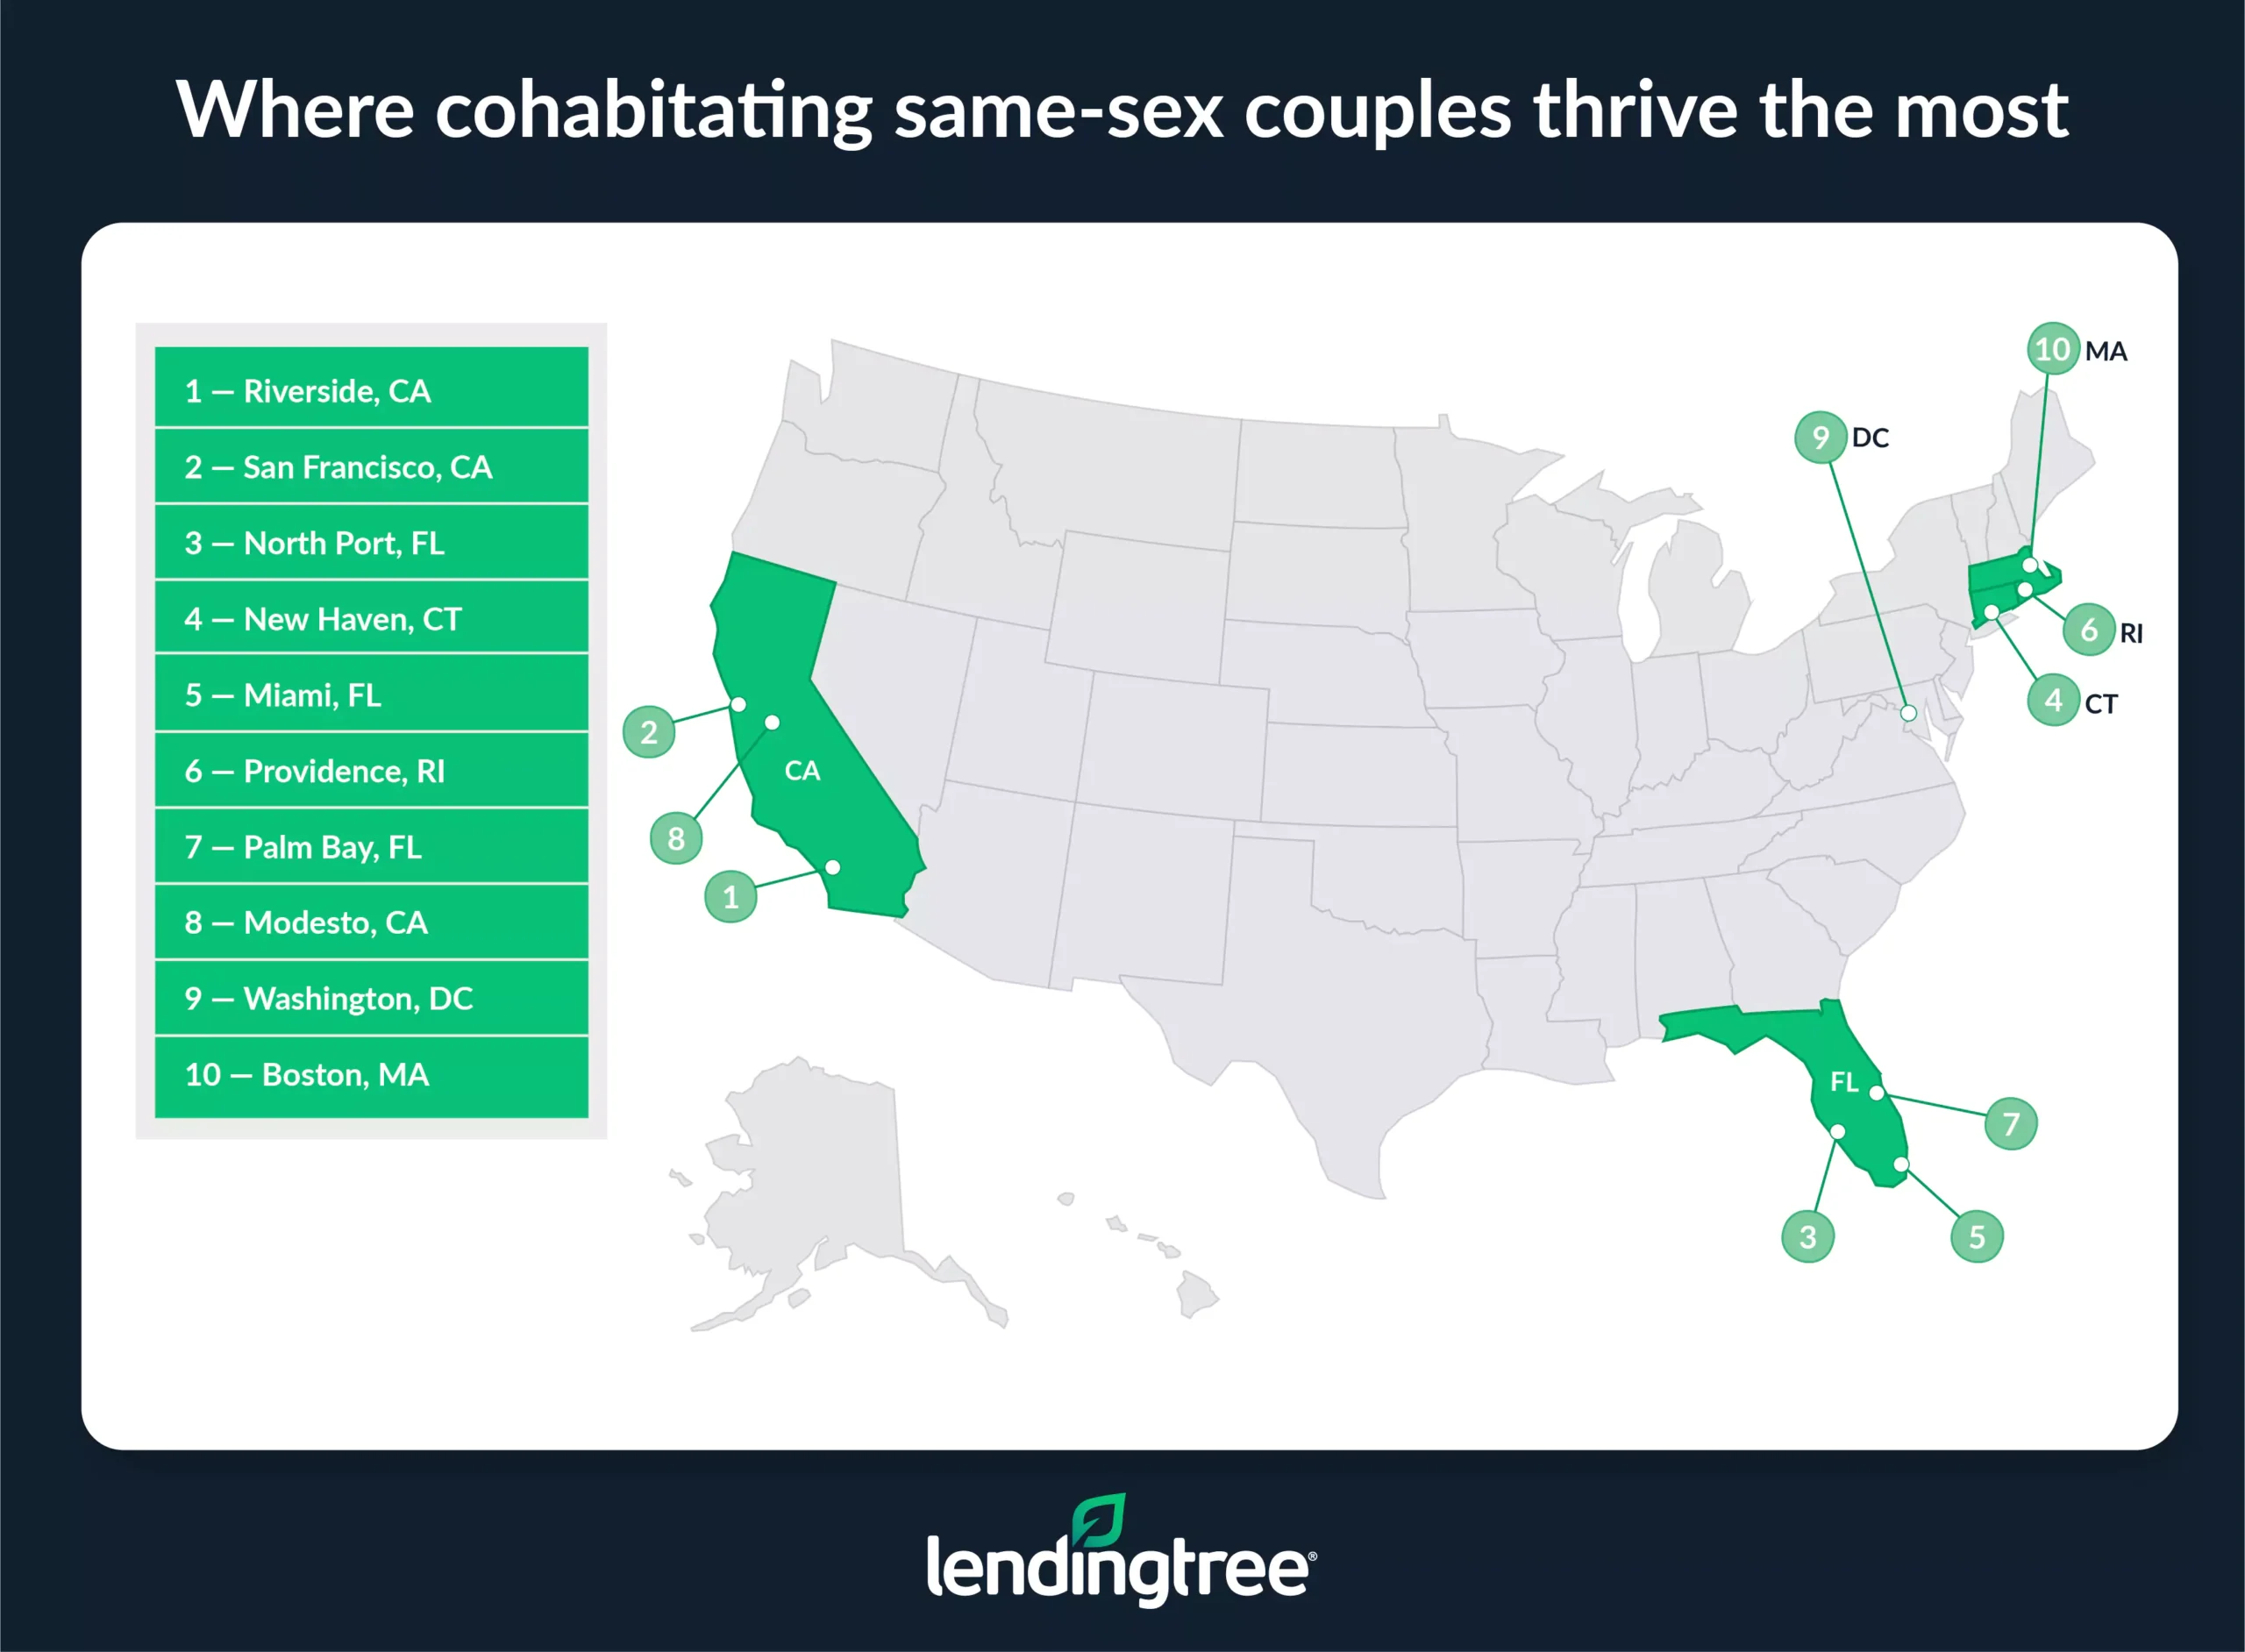
San Francisco ranks next, with the highest rate of couples living together who are same-sex (3.1%) and the second-highest average household income among these couples ($209,453 when adjusted for cost of living). It also has the fourth-highest number of cohabitating same-sex couples (29,551), though that’s not among the factors included in our rankings.
North Port, Fla., rounds out the top three, with the highest homeownership rate among cohabitating same-sex couples, at 79.6%.
California, Florida and New England each have three metros in the top 10.
Homeownership major factor in metros where same-sex couples don’t thrive
Conversely, same-sex couples in Provo, Utah, thrive the least. Of note, Provo has the lowest homeownership rate among cohabitating same-sex couples (37.0%) and the largest gap in that rate compared to all cohabitating couples (-51.0%).
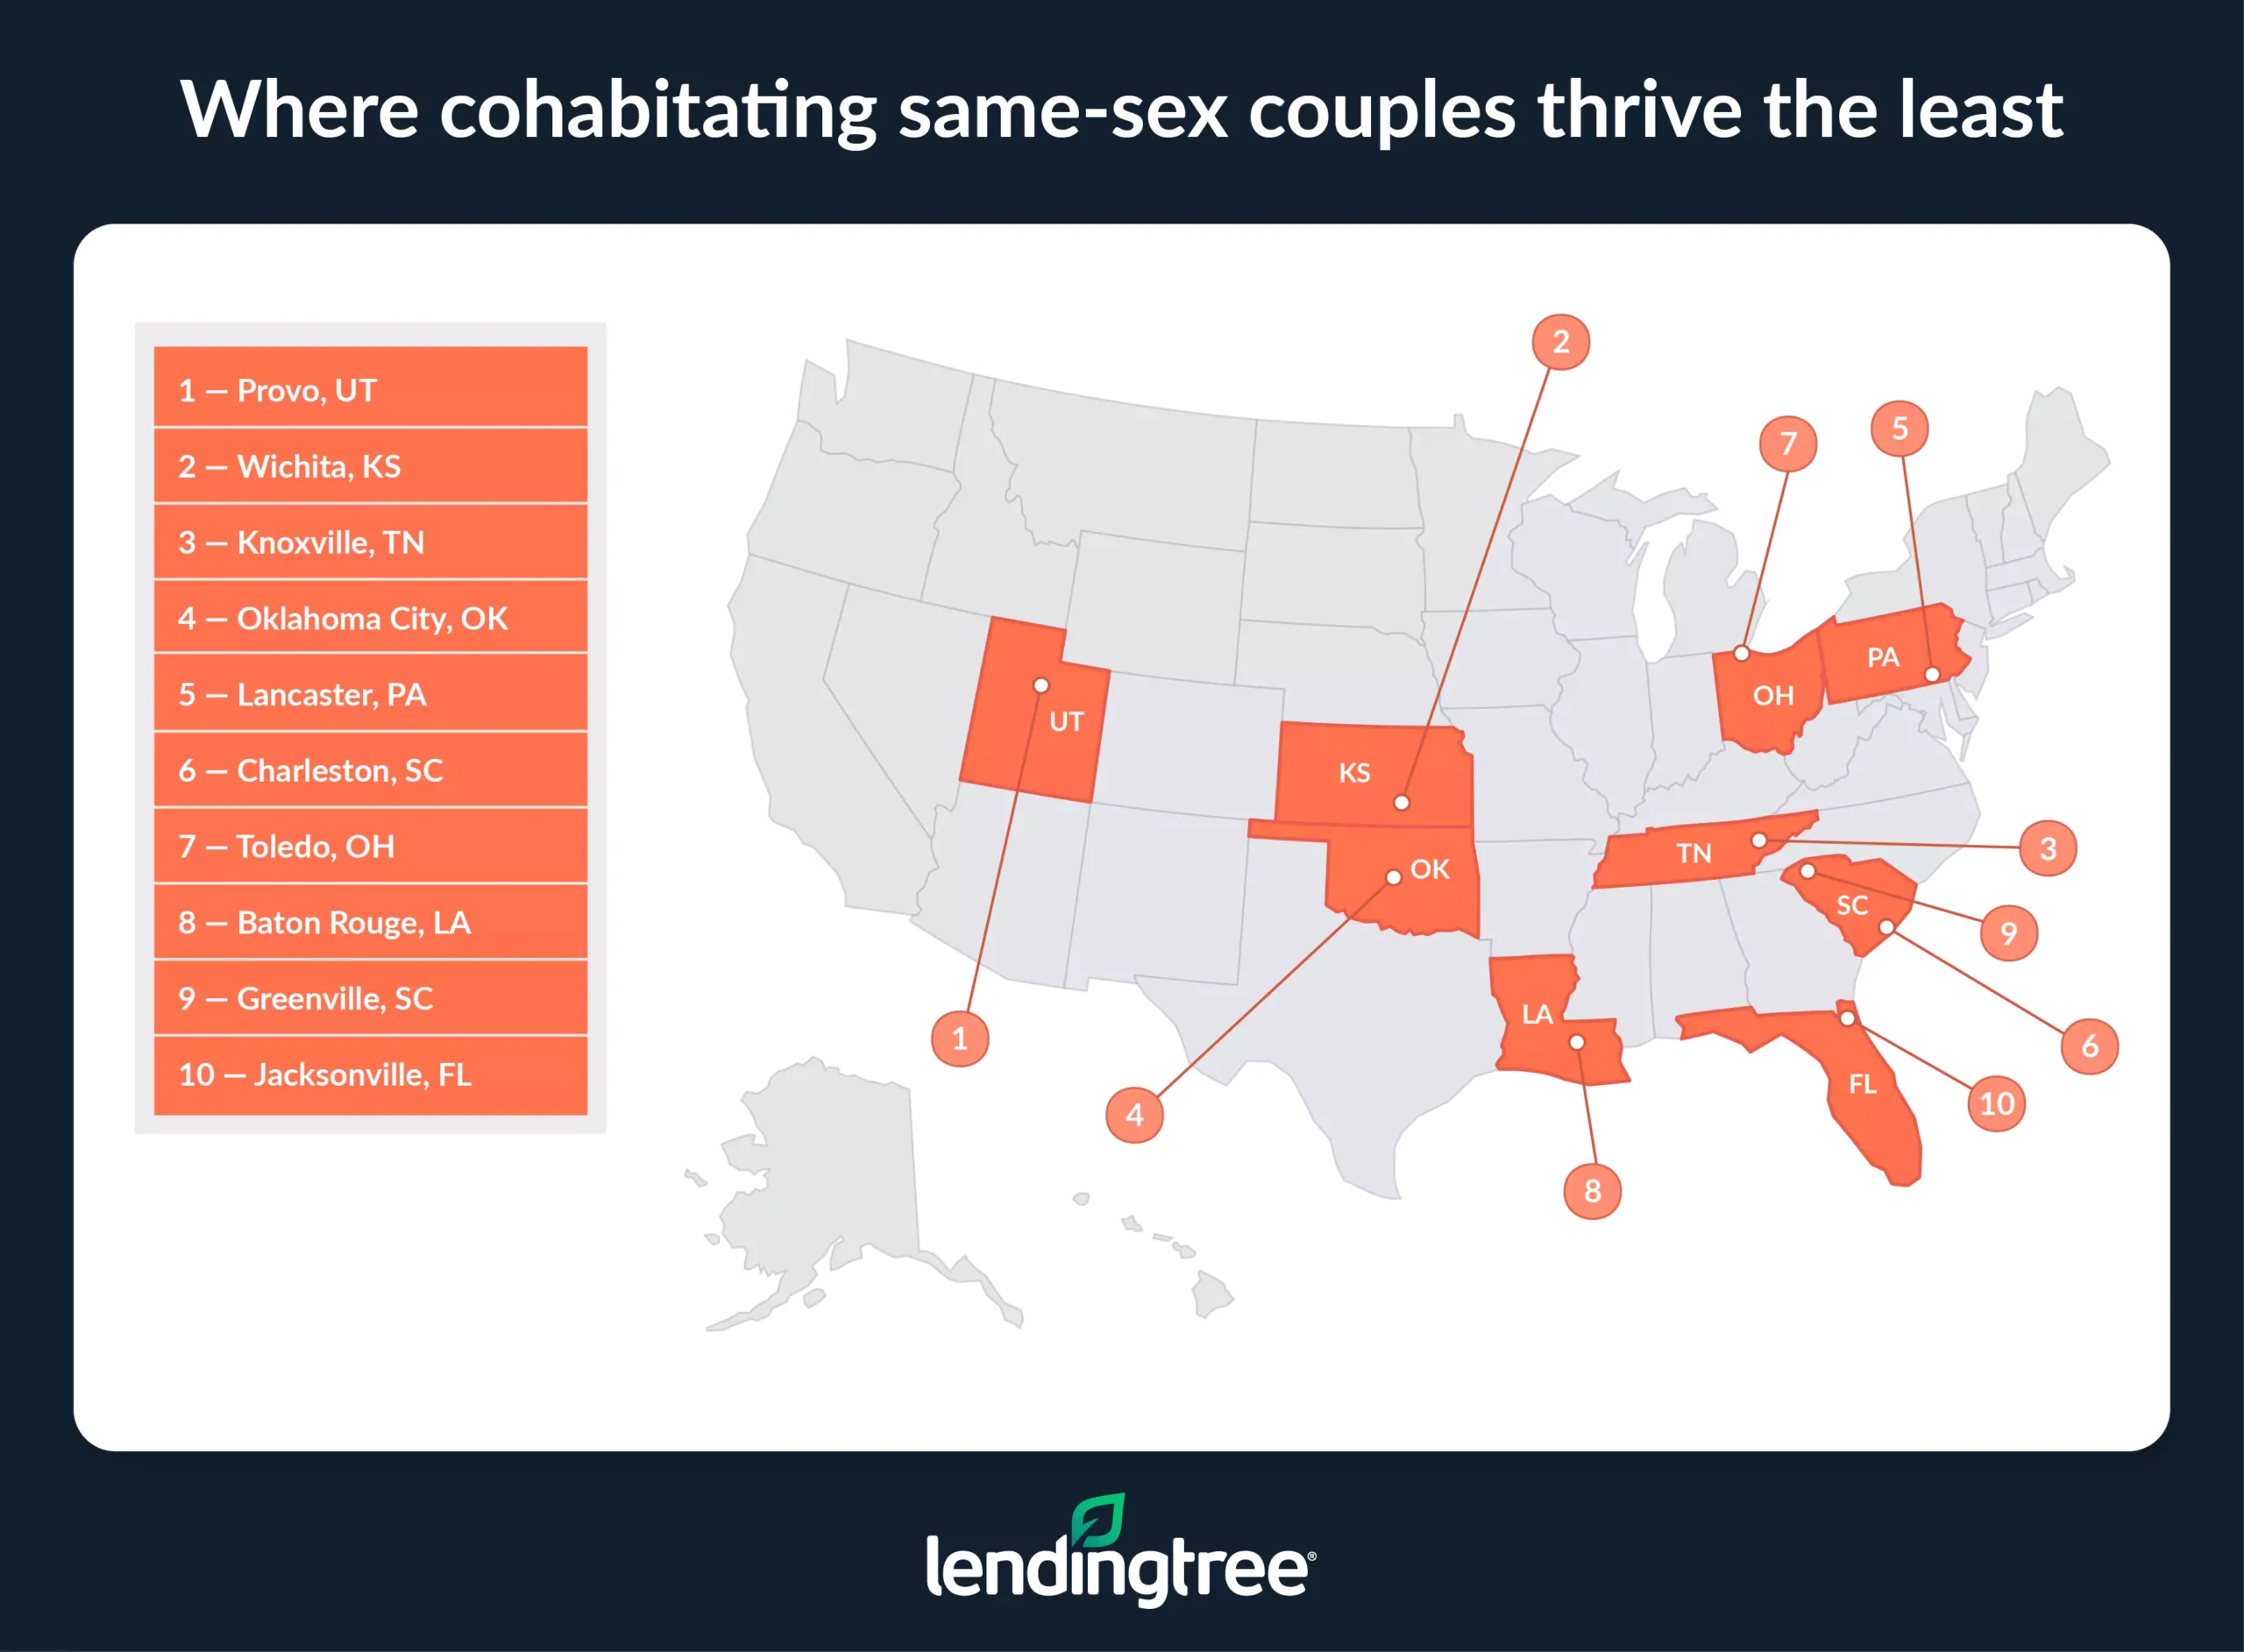
Wichita, Kan., follows, with the second-lowest homeownership rate among cohabitating same-sex couples (44.1%) and the second-largest gap in that rate compared to all couples (-44.0%).
Knoxville, Tenn., ranks third. Of note, Knoxville has the lowest average household income among cohabitating same-sex couples, at $101,543. It has the third-worst income gap compared to all cohabitating couples at -22.2%. (To reiterate, this means cohabitating same-sex couples in the metro make 22.2% less than all cohabitating couples.)
Full rankings: Where same-sex couples who live together thrive most/least
| Rank | Metro | Final score | % of cohabitating couples who are same-sex | Marriage rate among these couples | Marriage gap | Avg. household income among these couples | Income gap | Homeownership rate among these couples | Homeownership gap |
|---|---|---|---|---|---|---|---|---|---|
| 1 | Riverside, CA | 70.7 | 2.1% | 65.8% | -25.0% | $143,302 | 21.5% | 75.4% | 4.0% |
| 2 | San Francisco, CA | 70.0 | 3.1% | 63.8% | -26.6% | $209,453 | 6.0% | 57.4% | -13.2% |
| 3 | North Port, FL | 67.2 | 2.0% | 67.7% | -23.5% | $138,233 | 7.3% | 79.6% | -3.2% |
| 4 | New Haven, CT | 66.3 | 2.1% | 64.1% | -24.7% | $163,627 | 11.4% | 71.4% | -7.1% |
| 5 | Miami, FL | 65.6 | 2.4% | 61.5% | -27.6% | $144,219 | 17.9% | 68.9% | 0.1% |
| 6 | Providence, RI | 64.9 | 2.0% | 59.3% | -29.0% | $167,785 | 17.8% | 73.5% | -5.6% |
| 7 | Palm Bay, FL | 64.3 | 1.7% | 74.4% | -14.6% | $118,959 | -3.2% | 75.5% | -9.4% |
| 8 | Modesto, CA | 63.5 | 1.1% | 68.3% | -21.9% | $147,765 | 31.6% | 62.9% | -7.7% |
| 9 | Washington, DC | 62.0 | 2.0% | 61.5% | -30.6% | $200,072 | 7.6% | 64.7% | -14.8% |
| 10 | Boston, MA | 61.8 | 2.3% | 62.4% | -27.7% | $179,089 | 1.3% | 66.0% | -13.5% |
| 11 | Lakeland, FL | 60.9 | 1.7% | 59.6% | -30.4% | $123,542 | 19.4% | 79.3% | 1.9% |
| 12 | Baltimore, MD | 59.8 | 2.0% | 64.8% | -25.7% | $158,449 | -3.2% | 70.4% | -12.7% |
| 13 | Cape Coral, FL | 59.6 | 1.6% | 65.7% | -24.8% | $129,005 | 7.0% | 75.0% | -7.3% |
| 14 | Stockton, CA | 58.8 | 1.3% | 74.3% | -14.7% | $134,384 | 10.0% | 56.0% | -17.4% |
| 15 | Las Vegas, NV | 58.1 | 2.3% | 64.5% | -22.7% | $137,948 | 7.9% | 57.9% | -14.6% |
| 16 | New York, NY | 57.9 | 2.0% | 62.6% | -28.9% | $190,051 | 15.9% | 51.2% | -22.0% |
| 17 | San Diego, CA | 57.1 | 2.4% | 61.5% | -29.7% | $159,165 | 8.2% | 55.8% | -12.5% |
| 18 | Bakersfield, CA | 56.8 | 1.2% | 60.9% | -28.2% | $110,808 | 5.9% | 77.9% | 15.0% |
| 19 | Tampa, FL | 56.3 | 2.3% | 58.5% | -31.5% | $135,975 | 8.7% | 69.4% | -11.1% |
| 20 | Rochester, NY | 56.0 | 1.7% | 57.7% | -30.5% | $148,112 | 11.5% | 72.7% | -12.0% |
| 21 | Seattle, WA | 55.1 | 2.7% | 57.0% | -32.8% | $168,782 | 2.3% | 59.1% | -18.5% |
| 22 | Deltona, FL | 54.5 | 1.6% | 65.4% | -23.5% | $109,543 | -0.1% | 73.3% | -10.0% |
| 23 | San Jose, CA | 54.4 | 1.4% | 62.1% | -30.8% | $211,261 | -7.8% | 56.7% | -10.9% |
| 24 | Albuquerque, NM | 54.1 | 2.6% | 50.6% | -38.8% | $139,179 | 8.7% | 73.8% | -7.9% |
| 25 | Honolulu, HI | 54.0 | 2.1% | 55.2% | -37.6% | $158,240 | 12.8% | 61.7% | -4.3% |
| 26 | Los Angeles, CA | 53.8 | 2.2% | 58.8% | -31.7% | $164,152 | 18.0% | 48.8% | -16.1% |
| 26 | Salt Lake City, UT | 53.8 | 2.1% | 57.1% | -35.3% | $161,039 | 8.3% | 65.9% | -16.6% |
| 28 | Sacramento, CA | 53.5 | 1.9% | 61.7% | -29.1% | $145,346 | 5.0% | 61.7% | -14.3% |
| 29 | Scranton, PA | 53.4 | 1.2% | 52.8% | -37.3% | $143,620 | 20.5% | 77.1% | -1.3% |
| 29 | Atlanta, GA | 53.4 | 2.0% | 56.6% | -36.2% | $158,476 | 6.8% | 68.3% | -13.5% |
| 31 | Minneapolis, MN | 53.1 | 1.9% | 58.6% | -32.0% | $153,584 | 0.6% | 70.2% | -16.7% |
| 32 | Austin, TX | 52.3 | 2.7% | 54.7% | -35.5% | $164,228 | -2.0% | 61.1% | -16.8% |
| 33 | El Paso, TX | 52.1 | 1.5% | 62.8% | -29.2% | $115,947 | 8.8% | 67.1% | -7.1% |
| 33 | Worcester, MA | 52.1 | 2.0% | 60.4% | -29.0% | $137,583 | -7.3% | 69.2% | -13.6% |
| 35 | Ogden, UT | 51.8 | 1.2% | 63.1% | -31.2% | $147,799 | 4.1% | 70.1% | -15.6% |
| 36 | Hartford, CT | 51.4 | 1.7% | 50.8% | -41.0% | $178,145 | 13.0% | 70.2% | -14.5% |
| 37 | Fresno, CA | 51.3 | 1.3% | 62.0% | -26.6% | $118,482 | 3.0% | 64.9% | 0.3% |
| 38 | Phoenix, AZ | 51.1 | 2.0% | 59.8% | -29.8% | $133,066 | 2.8% | 64.2% | -16.4% |
| 39 | Memphis, TN | 49.5 | 1.4% | 57.8% | -33.9% | $154,604 | 8.5% | 64.1% | -14.9% |
| 40 | McAllen, TX | 49.0 | 1.2% | 64.4% | -28.8% | $117,483 | 16.6% | 61.6% | -18.5% |
| 41 | Springfield, MA | 48.9 | 2.0% | 50.9% | -38.3% | $139,242 | 4.9% | 71.7% | -9.0% |
| 41 | Augusta, GA | 48.9 | 1.9% | 69.7% | -22.9% | $111,498 | -14.8% | 63.4% | -23.5% |
| 43 | Richmond, VA | 48.6 | 2.0% | 55.5% | -36.6% | $144,154 | -6.2% | 70.9% | -12.5% |
| 44 | Portland, OR | 48.5 | 2.6% | 54.1% | -35.3% | $141,326 | -1.0% | 60.8% | -17.5% |
| 45 | Philadelphia, PA | 48.0 | 1.8% | 58.7% | -32.1% | $151,407 | -3.1% | 63.4% | -21.4% |
| 46 | Bridgeport, CT | 47.7 | 1.8% | 61.1% | -32.4% | $186,232 | -15.4% | 57.8% | -25.9% |
| 47 | New Orleans, LA | 47.1 | 2.0% | 52.4% | -38.6% | $140,912 | 0.5% | 69.5% | -12.8% |
| 48 | Des Moines, IA | 46.6 | 1.6% | 51.7% | -40.0% | $149,090 | -3.1% | 74.9% | -9.2% |
| 49 | Dallas, TX | 46.5 | 1.8% | 58.4% | -34.9% | $148,262 | 2.8% | 58.7% | -20.6% |
| 50 | Chattanooga, TN | 46.4 | 1.5% | 57.5% | -35.8% | $136,902 | 1.8% | 67.4% | -14.6% |
| 51 | Dayton, OH | 46.3 | 1.5% | 54.4% | -35.9% | $129,372 | -0.9% | 72.4% | -7.9% |
| 52 | Allentown, PA | 45.8 | 1.3% | 52.7% | -38.4% | $136,085 | 0.4% | 75.4% | -6.8% |
| 53 | Chicago, IL | 45.4 | 1.7% | 56.4% | -35.3% | $152,134 | -1.6% | 62.7% | -20.8% |
| 54 | Buffalo, NY | 44.7 | 1.9% | 55.3% | -34.6% | $140,833 | 6.2% | 60.3% | -26.9% |
| 55 | Tucson, AZ | 44.4 | 1.8% | 59.0% | -29.4% | $113,866 | -9.4% | 65.0% | -16.3% |
| 56 | Boise, ID | 44.2 | 1.1% | 60.8% | -31.7% | $135,747 | -1.4% | 64.7% | -19.8% |
| 57 | Spokane, WA | 44.1 | 1.4% | 67.8% | -20.7% | $107,668 | -8.3% | 56.9% | -26.9% |
| 58 | Pittsburgh, PA | 43.3 | 1.5% | 55.5% | -35.8% | $136,710 | -4.4% | 68.5% | -18.6% |
| 59 | Charlotte, NC | 43.0 | 1.5% | 55.1% | -37.3% | $132,921 | -8.9% | 69.8% | -11.2% |
| 60 | Denver, CO | 42.3 | 2.3% | 54.0% | -36.4% | $145,831 | -8.7% | 57.6% | -24.8% |
| 61 | Detroit, MI | 41.9 | 1.3% | 56.6% | -35.2% | $126,489 | -8.4% | 70.6% | -15.8% |
| 62 | Harrisburg, PA | 41.5 | 1.6% | 57.5% | -33.3% | $112,460 | -16.3% | 70.5% | -13.6% |
| 63 | Albany, NY | 41.4 | 2.1% | 48.1% | -41.1% | $142,206 | -4.5% | 65.6% | -16.6% |
| 64 | St. Louis, MO | 40.6 | 1.5% | 54.1% | -37.9% | $142,115 | -1.1% | 63.9% | -24.1% |
| 65 | Houston, TX | 40.5 | 1.5% | 57.8% | -34.6% | $138,312 | -2.7% | 56.6% | -23.3% |
| 65 | Oxnard, CA | 40.5 | 1.2% | 65.5% | -25.4% | $130,873 | -9.6% | 50.5% | -27.3% |
| 67 | Indianapolis, IN | 40.2 | 1.9% | 54.0% | -37.8% | $129,729 | -9.2% | 64.0% | -20.5% |
| 68 | Orlando, FL | 39.7 | 2.3% | 52.9% | -38.2% | $117,189 | -4.8% | 58.6% | -19.7% |
| 69 | Birmingham, AL | 39.6 | 1.2% | 60.9% | -33.0% | $122,538 | -11.3% | 65.0% | -22.5% |
| 70 | Cincinnati, OH | 39.4 | 1.4% | 55.7% | -35.7% | $137,230 | -7.9% | 63.2% | -22.9% |
| 71 | Little Rock, AR | 38.5 | 1.6% | 52.7% | -40.2% | $129,548 | -2.5% | 63.4% | -19.5% |
| 72 | Virginia Beach, VA | 38.3 | 1.5% | 53.5% | -38.9% | $142,125 | 3.1% | 56.3% | -25.0% |
| 73 | Winston-Salem, NC | 38.0 | 1.7% | 57.1% | -35.3% | $115,731 | -5.0% | 59.7% | -26.1% |
| 74 | Omaha, NE | 37.8 | 1.1% | 54.4% | -37.5% | $146,196 | -0.7% | 60.4% | -25.3% |
| 74 | Jackson, MS | 37.8 | 0.7% | 58.0% | -34.9% | $124,321 | -5.9% | 67.6% | -18.9% |
| 76 | Grand Rapids, MI | 37.1 | 1.2% | 55.0% | -37.5% | $125,684 | -8.1% | 67.1% | -21.8% |
| 77 | Tulsa, OK | 36.1 | 1.4% | 52.4% | -40.4% | $126,677 | -2.5% | 62.3% | -20.5% |
| 78 | Akron, OH | 35.9 | 1.5% | 55.0% | -35.8% | $123,621 | -10.9% | 61.4% | -25.3% |
| 79 | San Antonio, TX | 35.0 | 1.9% | 48.9% | -43.4% | $130,956 | -1.1% | 57.4% | -23.0% |
| 80 | Columbus, OH | 34.9 | 2.0% | 48.7% | -42.4% | $132,742 | -11.6% | 60.1% | -20.5% |
| 81 | Kansas City, MO | 33.0 | 1.7% | 51.0% | -41.5% | $136,851 | -6.2% | 55.8% | -29.8% |
| 81 | Greensboro, NC | 33.0 | 1.6% | 57.0% | -34.2% | $107,153 | -11.2% | 55.3% | -29.1% |
| 83 | Syracuse, NY | 32.2 | 1.7% | 47.4% | -41.6% | $121,384 | -5.9% | 61.1% | -24.9% |
| 84 | Columbia, SC | 31.7 | 1.4% | 48.6% | -44.6% | $119,308 | -8.3% | 66.1% | -19.5% |
| 85 | Colorado Springs, CO | 31.5 | 1.7% | 52.8% | -40.7% | $123,124 | -10.9% | 55.4% | -27.7% |
| 86 | Raleigh, NC | 31.2 | 1.3% | 52.9% | -40.1% | $135,383 | -14.7% | 58.0% | -26.6% |
| 87 | Cleveland, OH | 30.7 | 1.6% | 53.2% | -37.2% | $111,976 | -21.4% | 60.7% | -25.3% |
| 88 | Nashville, TN | 30.5 | 1.8% | 46.3% | -47.4% | $133,671 | -6.9% | 58.6% | -24.8% |
| 89 | Milwaukee, WI | 29.0 | 1.7% | 51.5% | -39.3% | $120,535 | -17.2% | 55.0% | -29.8% |
| 90 | Louisville, KY | 27.9 | 1.7% | 48.9% | -43.5% | $115,159 | -14.6% | 59.3% | -27.9% |
| 91 | Jacksonville, FL | 27.5 | 1.7% | 50.6% | -41.5% | $119,365 | -10.7% | 52.2% | -32.9% |
| 92 | Greenville, SC | 26.7 | 1.2% | 48.8% | -45.6% | $115,282 | -9.9% | 61.8% | -24.8% |
| 93 | Baton Rouge, LA | 26.4 | 1.8% | 54.0% | -38.2% | $106,125 | -23.2% | 54.3% | -35.1% |
| 94 | Toledo, OH | 26.1 | 1.5% | 47.4% | -42.4% | $101,846 | -25.4% | 65.0% | -17.5% |
| 95 | Charleston, SC | 25.4 | 1.5% | 44.7% | -49.5% | $128,930 | -9.1% | 58.7% | -27.2% |
| 96 | Lancaster, PA | 25.1 | 1.6% | 44.4% | -50.6% | $106,310 | -18.1% | 66.7% | -17.1% |
| 97 | Oklahoma City, OK | 24.4 | 1.6% | 48.7% | -43.8% | $105,181 | -21.5% | 57.8% | -24.1% |
| 98 | Knoxville, TN | 22.2 | 1.2% | 49.5% | -44.0% | $101,543 | -22.2% | 60.4% | -25.3% |
| 99 | Wichita, KS | 19.4 | 1.2% | 53.4% | -39.5% | $110,331 | -14.6% | 44.1% | -44.0% |
| 100 | Provo, UT | 14.8 | 1.2% | 56.2% | -41.0% | $110,309 | -20.2% | 37.0% | -51.0% |
Same-sex couples in Florida most likely to be homeowners
Homeownership has always been a major goal for Americans. For cohabitating same-sex couples, those in Florida are the most likely to be homeowners. In fact, North Port has the highest rate of same-sex couples who live together that are homeowners, at 79.6%. Three of the top five metros are in Florida, with North Port joined by Lakeland (79.3%) and Palm Bay (75.5%).
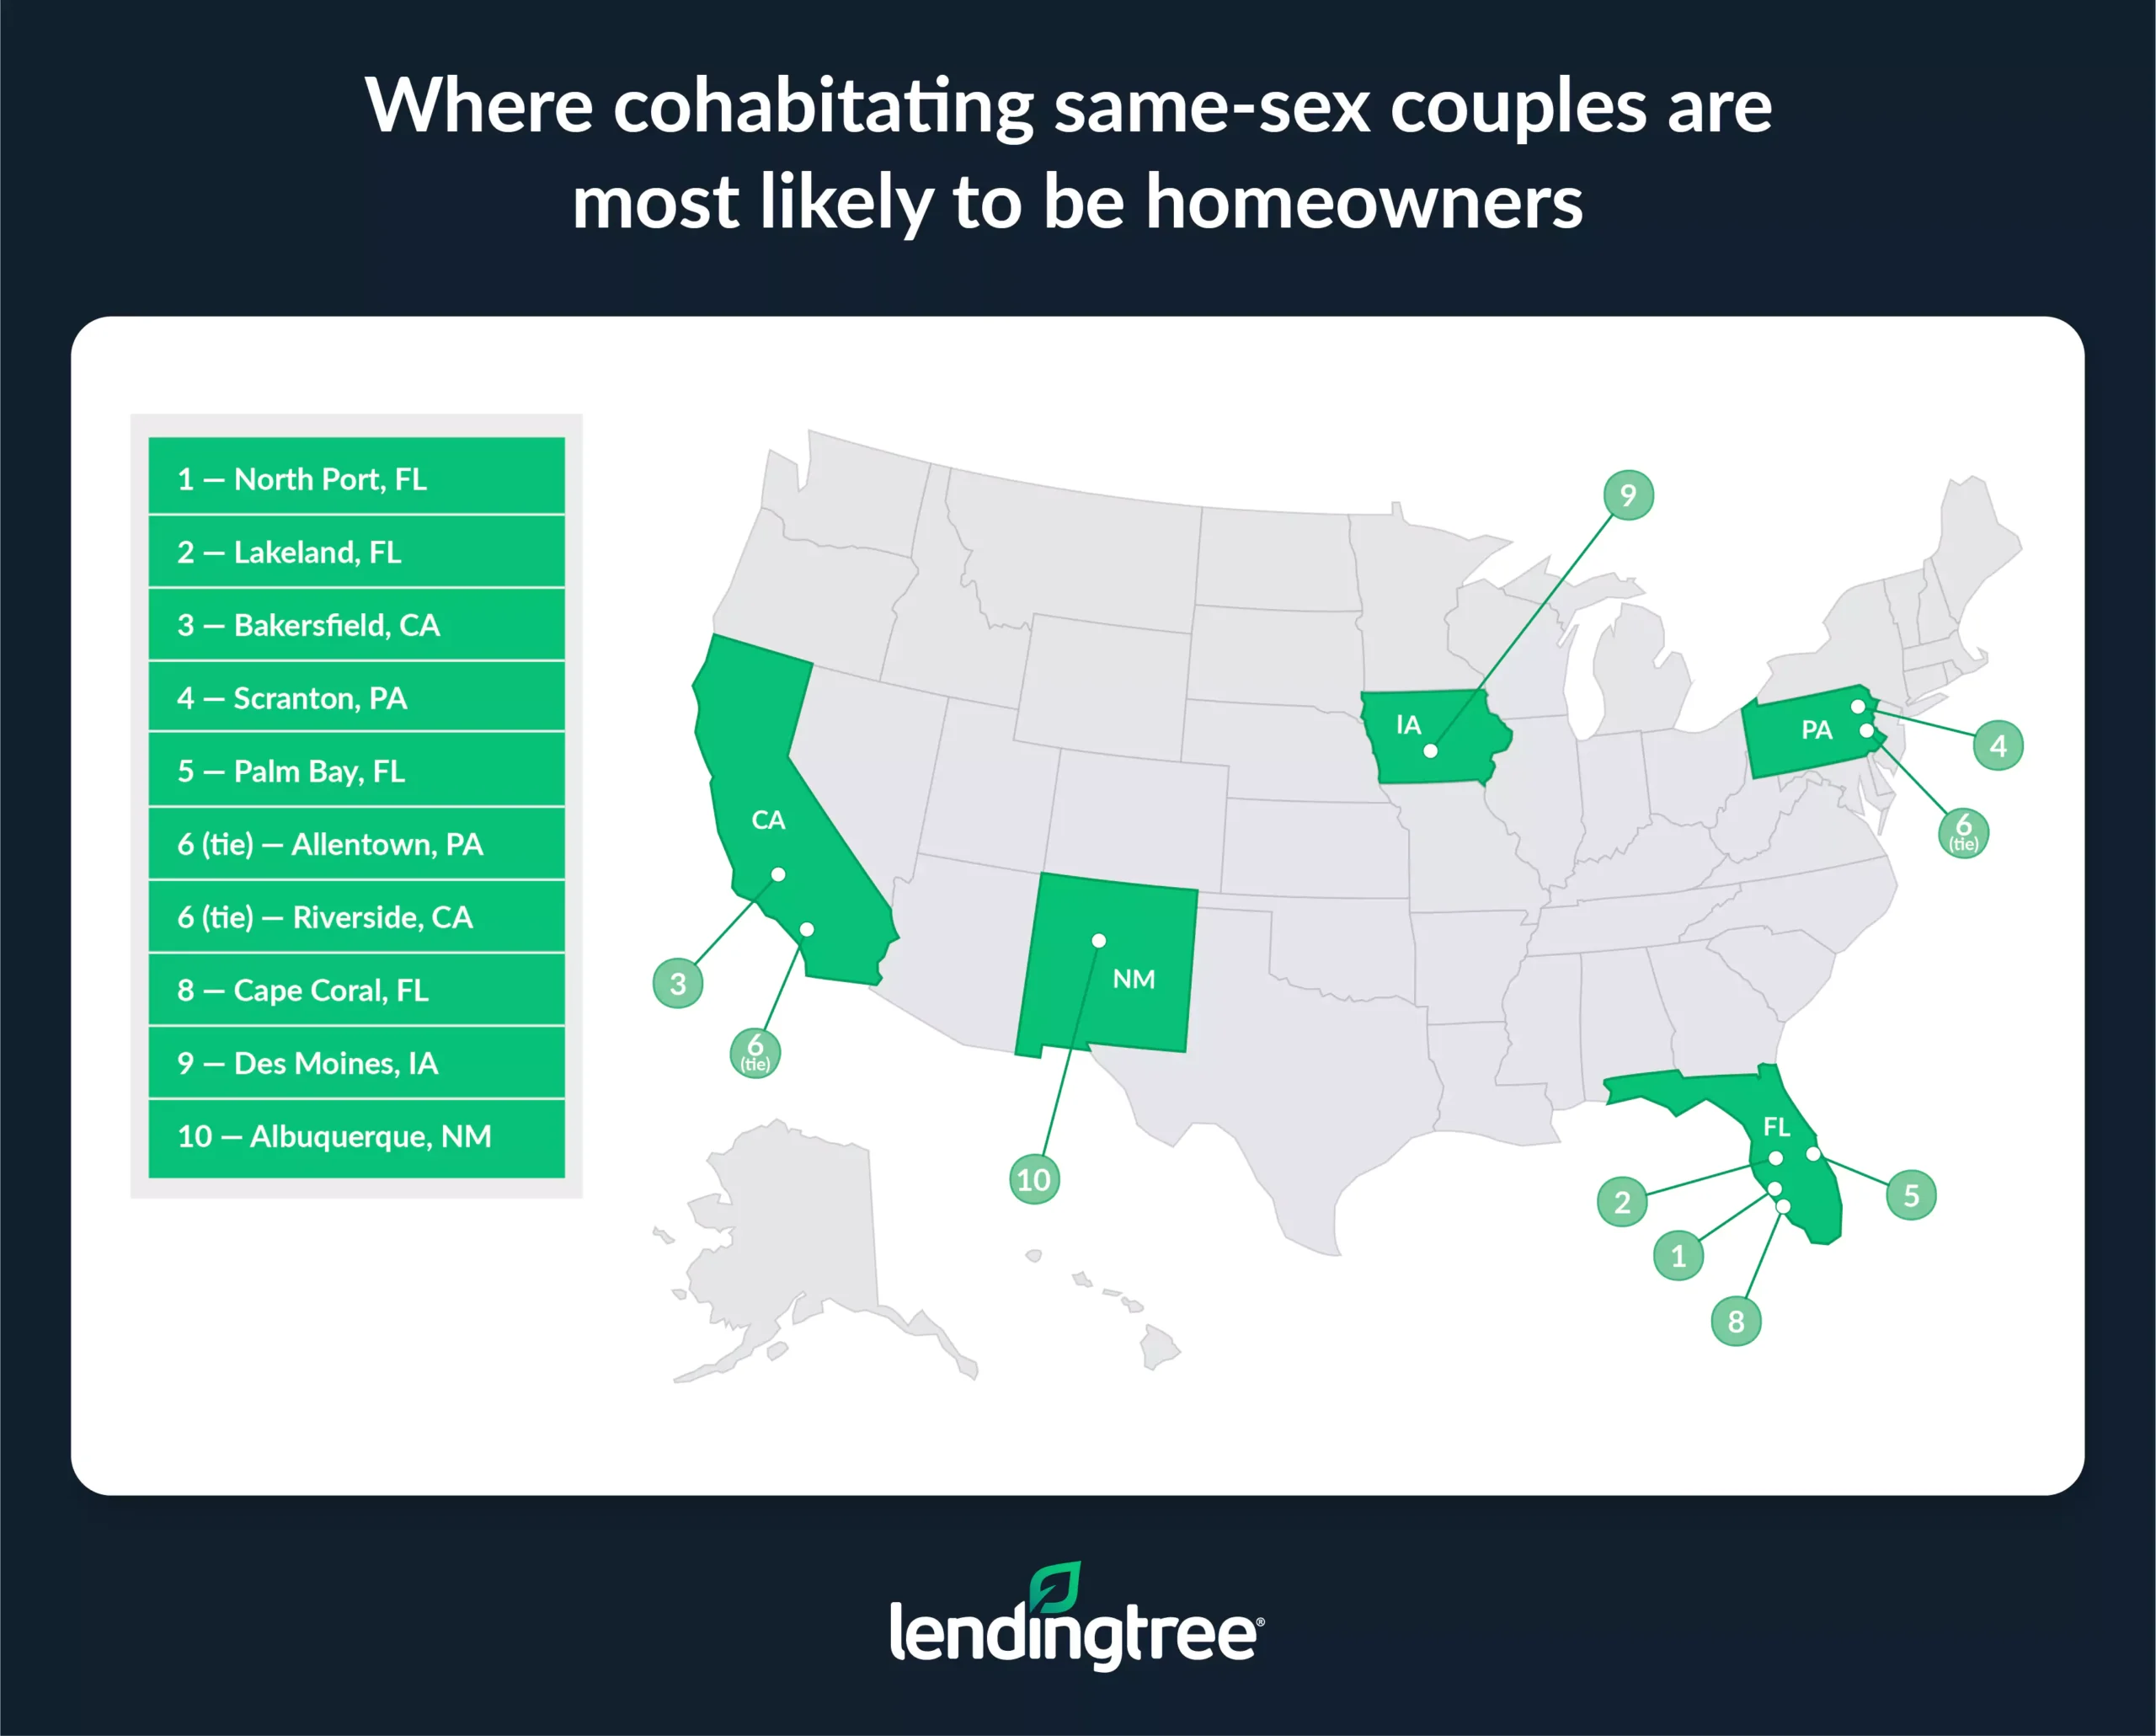
Matt Schulz — LendingTree chief consumer finance analyst and author of “Ask Questions, Save Money, Make More: How to Take Control of Your Financial Life” — says that could boil down to home values.
“It could be because it’s so much less expensive to buy a home in Florida, more so than in other LGBTQ+-friendly places like California and New England,” he says. “Lower prices likely mean more people willing to take the plunge into homeownership.”
Looking at the percentage of couples living together who are same-sex, San Francisco ranks first, at 3.1%. Austin, Texas, and Seattle tie for second, at 2.7%.
Same-sex couples in California make most
When adjusted for cost of living, cohabitating same-sex couples make the most in San Jose, Calif. The average household income among these couples is $211,261.
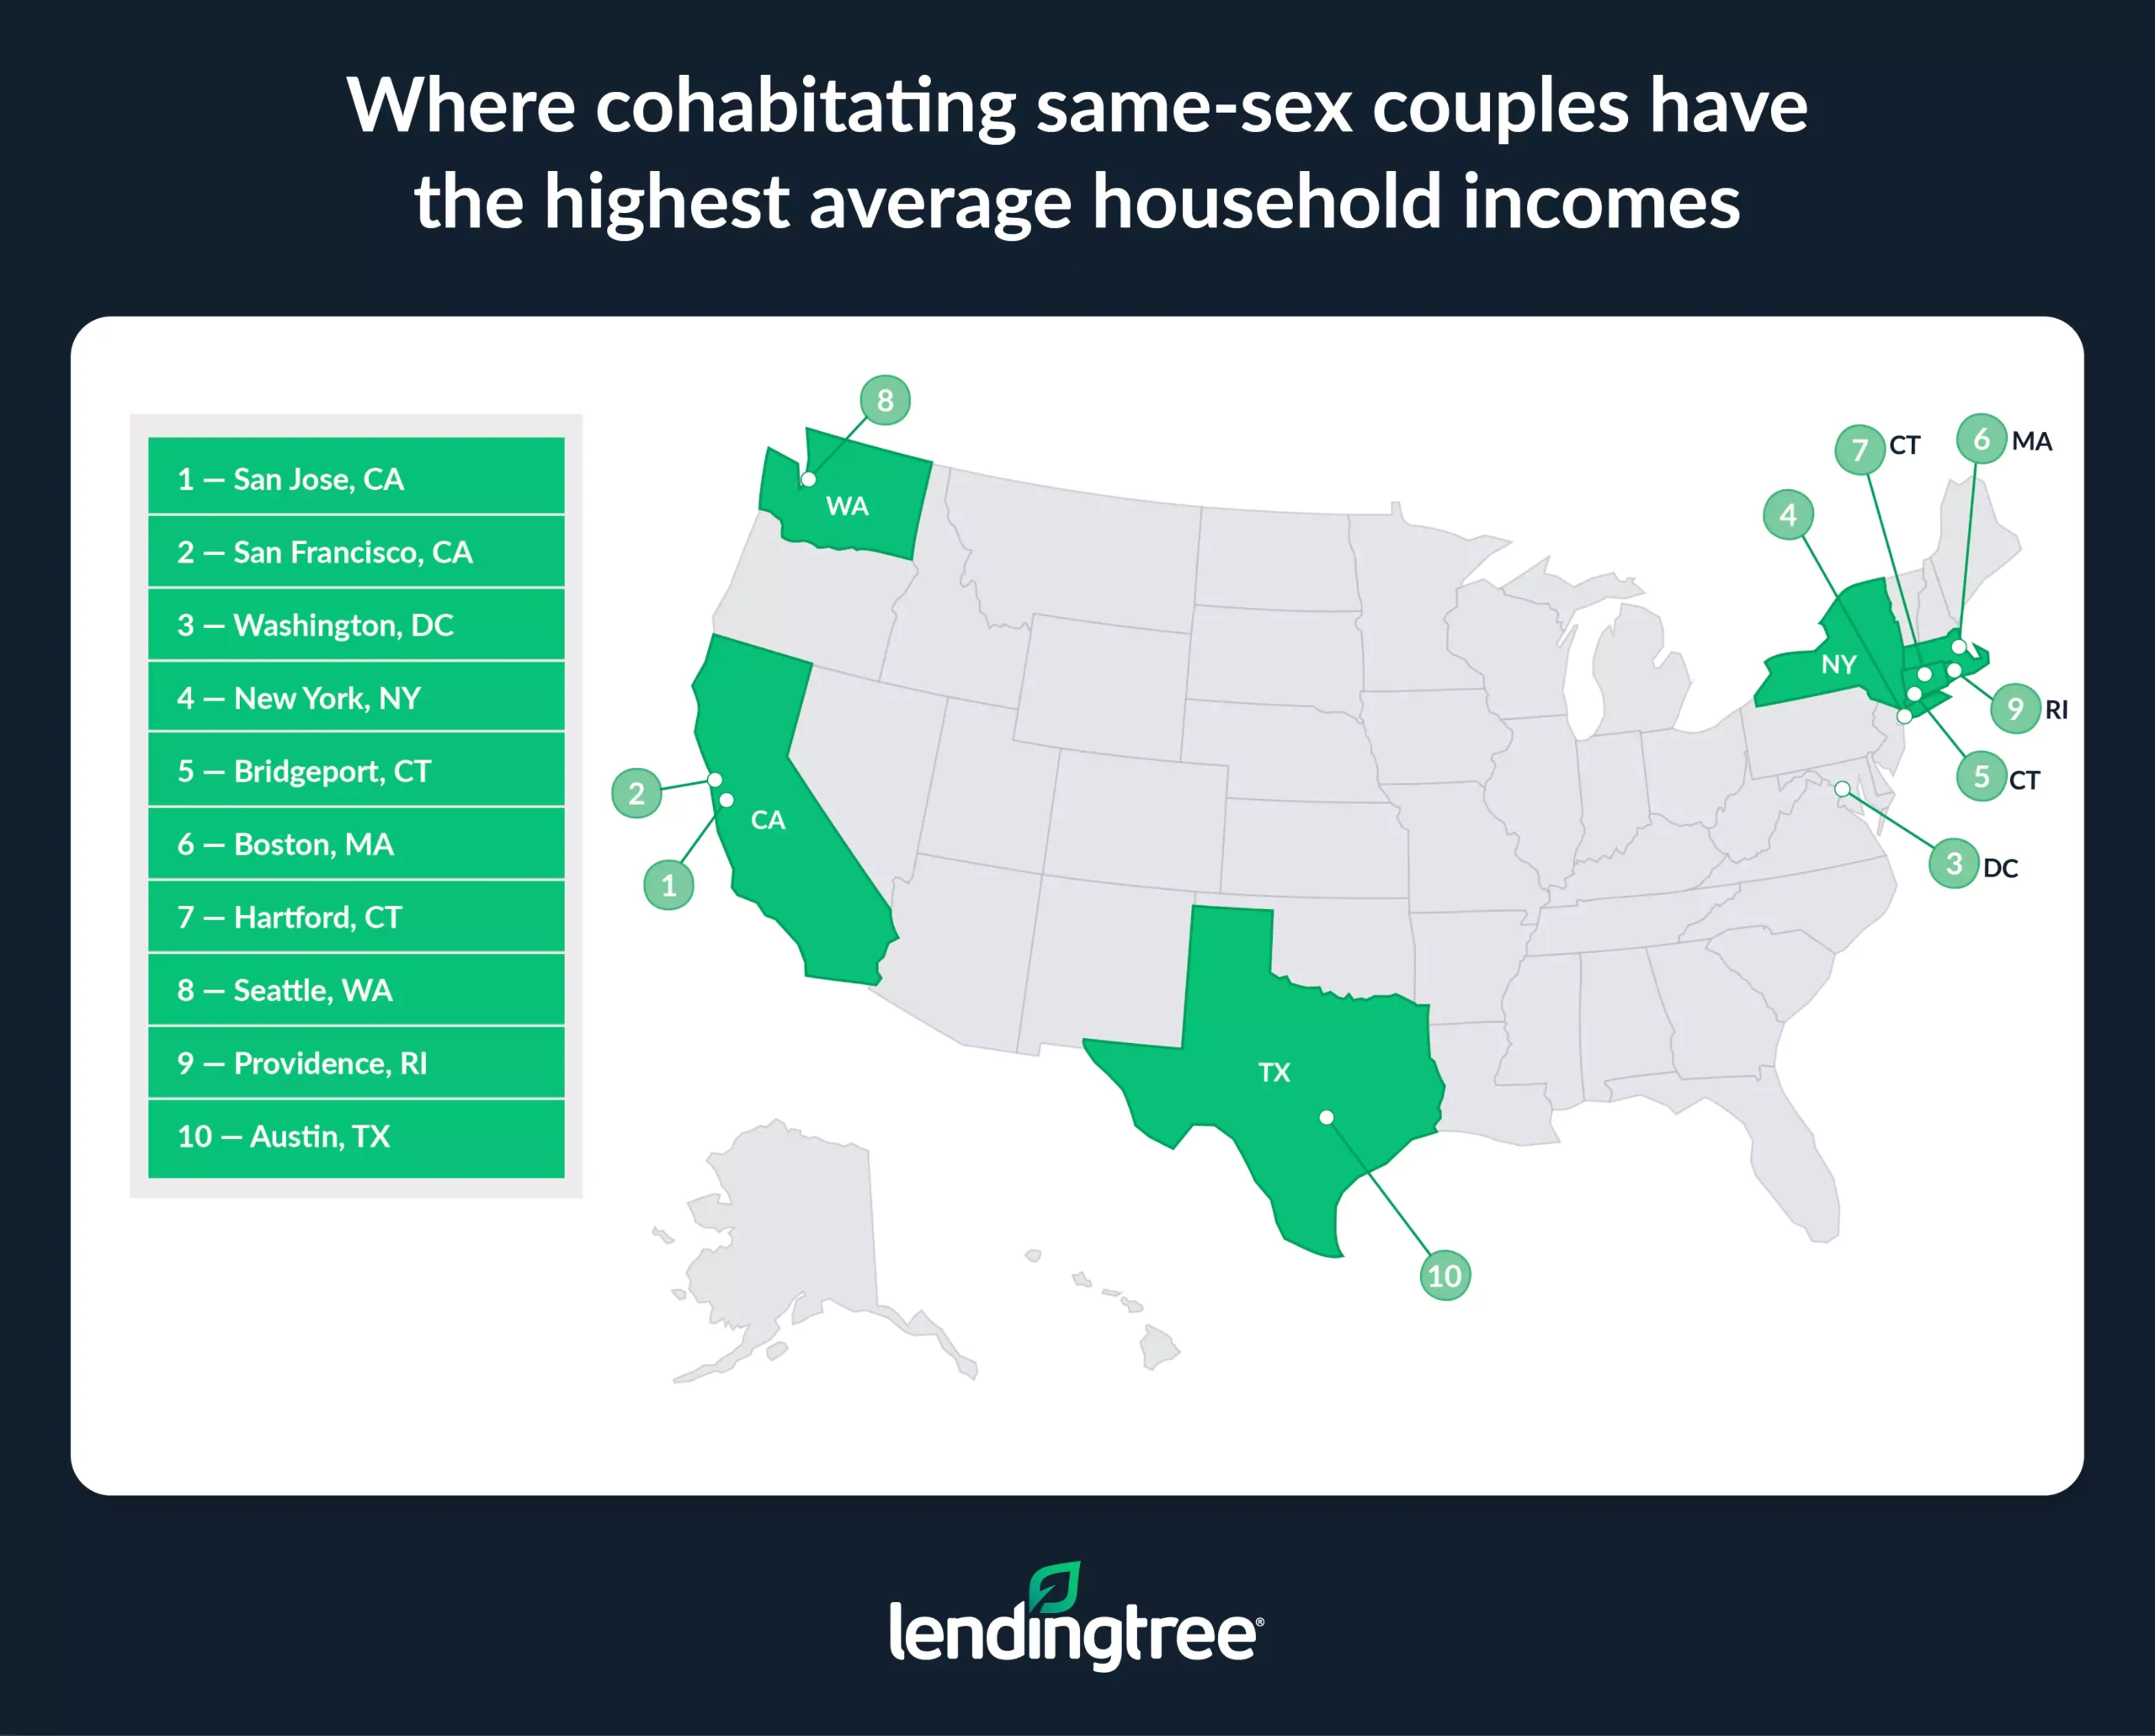
San Francisco ($209,453) and Washington, D.C. ($200,072), follow — the only metros with average household incomes above $200,000 among these couples.
Schulz says there’s no question that these are still challenging areas for anyone seeking a mortgage.
“While incomes may be higher, the cost of living, and the cost of homebuying in particular, is significantly higher than most other cities in the U.S. as well,” he says. “That means that despite having higher overall incomes, they may not have any more disposable income than people in lower-income locations. Less disposable income means less money to be put toward financial goals like saving for a mortgage payment or buying a new home.”
Without adjusting for cost of living, San Francisco ($247,626) moves into first, followed by San Jose ($238,444) and the District of Columbia ($217,360).
Making moves: Homebuying tips for same-sex couples
When it comes to realizing your homeownership dreams, Schulz says there are a few things to keep in mind. He recommends the following:
- Shop around for the best rates. “Don’t take the first mortgage offer you see or rely on your real estate agent to point you in the right direction,” he says. “Taking the time to shop around and compare offers can save tens of thousands of dollars over the life of your mortgage. With a purchase as big as a house, it doesn’t take much movement on your APR to potentially save very real money.”
- Crunch the numbers. “Just because someone will lend you a certain amount of money for a mortgage doesn’t mean you can afford that much or that it’s the right amount for you,” he says. “Check out a home affordability calculator to help you.”
- Get your credit as solid as possible. “There’s little in life more expensive than having crummy credit,” he says. “That’s the case with buying a home, too. Higher credit scores mean lower interest rates, and lower interest rates can mean significant savings over the life of the mortgage. This doesn’t mean you should rush to work with someone offering to bump up your credit score in a hurry because those places tend to be scammy, but be mindful of protecting or improving your score in the run-up to buying a home.”
Methodology
LendingTree analysts evaluated 100 of the 103 largest metros using seven metrics to identify where cohabitating same-sex couples are thriving. The metrics included:
- Percentage of cohabitating couples who are same-sex
- Percentage of cohabitating same-sex couples who are married
- Marriage rate gap between cohabitating same-sex and all cohabitating couples
- Average household income for cohabitating same-sex couples (adjusted for cost of living)
- Income gap between cohabitating same-sex and all cohabitating couples (unadjusted)
- Percentage of cohabitating same-sex couples who own homes
- Homeownership rate gap between same-sex and all cohabitating couples
We scored the metros from 0 to 100 in each metric, with the final score being an average of these equal-weight metrics. Gaps are expressed as the percentage below or above all cohabitating couples. For example, a gap of -2.5% means cohabitating same-sex couples earned 2.5% less than all cohabitating couples in the metro. If the gap is 2.5%, it means they earned 2.5% more.
Because we used five-year estimates, metropolitan statistical areas (MSAs) are based on the 2013 definitions. Among the 100 largest metros by population, MSA-level data wasn’t available from IPUMS for Poughkeepsie, N.Y., Madison, Wis., and Durham, N.C. To replace these metros, we used Chattanooga, Tenn., Modesto, Calif., and Lancaster, Pa.
Sources: U.S. Census Bureau 2023 American Community Survey (ACS) microdata with five-year estimates (via IPUMS) and 2023 U.S. Bureau of Economic Analysis (BEA) regional price parity (RPP) data.
View mortgage loan offers from up to 5 lenders in minutes