Metros With Highest Wildfire Risk See Influx of New Residents


Wildfires are a terrifying reality for many homeowners, yet many Americans continue to move to metros with high wildfire risk. In fact, just two of the 29 metros with the highest wildfire risk had a higher rate of people moving out than in, according to a LendingTree study.
Here’s what else we found.
Key findings
- Among the metros with the highest wildfire risk, Flagstaff, Ariz., has the highest rate of people moving in. The Arizona metro added 137.1 people per 1,000 residents. Ocala, Fla. (96.8), and Chico, Calif. (84.6), followed.
- Flagstaff also has the highest rate of people moving out. Suggesting a high population turnover, Flagstaff lost 80.2 people per 1,000 residents. Redding, Calif. (62.2), and Denver (61.6) followed.
- Two California metros — Los Angeles and Fresno — have the lowest rates of people moving in and out. That suggests a stable population. Both metros finished with positive migration (more people moving in than out) rates — 7.9 per 1,000 residents in Los Angeles and 15.4 in Fresno.
- Only two of the 29 metros with the highest wildfire risk have more people moving out than in. Redding had the biggest negative migration rate at 4.8 per 1,000 residents. Meanwhile, Wenatchee, Wash., saw a negative migration rate of 0.9.
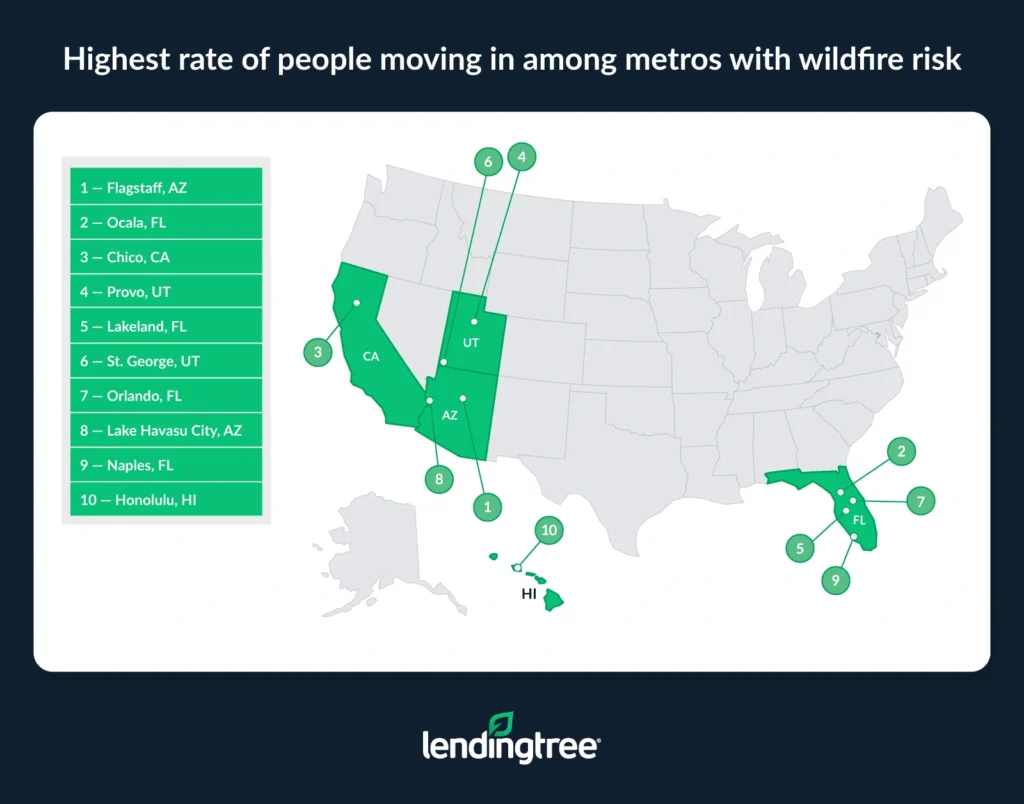
Flagstaff, Ariz., has highest rate of people moving in
Despite its wildfire risk, Flagstaff, Ariz., has a high rate of people moving in. At 137.1 people per 1,000 residents, it’s the only metro over 100.0.
That could be because of increased tourism after efforts to enhance the community’s appeal. While Flagstaff has always been a popular destination due to its proximity to the Grand Canyon, attractions and restaurants have increased tourism revenue in the metro and, by default, improved the community. That makes it a popular spot to move, though we’ll mention the flip side next.
A metro is considered at high risk for wildfires if any county in it ranks in the top 50 for wildfire risk, according to Federal Emergency Management Agency (FEMA) National Risk Index (NRI) data. That left us with 29 metros to analyze.
After Flagstaff, Ocala, Fla. (96.8), and Chico, Calif. (84.6), have the next highest rates of people moving in.
Matt Schulz — LendingTree chief consumer finance analyst and author of “Ask Questions, Save Money, Make More: How to Take Control of Your Financial Life” — says high fire risk can lead to higher mortgage rates and lower home prices, especially if fires have recently hit nearby.
Full rankings: Metros with highest wildfire risk that have highest/lowest rate of people moving in
| Rank | Metro | # who moved in | Population | # who moved in per 1,000 residents |
|---|---|---|---|---|
| 1 | Flagstaff, AZ | 19,806 | 144,472 | 137.1 |
| 2 | Ocala, FL | 39,664 | 409,959 | 96.8 |
| 3 | Chico, CA | 17,526 | 207,172 | 84.6 |
| 4 | Provo, UT | 60,575 | 733,218 | 82.6 |
| 5 | Lakeland, FL | 66,241 | 818,330 | 80.9 |
| 6 | St. George, UT | 15,306 | 202,452 | 75.6 |
| 7 | Orlando, FL | 209,124 | 2,817,933 | 74.2 |
| 8 | Lake Havasu City, AZ | 16,391 | 223,682 | 73.3 |
| 9 | Naples, FL | 29,432 | 404,310 | 72.8 |
| 10 | Honolulu, HI | 70,796 | 989,408 | 71.6 |
| 11 | Santa Maria, CA | 30,959 | 441,257 | 70.2 |
| 12 | Palm Bay, FL | 44,460 | 643,979 | 69.0 |
| 13 | Boise, ID | 54,464 | 826,521 | 65.9 |
| 14 | Las Vegas, NV | 151,425 | 2,336,573 | 64.8 |
| 15 | Salt Lake City, UT | 81,814 | 1,267,864 | 64.5 |
| 16 | Denver, CO | 187,578 | 3,005,131 | 62.4 |
| 17 | San Diego, CA | 203,096 | 3,269,973 | 62.1 |
| 18 | Phoenix, AZ | 310,810 | 5,070,110 | 61.3 |
| 19 | Wenatchee, WA | 7,487 | 124,795 | 60.0 |
| 20 | Sacramento, CA | 143,236 | 2,420,608 | 59.2 |
| 21 | Redding, CA | 10,346 | 180,366 | 57.4 |
| 22 | Miami, FL | 347,359 | 6,183,199 | 56.2 |
| 23 | Santa Rosa, CA | 26,553 | 481,812 | 55.1 |
| 24 | Oxnard, CA | 43,320 | 829,590 | 52.2 |
| 25 | Bakersfield, CA | 42,313 | 913,820 | 46.3 |
| 26 | Riverside, CA | 216,432 | 4,688,053 | 46.2 |
| 27 | Yakima, WA | 10,935 | 256,643 | 42.6 |
| 28 | Fresno, CA | 45,713 | 1,180,020 | 38.7 |
| 29 | Los Angeles, CA | 458,091 | 12,799,100 | 35.8 |
Flagstaff also has highest rate of people moving out
Flagstaff also has the highest rate of people moving out. Suggesting a high population turnover, the Arizona metro lost 80.2 people per 1,000 residents.
At the same time, Flagstaff can’t support a significant increase in population because it’s surrounded by federal and tribal land, limiting its ability to grow outward and enhancing the housing shortage. Flagstaff has become a popular spot for consumers buying second homes, contributing to the housing shortage and rising housing costs.
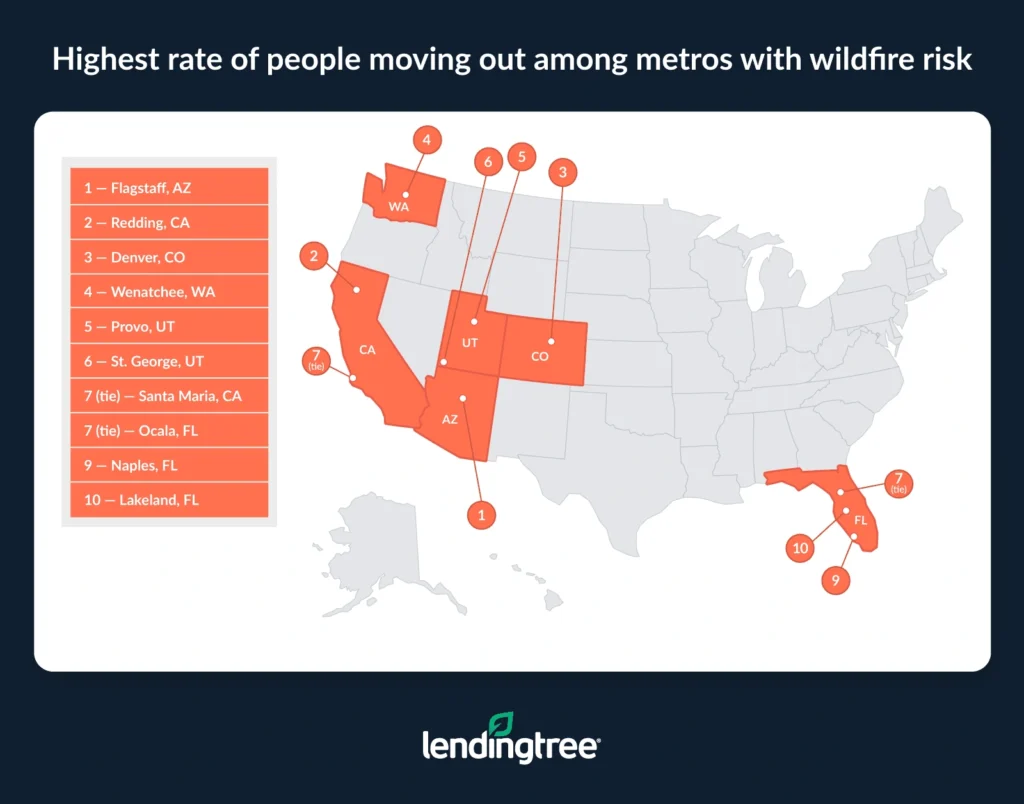
The metros with the next highest rates of people moving out are Redding, Calif. (62.2), and Denver (61.6).
Full rankings: Metros with highest wildfire risk that have highest/lowest rate of people moving out
| Rank | Metro | # who moved out | Population | # who moved out per 1,000 residents |
|---|---|---|---|---|
| 1 | Flagstaff, AZ | 11,593 | 144,472 | 80.2 |
| 2 | Redding, CA | 22,411 | 409,959 | 62.2 |
| 3 | Denver, CO | 6,462 | 207,172 | 61.6 |
| 4 | Wenatchee, WA | 41,317 | 733,218 | 60.9 |
| 5 | Provo, UT | 41,272 | 818,330 | 56.4 |
| 6 | St. George, UT | 11,237 | 202,452 | 55.5 |
| 7 | Santa Maria, CA | 128,055 | 2,817,933 | 54.7 |
| 7 | Ocala, FL | 9,543 | 223,682 | 54.7 |
| 9 | Naples, FL | 21,237 | 404,310 | 52.5 |
| 10 | Lakeland, FL | 44,805 | 989,408 | 50.4 |
| 11 | Salt Lake City, UT | 24,138 | 441,257 | 49.2 |
| 12 | Santa Rosa, CA | 25,280 | 643,979 | 46.3 |
| 13 | Oxnard, CA | 29,852 | 826,521 | 45.5 |
| 14 | Orlando, FL | 77,882 | 2,336,573 | 45.4 |
| 15 | Honolulu, HI | 62,349 | 1,267,864 | 45.3 |
| 16 | San Diego, CA | 185,031 | 3,005,131 | 45.0 |
| 17 | Lake Havasu City, AZ | 147,162 | 3,269,973 | 42.7 |
| 18 | Palm Bay, FL | 154,730 | 5,070,110 | 39.3 |
| 19 | Sacramento, CA | 7,605 | 124,795 | 39.0 |
| 20 | Bakersfield, CA | 94,368 | 2,420,608 | 36.5 |
| 21 | Boise, ID | 11,214 | 180,366 | 36.1 |
| 22 | Yakima, WA | 193,543 | 6,183,199 | 34.6 |
| 23 | Las Vegas, NV | 22,288 | 481,812 | 33.3 |
| 24 | Riverside, CA | 37,740 | 829,590 | 32.6 |
| 25 | Miami, FL | 33,327 | 913,820 | 31.3 |
| 26 | Chico, CA | 152,938 | 4,688,053 | 31.2 |
| 27 | Phoenix, AZ | 8,868 | 256,643 | 30.5 |
| 28 | Los Angeles, CA | 27,543 | 1,180,020 | 27.9 |
| 29 | Fresno, CA | 357,150 | 12,799,100 | 23.3 |
California metros maintain stable population
Unlike Flagstaff, two California metros (Los Angeles and Fresno) have the lowest rates of people moving in and out when factored together, suggesting a stable population.
And while these metros have a stable population, both have positive migration rates, meaning more people move in than out. A net of 7.9 people moved in per 1,000 residents in Los Angeles, while that figure was 15.4 in Fresno.
Meanwhile, Fresno also saw the highest population growth among the metros with the highest wildfire risk, jumping 16.2% between 2022 and 2023. The next highest was Lakeland, Fla., in a distant second at 3.9%.
Full rankings: Percentage change in population among metros with highest wildfire risk
| Rank | Metro | Population, 2022 | Population, 2023 | % change |
|---|---|---|---|---|
| 1 | Fresno, CA | 1,015,190 | 1,180,020 | 16.2% |
| 2 | Lakeland, FL | 787,404 | 818,330 | 3.9% |
| 3 | Ocala, FL | 396,415 | 409,959 | 3.4% |
| 4 | Provo, UT | 714,454 | 733,218 | 2.6% |
| 5 | St. George, UT | 197,680 | 202,452 | 2.4% |
| 6 | Palm Bay, FL | 630,693 | 643,979 | 2.1% |
| 7 | Orlando, FL | 2,764,182 | 2,817,933 | 1.9% |
| 8 | Naples, FL | 397,994 | 404,310 | 1.6% |
| 8 | Boise, ID | 813,801 | 826,521 | 1.6% |
| 10 | Lake Havasu City, AZ | 220,816 | 223,682 | 1.3% |
| 11 | Phoenix, AZ | 5,015,678 | 5,070,110 | 1.1% |
| 12 | Miami, FL | 6,139,340 | 6,183,199 | 0.7% |
| 13 | Denver, CO | 2,985,871 | 3,005,131 | 0.6% |
| 13 | Las Vegas, NV | 2,322,985 | 2,336,573 | 0.6% |
| 15 | Wenatchee, WA | 124,118 | 124,795 | 0.5% |
| 16 | Riverside, CA | 4,667,558 | 4,688,053 | 0.4% |
| 17 | Flagstaff, AZ | 144,060 | 144,472 | 0.3% |
| 18 | Sacramento, CA | 2,416,702 | 2,420,608 | 0.2% |
| 19 | Salt Lake City, UT | 1,266,191 | 1,267,864 | 0.1% |
| 20 | Chico, CA | 207,303 | 207,172 | -0.1% |
| 20 | Yakima, WA | 257,001 | 256,643 | -0.1% |
| 22 | Santa Rosa, CA | 482,650 | 481,812 | -0.2% |
| 22 | San Diego, CA | 3,276,208 | 3,269,973 | -0.2% |
| 22 | Bakersfield, CA | 916,108 | 913,820 | -0.2% |
| 25 | Redding, CA | 180,930 | 180,366 | -0.3% |
| 26 | Oxnard, CA | 832,605 | 829,590 | -0.4% |
| 27 | Los Angeles, CA | 12,872,322 | 12,799,100 | -0.6% |
| 27 | Santa Maria, CA | 443,837 | 441,257 | -0.6% |
| 27 | Honolulu, HI | 995,638 | 989,408 | -0.6% |
Only 2 metros have negative migration rate
Of the 29 metros with the highest wildfire risk, only two have more people moving out than in. Redding led, losing 4.8 residents per 1,000 people. Wenatchee, Wash., follows with a negative migration rate of 0.9.
Schulz says that may present an opportunity for some — if you’re OK with fire risk. “More people moving out than moving in likely means falling home prices,” he says. “It’s simple supply and demand. That’s good news for buyers but not for sellers.”
Still, Schulz believes choosing to move in or out of an area with fire risk is largely related to risk tolerance.
“Some people only want the perfect house in the perfect neighborhood under the most perfect conditions,” he says. “Others are willing to make any sacrifice necessary to afford a new home. Most of us are somewhere in the middle. It’s important to understand how much risk you’re willing to tolerate and what type of risks you’re willing to put up with before signing on the dotted line.”
Full rankings: Metros with highest wildfire risk that have highest/lowest migration rates
| Rank | Metro | Net migration | Population | Net migration per 1,000 residents |
|---|---|---|---|---|
| 1 | Flagstaff, AZ | 8,213 | 144,472 | 56.8 |
| 2 | Chico, CA | 11,064 | 207,172 | 53.4 |
| 3 | Ocala, FL | 17,253 | 409,959 | 42.1 |
| 4 | Las Vegas, NV | 73,543 | 2,336,573 | 31.5 |
| 5 | Phoenix, AZ | 156,080 | 5,070,110 | 30.8 |
| 6 | Lake Havasu City, AZ | 6,848 | 223,682 | 30.6 |
| 7 | Lakeland, FL | 24,969 | 818,330 | 30.5 |
| 8 | Palm Bay, FL | 19,180 | 643,979 | 29.8 |
| 8 | Boise, ID | 24,612 | 826,521 | 29.8 |
| 10 | Orlando, FL | 81,069 | 2,817,933 | 28.8 |
| 11 | Honolulu, HI | 25,991 | 989,408 | 26.3 |
| 11 | Provo, UT | 19,258 | 733,218 | 26.3 |
| 13 | Miami, FL | 153,816 | 6,183,199 | 24.9 |
| 14 | Naples, FL | 8,195 | 404,310 | 20.3 |
| 15 | Sacramento, CA | 48,868 | 2,420,608 | 20.2 |
| 16 | St. George, UT | 4,069 | 202,452 | 20.1 |
| 17 | San Diego, CA | 55,934 | 3,269,973 | 17.1 |
| 18 | Santa Maria, CA | 6,821 | 441,257 | 15.5 |
| 19 | Fresno, CA | 18,170 | 1,180,020 | 15.4 |
| 19 | Salt Lake City, UT | 19,465 | 1,267,864 | 15.4 |
| 21 | Riverside, CA | 63,494 | 4,688,053 | 13.5 |
| 22 | Bakersfield, CA | 8,986 | 913,820 | 9.8 |
| 23 | Santa Rosa, CA | 4,265 | 481,812 | 8.9 |
| 24 | Yakima, WA | 2,067 | 256,643 | 8.1 |
| 25 | Los Angeles, CA | 100,941 | 12,799,100 | 7.9 |
| 26 | Oxnard, CA | 5,580 | 829,590 | 6.7 |
| 27 | Denver, CO | 2,547 | 3,005,131 | 0.8 |
| 28 | Wenatchee, WA | -118 | 124,795 | -0.9 |
| 29 | Redding, CA | -868 | 180,366 | -4.8 |
Moving to a metro with high fire risk: Top expert tips
Moving to an area with high fire risk comes with uncertainty, but there are a few things to keep in mind if you’re set on it. Schulz recommends the following:
- Don’t be blinded by lower prices. “Yes, a cheaper house can be amazing,” he says. “However, moving to a high-risk area can be enormously stressful, extremely expensive and generally unsettling. That may not be too worrisome if you’re only looking to live in the home for a few years, but if you’re looking for your forever home, the risk might be more than you’re willing to put up with.”
- Shop around. “Even though mortgage rates may be higher in high-fire-risk areas, you can still make competition work for you,” he says. “In fact, it’s even more important in that situation. Lower interest rates can save you thousands of dollars over the life of a loan, and the right deal on a mortgage can make that risky home look like a better bet.”
- Understand home insurance costs and liability. Homeowners insurance in high-risk areas can be expensive and difficult to obtain. Before committing to a purchase, get quotes from multiple providers and check if state-backed insurance options exist.
Methodology
LendingTree researchers analyzed U.S. Census Bureau 2023 American Community Survey (ACS) microdata with one-year estimates (via IPUMS) to calculate the rate of people moving into and out of areas at the highest risk for wildfires per 1,000 residents.
Researchers calculated each area’s migration by subtracting the number of residents who left from the number of residents who moved in.
A metro is considered at high risk for wildfires if any county in it ranks in the top 50 for wildfire risk, according to Federal Emergency Management Agency (FEMA) National Risk Index (NRI) data. This resulted in us analyzing 29 metros.
Researchers used 2023 ACS data with one-year estimates to get the populations in 2022 and 2023 for each metro.
View mortgage loan offers from up to 5 lenders in minutes