Wildfires Are Rising Nationwide, Leaving Homeowners More Exposed to Insurance Risk


Homeowners across the country are getting an unwelcome wake-up call: Wildfires are no longer a regional problem.
This LendingTree analysis finds that wildfire activity has surged nationally over the past five years, forcing homeowners beyond the usual danger zones to reckon with a threat that’s reshaping home insurance costs, coverage decisions and financial peace of mind.
- Wildfires rose 28.8% nationwide between 2019 and 2024, increasing from 50,380 to 64,897. Massachusetts recorded the largest increase among the states in our analysis, with wildfires rising 349.5% from 289 to 1,299.
- California accounted for the largest share of U.S. wildfires in 2024, but Oregon and Texas recorded more acres burned. California had 8,316 wildfires, representing 12.8% of the national total, while Texas had 4,967, or 7.7%. However, Oregon and Texas recorded 1.8 million and 1.3 million acres burned, respectively, compared with 1.1 million in California.
- California ranks as the state where homeowners are most vulnerable to wildfire-related insurance stress. It received a LendingTree vulnerability score of 76.5, driven by its 98th-percentile wildfire risk and the nation’s highest homeowner cost-burden rate of 27.8%, despite home insurance accounting for just 3.8% of monthly housing costs.
- Texas has the highest estimated number of buildings directly exposed to wildfires. An estimated 4.4 million buildings in Texas are directly exposed, followed by 3.7 million in North Carolina and 3.0 million in Georgia. Nationwide, 60.8 million buildings, or 41.5% of all buildings, are directly exposed.
- Nearly 4 in 10 insured homeowners say they’re at least very concerned that wildfire risk could affect their home insurance costs or coverage in the next few years. 39% are extremely or very concerned, and another 19% say they’re somewhat concerned. Meanwhile, 41% say a wildfire-related premium increase would be extremely or very difficult to afford, including 18% who say they’d likely have to reduce or drop coverage.
- Most insured homeowners are at least somewhat confident their policy would cover wildfire damage, but uncertainty remains. 65% are very or somewhat confident, while 21% aren’t very or at all confident, and 13% aren’t sure what their policy covers.
Wildfires are multiplying fast, and not just in the West
The number of annual wildfires has risen a striking amount nationally, climbing 28.8% from 50,380 in 2019 to 64,897 in 2024 — the latest year for which data is available.
Rob Bhatt, LendingTree home insurance expert and a licensed insurance agent, says this trend is particularly concerning, especially because insurance companies have become increasingly sensitive to wildfire risks.
“Insurers have seen how expensive it can be to rebuild homes in areas devastated by wildfires and are taking steps to protect themselves from those costs in the future,” he says. “These steps include raising rates for homes with wildfire risks and denying coverage to homes with the greatest risks. Unfortunately, this is creating hardships for homeowners in these areas. Many are seeing their rates spike, and others are having a hard time even getting insurance.”
Massachusetts recorded the largest increase among the states in our analysis, which included only states with at least 100 wildfires in both 2019 and 2024. There, wildfires rose a whopping 349.5% from 289 to 1,299. Oklahoma (175.5%) and Pennsylvania (164.7%) ranked second and third, respectively.
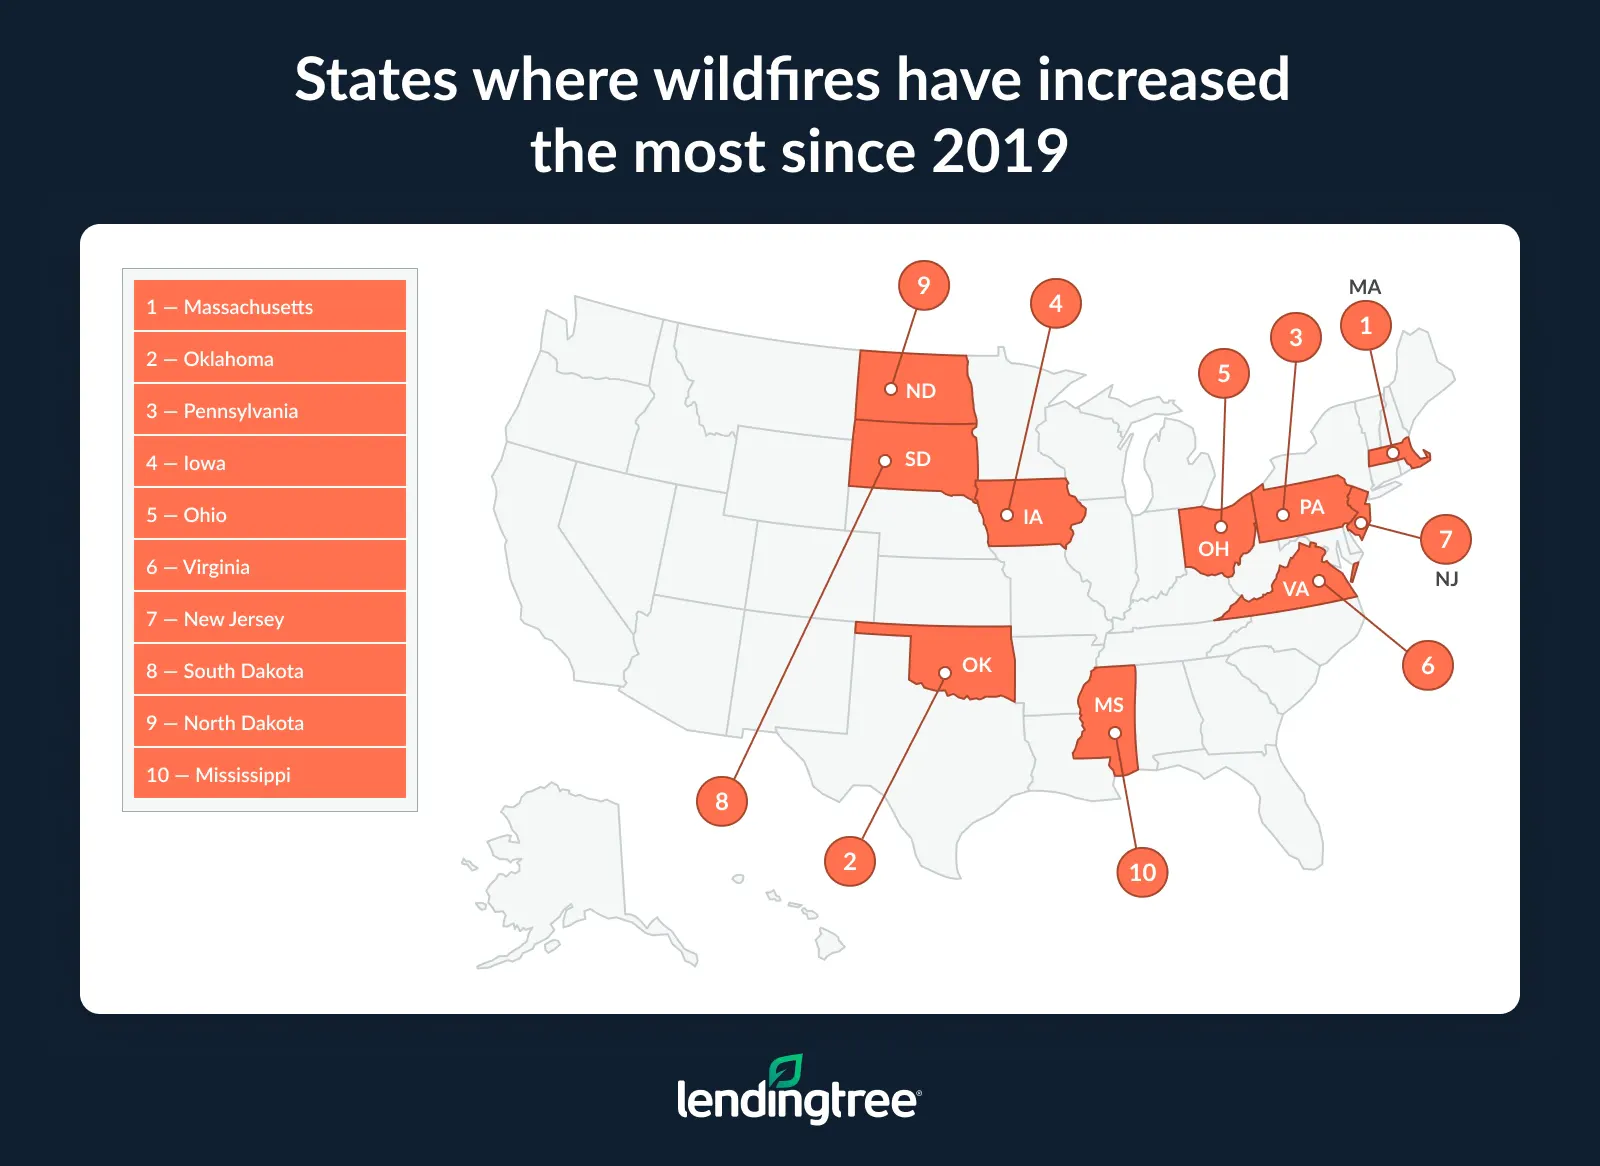
In total, six states saw wildfire increases exceeding 100.0%, with Iowa (136.6%), Ohio (122.3%) and Virginia (103.8%) joining the top three.
On the other end of the list, just five states saw a decrease in wildfires between 2019 and 2024. Alaska led with a 47.6% decline, followed by Texas (27.9%) and Georgia (21.1%). New Mexico (4.2%) and Oregon (2.7%) also recorded slight decreases.
Full rankings: States where wildfires have increased the most since 2019
| Rank | State | Wildfires, 2019 | Wildfires, 2024 | # change | % change |
|---|---|---|---|---|---|
| 1 | Massachusetts | 289 | 1,299 | 1,010 | 349.5% |
| 2 | Oklahoma | 1,104 | 3,041 | 1,937 | 175.5% |
| 3 | Pennsylvania | 547 | 1,448 | 901 | 164.7% |
| 4 | Iowa | 153 | 362 | 209 | 136.6% |
| 5 | Ohio | 498 | 1,107 | 609 | 122.3% |
| 6 | Virginia | 364 | 742 | 378 | 103.8% |
| 7 | New Jersey | 727 | 1,443 | 716 | 98.5% |
| 8 | South Dakota | 346 | 675 | 329 | 95.1% |
| 9 | North Dakota | 488 | 935 | 447 | 91.6% |
| 10 | Mississippi | 959 | 1,800 | 841 | 87.7% |
| 11 | West Virginia | 593 | 1,104 | 511 | 86.2% |
| 12 | Arkansas | 660 | 1,219 | 559 | 84.7% |
| 13 | Maine | 355 | 653 | 298 | 83.9% |
| 14 | Nevada | 562 | 929 | 367 | 65.3% |
| 15 | Wisconsin | 710 | 1,162 | 452 | 63.7% |
| 16 | Montana | 1,474 | 2,323 | 849 | 57.6% |
| 17 | Wyoming | 486 | 738 | 252 | 51.9% |
| 18 | Idaho | 960 | 1,450 | 490 | 51.0% |
| 19 | Alabama | 1,107 | 1,525 | 418 | 37.8% |
| 20 | Washington | 1,394 | 1,806 | 412 | 29.6% |
| 21 | Kentucky | 755 | 957 | 202 | 26.8% |
| 22 | Maryland | 140 | 174 | 34 | 24.3% |
| 23 | Michigan | 361 | 447 | 86 | 23.8% |
| 24 | North Carolina | 3,872 | 4,668 | 796 | 20.6% |
| 25 | Utah | 1,025 | 1,211 | 186 | 18.1% |
| 26 | Arizona | 1,869 | 2,191 | 322 | 17.2% |
| 27 | Florida | 2,121 | 2,348 | 227 | 10.7% |
| 28 | Minnesota | 1,021 | 1,123 | 102 | 10.0% |
| 29 | Louisiana | 361 | 385 | 24 | 6.6% |
| 30 | Tennessee | 571 | 596 | 25 | 4.4% |
| 31 | Colorado | 857 | 894 | 37 | 4.3% |
| 32 | California | 8,194 | 8,316 | 122 | 1.5% |
| 33 | Oregon | 2,293 | 2,232 | -61 | -2.7% |
| 34 | New Mexico | 859 | 823 | -36 | -4.2% |
| 35 | Georgia | 3,158 | 2,492 | -666 | -21.1% |
| 36 | Texas | 6,892 | 4,967 | -1,925 | -27.9% |
| 37 | Alaska | 720 | 377 | -343 | -47.6% |
California records the most wildfires, but Oregon and Texas burn more acreage
California tops the charts for the sheer number of wildfires, logging 8,316 in 2024 — 12.8% of the 64,897 wildfires reported nationwide. Texas ranked second, with 4,967 fires, accounting for 7.7% of the national total. North Carolina ranked third with 4,668 wildfires, representing 7.2% of the national share.
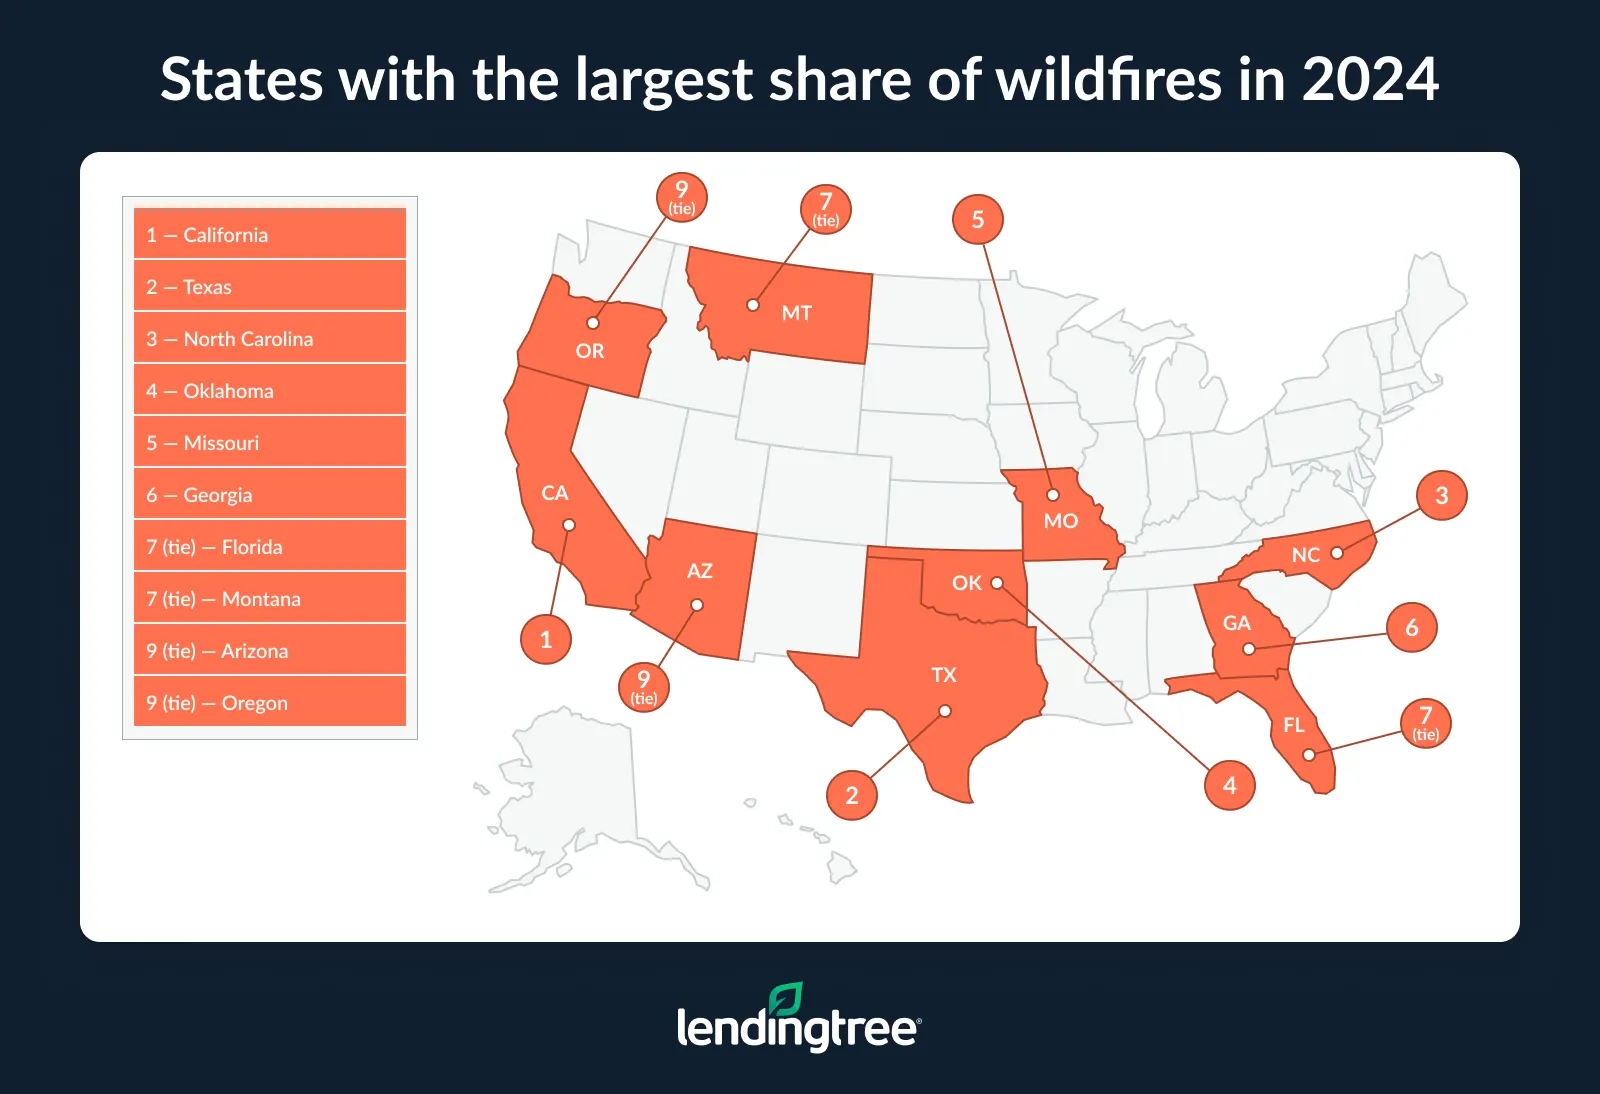
But raw fire counts don’t tell the whole story. When it comes to acreage, Oregon and Texas led: Despite reporting fewer incidents than California, the states recorded 1.8 million and 1.3 million acres burned, respectively — more than the 1.1 million in California.
At the other end of the spectrum, several states barely register. The District of Columbia and Delaware ranked last, each accounting for 0.0% of the nation’s wildfire activity. Just above them, a cluster of states — Kansas, Illinois, Vermont, Rhode Island, Indiana, Hawaii and South Carolina — each contributed only a sliver of the national total, with wildfire counts ranging from 41 to 97 and shares of just 0.1%.
Full rankings: States with the largest share of wildfires in 2024
| Rank | State | Wildfires | Acres burned | % of all wildfires |
|---|---|---|---|---|
| 1 | California | 8,316 | 1,081,144 | 12.8% |
| 2 | Texas | 4,967 | 1,314,903 | 7.7% |
| 3 | North Carolina | 4,668 | 18,233 | 7.2% |
| 4 | Oklahoma | 3,041 | 383,592 | 4.7% |
| 5 | Missouri | 2,804 | 95,095 | 4.3% |
| 6 | Georgia | 2,492 | 11,896 | 3.8% |
| 7 | Florida | 2,348 | 65,618 | 3.6% |
| 7 | Montana | 2,323 | 352,491 | 3.6% |
| 9 | Arizona | 2,191 | 282,989 | 3.4% |
| 9 | Oregon | 2,232 | 1,797,796 | 3.4% |
| 11 | Mississippi | 1,800 | 55,880 | 2.8% |
| 11 | Washington | 1,806 | 275,593 | 2.8% |
| 13 | Alabama | 1,525 | 20,978 | 2.3% |
| 14 | Idaho | 1,450 | 996,762 | 2.2% |
| 14 | New Jersey | 1,443 | 12,449 | 2.2% |
| 14 | Pennsylvania | 1,448 | 3,792 | 2.2% |
| 17 | Massachusetts | 1,299 | 4,622 | 2.0% |
| 18 | Utah | 1,211 | 90,417 | 1.9% |
| 18 | Arkansas | 1,219 | 25,444 | 1.9% |
| 20 | Wisconsin | 1,162 | 2,597 | 1.8% |
| 21 | Minnesota | 1,123 | 15,125 | 1.7% |
| 21 | Ohio | 1,107 | 2,441 | 1.7% |
| 21 | West Virginia | 1,104 | 55,309 | 1.7% |
| 24 | Nebraska | 1,035 | 113,850 | 1.6% |
| 25 | Kentucky | 957 | 24,448 | 1.5% |
| 26 | Nevada | 929 | 70,410 | 1.4% |
| 26 | Colorado | 894 | 60,539 | 1.4% |
| 26 | North Dakota | 935 | 173,237 | 1.4% |
| 29 | New Mexico | 823 | 82,531 | 1.3% |
| 30 | Virginia | 742 | 56,372 | 1.1% |
| 30 | Wyoming | 738 | 620,069 | 1.1% |
| 32 | Maine | 653 | 295 | 1.0% |
| 32 | South Dakota | 675 | 35,809 | 1.0% |
| 34 | Tennessee | 596 | 7,771 | 0.9% |
| 35 | Michigan | 447 | 2,062 | 0.7% |
| 36 | Alaska | 377 | 667,075 | 0.6% |
| 36 | Louisiana | 385 | 9,058 | 0.6% |
| 36 | Iowa | 362 | 3,965 | 0.6% |
| 39 | Connecticut | 356 | 339 | 0.5% |
| 40 | Maryland | 174 | 965 | 0.3% |
| 41 | New Hampshire | 130 | 127 | 0.2% |
| 41 | New York | 125 | 6,496 | 0.2% |
| 43 | South Carolina | 50 | 634 | 0.1% |
| 43 | Hawaii | 90 | 452 | 0.1% |
| 43 | Indiana | 64 | 154 | 0.1% |
| 43 | Rhode Island | 73 | 75 | 0.1% |
| 43 | Vermont | 97 | 180 | 0.1% |
| 43 | Illinois | 47 | 441 | 0.1% |
| 43 | Kansas | 41 | 22,217 | 0.1% |
| 50 | Delaware | 23 | 137 | 0.0% |
| 50 | District of Columbia | 0 | 0 | 0.0% |
California homeowners face the greatest wildfire-related insurance pressure
No state carries a heavier insurance burden tied to wildfires than California. A combination of a near-worst-case 98th-percentile wildfire risk and the nation’s highest homeowner cost-burden rate of 27.8% pushed California to the top of LendingTree’s vulnerability rankings, with a score of 76.5. (The cost-burden rate measures the share of owner-occupied households spending at least 30% of their income on housing costs.)
Notably, this financial strain exists even though home insurance accounts for a relatively small slice of monthly housing costs in California, at just 3.8%.
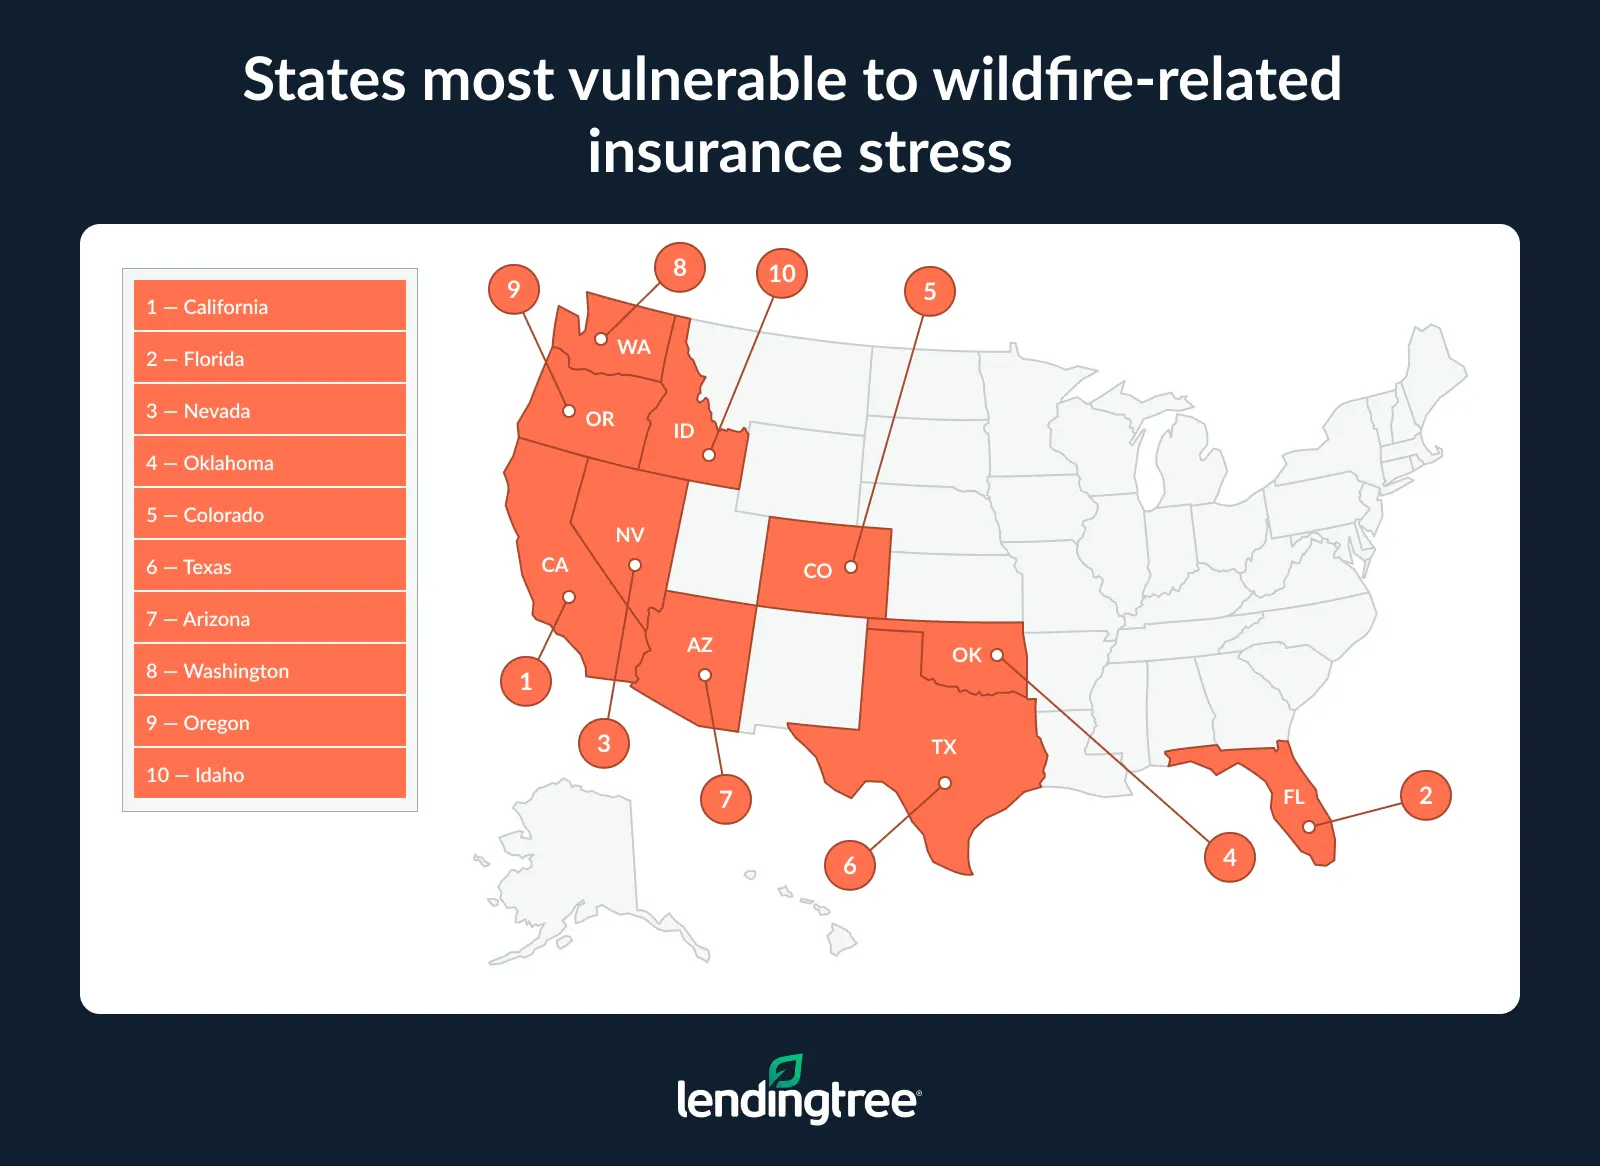
Florida, Nevada, Oklahoma and Colorado round out the top five. Nevada has the highest wildfire risk, ranking in the 100th percentile, while Oklahoma has the highest home insurance share among the top five at 17.6% of estimated monthly housing costs.
For homeowners in high-risk states, Bhatt says home insurance usually works best alongside other risk-reduction measures.
“Clearing defensible space around your home is a good first step,” he says. “It’s also worth investing in flame-retardant roofing and other building materials. Flying embers are another major risk because they allow wildfires to spread to homes. You can reduce that risk by installing ember-proof vents.”
Bhatt says it’s equally important to create and maintain a home inventory. “You can use your smartphone camera to create a video or photo inventory of your belongings, and take pictures of receipts, serial numbers and other relevant documentation,” he says. “Having a home inventory can take some of the hassle out of filing a claim with your insurance company and getting paid.”
Full rankings: States most vulnerable to wildfire-related insurance stress
| Rank | State | Wildfire risk percentile | Home insurance share of monthly housing costs | Cost-burden rate | Vulnerability score |
|---|---|---|---|---|---|
| 1 | California | 98th | 3.8% | 27.8% | 76.5 |
| 2 | Florida | 80th | 9.2% | 26.1% | 72.4 |
| 3 | Nevada | 100th | 6.9% | 21.8% | 71.8 |
| 4 | Oklahoma | 84th | 17.6% | 16.6% | 70.6 |
| 5 | Colorado | 72nd | 13.3% | 23.0% | 69.1 |
| 6 | Texas | 76th | 14.4% | 20.7% | 68.8 |
| 7 | Arizona | 86th | 9.5% | 19.9% | 65.4 |
| 8 | Washington | 94th | 4.9% | 21.3% | 65.2 |
| 9 | Oregon | 92nd | 5.1% | 21.6% | 64.9 |
| 10 | Idaho | 96th | 7.5% | 17.8% | 64.0 |
| 11 | Hawaii | 88th | 2.1% | 24.5% | 63.5 |
| 12 | New Mexico | 82nd | 13.0% | 16.8% | 63.2 |
| 13 | Nebraska | 62nd | 19.4% | 16.7% | 62.2 |
| 14 | Montana | 74th | 10.1% | 20.2% | 60.8 |
| 15 | Utah | 90th | 5.8% | 18.9% | 60.4 |
| 16 | Wyoming | 70th | 8.4% | 19.5% | 55.1 |
| 17 | South Carolina | 60th | 13.5% | 17.4% | 54.0 |
| 17 | New Jersey | 66th | 4.3% | 23.5% | 54.0 |
| 19 | South Dakota | 64th | 13.3% | 16.2% | 53.7 |
| 20 | Alaska | 78th | 4.5% | 18.4% | 51.7 |
| 21 | Kansas | 68th | 12.2% | 14.7% | 51.6 |
| 22 | Mississippi | 58th | 11.9% | 16.1% | 48.4 |
| 23 | Louisiana | 54th | 9.5% | 18.7% | 47.4 |
| 24 | Georgia | 48th | 10.0% | 19.7% | 46.7 |
| 25 | Alabama | 50th | 12.3% | 16.2% | 45.2 |
| 26 | Arkansas | 46th | 14.0% | 15.3% | 44.1 |
| 27 | Kentucky | 52nd | 12.1% | 15.0% | 43.9 |
| 28 | Tennessee | 42nd | 13.4% | 16.3% | 43.0 |
| 29 | North Carolina | 44th | 10.3% | 17.4% | 41.3 |
| 29 | Virginia | 40th | 10.6% | 18.3% | 41.3 |
| 31 | West Virginia | 56th | 10.2% | 13.0% | 39.7 |
| 32 | Maryland | 34th | 8.9% | 20.2% | 39.0 |
| 33 | Connecticut | 22nd | 8.7% | 22.1% | 35.9 |
| 34 | Rhode Island | 14th | 7.7% | 25.0% | 35.4 |
| 35 | Missouri | 38th | 8.9% | 15.6% | 33.3 |
| 36 | Minnesota | 32nd | 9.9% | 15.8% | 32.0 |
| 37 | North Dakota | 36th | 10.9% | 13.6% | 31.7 |
| 38 | New York | 12th | 5.2% | 24.4% | 29.8 |
| 39 | Iowa | 28th | 10.6% | 14.5% | 28.8 |
| 40 | Massachusetts | 16th | 4.9% | 22.0% | 27.4 |
| 41 | Pennsylvania | 26th | 7.4% | 16.4% | 26.5 |
| 42 | Illinois | 10th | 9.9% | 18.9% | 26.3 |
| 43 | Delaware | 30th | 4.6% | 17.3% | 25.9 |
| 44 | Michigan | 24th | 6.9% | 16.3% | 24.5 |
| 45 | Wisconsin | 20th | 6.8% | 15.6% | 21.2 |
| 46 | Ohio | 18th | 7.0% | 15.8% | 20.8 |
| 47 | New Hampshire | 8th | 3.6% | 20.2% | 18.4 |
| 48 | District of Columbia | 6th | 3.5% | 19.7% | 16.4 |
| 49 | Vermont | 4th | 3.2% | 19.8% | 15.1 |
| 50 | Indiana | 2nd | 9.2% | 14.9% | 14.5 |
| 51 | Maine | 0 | 4.8% | 17.3% | 11.3 |
Millions of buildings lie in wildfire paths
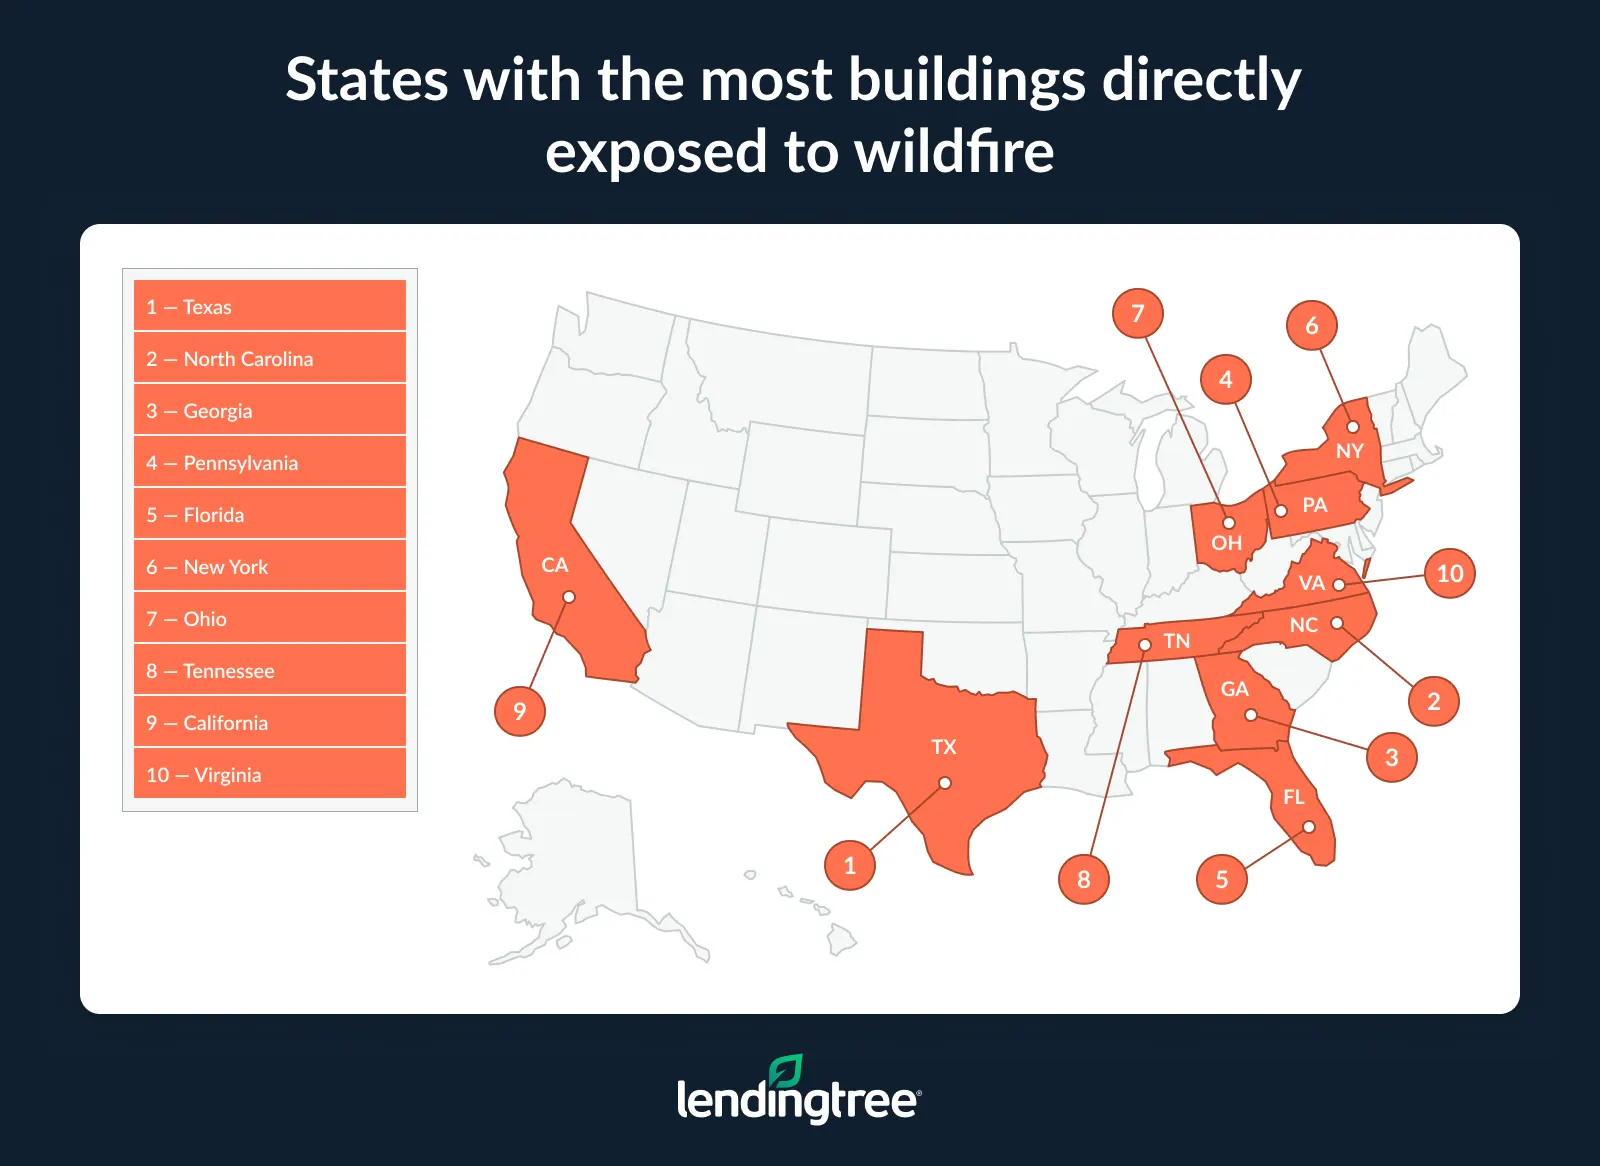
Not only did Texas record the second-most burned acreage, but it also has the highest estimated number of buildings directly exposed to wildfires.
An estimated 4.4 million buildings in Texas are directly exposed, followed by 3.7 million in North Carolina and 3.0 million in Georgia. Nationwide, 60.8 million buildings, or 41.5% of all buildings, are directly exposed.
California counties account for six of the 10 high-wildfire-risk counties with the most buildings directly exposed. Riverside County, Calif., ranks first, with a wildfire risk in the 99th percentile and an estimated 144,599 buildings directly exposed, followed by Los Angeles County, Calif., with 138,530.
Counties in Florida, Idaho, Washington and Colorado also appear in the top 10.
Meanwhile, the number of housing units near wildfire-prone land grew 17.3% nationally from 1990 to 2020. Nevada saw the largest increase at 55.3%, followed by Arizona at 45.6%, Colorado at 32.3%, Utah at 31.5% and New Mexico at 30.2%.
Full rankings: States with the most buildings directly exposed to wildfire
| Rank | State | Total buildings | % of buildings directly exposed | Estimated buildings directly exposed |
|---|---|---|---|---|
| 1 | Texas | 12,347,448 | 35.6% | 4,389,518 |
| 2 | North Carolina | 5,421,521 | 68.2% | 3,699,646 |
| 3 | Georgia | 4,535,436 | 65.6% | 2,972,978 |
| 4 | Pennsylvania | 5,567,540 | 49.3% | 2,744,240 |
| 5 | Florida | 7,946,374 | 31.2% | 2,475,296 |
| 6 | New York | 5,913,464 | 41.6% | 2,460,001 |
| 7 | Ohio | 6,245,944 | 37.3% | 2,330,986 |
| 8 | Tennessee | 3,602,801 | 64.5% | 2,322,005 |
| 9 | California | 12,687,368 | 17.7% | 2,240,589 |
| 10 | Virginia | 3,639,801 | 58.8% | 2,138,383 |
| 11 | Michigan | 5,407,474 | 38.9% | 2,102,967 |
| 12 | Alabama | 2,858,222 | 67.6% | 1,931,015 |
| 13 | Kentucky | 2,802,785 | 66.5% | 1,863,291 |
| 14 | Missouri | 3,528,801 | 48.4% | 1,707,940 |
| 15 | South Carolina | 2,649,913 | 63.2% | 1,675,540 |
| 16 | Wisconsin | 3,449,059 | 42.7% | 1,473,093 |
| 17 | Indiana | 3,745,916 | 36.4% | 1,365,012 |
| 18 | Minnesota | 3,186,753 | 42.1% | 1,341,304 |
| 19 | Mississippi | 1,784,880 | 69.7% | 1,244,597 |
| 20 | Oklahoma | 2,418,967 | 51.4% | 1,243,833 |
| 21 | Arkansas | 1,817,115 | 61.4% | 1,115,163 |
| 22 | Washington | 3,290,268 | 32.8% | 1,079,208 |
| 23 | Louisiana | 2,490,347 | 42.2% | 1,049,930 |
| 24 | Maryland | 2,074,964 | 46.4% | 963,406 |
| 25 | Illinois | 5,674,916 | 16.8% | 952,251 |
| 26 | New Jersey | 2,830,975 | 32.0% | 906,478 |
| 27 | West Virginia | 1,189,424 | 66.5% | 790,491 |
| 28 | Colorado | 2,427,747 | 32.3% | 783,920 |
| 29 | Massachusetts | 2,354,942 | 32.4% | 763,001 |
| 30 | Arizona | 3,025,278 | 24.8% | 749,664 |
| 31 | Connecticut | 1,546,887 | 48.4% | 748,848 |
| 32 | Iowa | 2,297,525 | 31.9% | 732,221 |
| 33 | Oregon | 1,993,291 | 36.5% | 727,551 |
| 34 | Kansas | 1,756,898 | 37.7% | 662,526 |
| 35 | Maine | 872,167 | 72.6% | 632,932 |
| 36 | New Mexico | 1,143,361 | 45.7% | 522,516 |
| 37 | Montana | 835,351 | 54.9% | 458,524 |
| 38 | Idaho | 996,427 | 45.0% | 448,193 |
| 39 | New Hampshire | 635,311 | 64.5% | 409,903 |
| 40 | Nebraska | 1,288,623 | 31.3% | 402,824 |
| 41 | South Dakota | 707,870 | 53.9% | 381,259 |
| 42 | North Dakota | 647,428 | 50.6% | 327,340 |
| 43 | Vermont | 399,767 | 75.5% | 301,824 |
| 44 | Utah | 1,201,820 | 24.2% | 290,840 |
| 45 | Wyoming | 395,158 | 49.6% | 196,038 |
| 46 | Alaska | 307,198 | 62.0% | 190,432 |
| 47 | Delaware | 413,060 | 38.9% | 160,639 |
| 48 | Nevada | 1,101,478 | 12.8% | 140,549 |
| 49 | Hawaii | 425,808 | 26.6% | 113,393 |
| 50 | Rhode Island | 408,194 | 23.3% | 94,946 |
| 51 | District of Columbia | 135,874 | 4.6% | 6,250 |
Full rankings: Counties with the most buildings directly exposed to wildfire
| Rank | County/borough/census area | Wildfire risk percentile | Total buildings | % of buildings directly exposed | Estimated buildings directly exposed |
|---|---|---|---|---|---|
| 1 | Riverside County, CA | 99th | 839,226 | 17.2% | 144,599 |
| 2 | Los Angeles County, CA | 99th | 2,748,612 | 5.0% | 138,530 |
| 3 | El Dorado County, CA | 99th | 100,466 | 64.7% | 64,951 |
| 4 | Placer County, CA | 98th | 176,004 | 36.1% | 63,537 |
| 5 | San Luis Obispo County, CA | 98th | 152,493 | 41.3% | 62,949 |
| 6 | Brevard County, FL | 98th | 258,467 | 24.1% | 62,368 |
| 7 | Ada County, ID | 99th | 200,711 | 26.9% | 53,911 |
| 8 | Shasta County, CA | 99th | 98,665 | 53.3% | 52,579 |
| 9 | Yakima County, WA | 99th | 121,396 | 40.8% | 49,566 |
| 10 | Jefferson County, CO | 98th | 210,118 | 21.1% | 44,230 |
| 11 | Monterey County, CA | 99th | 148,198 | 29.5% | 43,704 |
| 12 | Santa Clara County, CA | 97th | 518,508 | 8.2% | 42,621 |
| 13 | Collier County, FL | 97th | 152,377 | 26.7% | 40,715 |
| 14 | Douglas County, CO | 98th | 123,588 | 31.4% | 38,856 |
| 15 | Santa Barbara County, CA | 97th | 146,809 | 25.5% | 37,378 |
| 16 | Tuolumne County, CA | 99th | 44,250 | 83.5% | 36,953 |
| 17 | Calaveras County, CA | 99th | 42,602 | 83.9% | 35,760 |
| 18 | Boulder County, CO | 97th | 119,558 | 26.7% | 31,922 |
| 19 | Ravalli County, MT | 99th | 37,573 | 83.4% | 31,343 |
| 20 | Utah County, UT | 97th | 179,533 | 17.3% | 31,059 |
| 21 | Tehama County, CA | 99th | 42,159 | 69.7% | 29,397 |
| 22 | Washoe County, NV | 97th | 176,157 | 16.3% | 28,784 |
| 23 | Okanogan County, WA | 99th | 39,270 | 71.5% | 28,062 |
| 24 | Fairbanks North Star Borough, AK | 98th | 38,877 | 71.5% | 27,801 |
| 25 | Otero County, NM | 98th | 43,295 | 59.8% | 25,903 |
| 26 | Alameda County, CA | 97th | 459,757 | 5.4% | 24,965 |
| 27 | Washington County, UT | 97th | 74,875 | 32.7% | 24,499 |
| 28 | Siskiyou County, CA | 98th | 38,220 | 62.7% | 23,960 |
| 29 | Randall County, TX | 97th | 67,260 | 32.4% | 21,792 |
| 30 | Amador County, CA | 98th | 26,925 | 74.0% | 19,935 |
| 31 | Gila County, AZ | 98th | 38,470 | 50.9% | 19,581 |
| 32 | Honolulu County, HI | 99th | 236,799 | 8.2% | 19,441 |
| 33 | Teller County, CO | 99th | 18,563 | 86.9% | 16,124 |
| 34 | Yuba County, CA | 99th | 34,127 | 47.1% | 16,060 |
| 35 | Mariposa County, CA | 98th | 16,578 | 94.8% | 15,723 |
| 36 | Idaho County, ID | 99th | 19,575 | 77.1% | 15,098 |
| 37 | Twin Falls County, ID | 97th | 45,802 | 32.8% | 15,023 |
| 38 | Santa Cruz County, AZ | 98th | 20,839 | 68.7% | 14,310 |
| 39 | Plumas County, CA | 98th | 19,648 | 70.1% | 13,771 |
| 40 | Potter County, TX | 98th | 59,109 | 22.8% | 13,465 |
| 41 | Valley County, ID | 98th | 15,996 | 82.4% | 13,176 |
| 42 | Lassen County, CA | 97th | 20,026 | 62.9% | 12,594 |
| 43 | Iron County, UT | 97th | 24,102 | 47.1% | 11,345 |
| 44 | San Benito County, CA | 99th | 28,641 | 39.4% | 11,290 |
| 45 | Douglas County, NV | 97th | 29,014 | 38.4% | 11,144 |
| 46 | Bannock County, ID | 99th | 37,696 | 28.9% | 10,909 |
| 47 | Gem County, ID | 99th | 13,682 | 71.4% | 9,768 |
| 48 | Wasco County, OR | 99th | 18,294 | 48.7% | 8,913 |
| 49 | Okfuskee County, OK | 96th | 10,783 | 82.5% | 8,896 |
| 50 | Roosevelt County, NM | 98th | 15,828 | 54.6% | 8,647 |
| 51 | Ferry County, WA | 97th | 9,075 | 90.5% | 8,214 |
| 52 | Jack County, TX | 96th | 10,495 | 78.0% | 8,189 |
| 53 | Boise County, ID | 98th | 8,130 | 89.1% | 7,242 |
| 54 | Cassia County, ID | 99th | 16,538 | 43.6% | 7,209 |
| 55 | Elmore County, ID | 99th | 16,430 | 43.5% | 7,140 |
| 56 | Humboldt County, NV | 99th | 12,949 | 54.0% | 6,990 |
| 57 | Gooding County, ID | 98th | 12,848 | 53.7% | 6,896 |
| 58 | Beaver County, OK | 97th | 8,777 | 77.6% | 6,813 |
| 59 | Catron County, NM | 96th | 6,707 | 94.4% | 6,331 |
| 60 | Clearwater County, ID | 97th | 8,746 | 72.2% | 6,313 |
| 61 | Mora County, NM | 96th | 6,393 | 92.4% | 5,906 |
| 62 | Cameron Parish, LA | 99th | 7,985 | 73.8% | 5,890 |
| 63 | Colusa County, CA | 98th | 13,839 | 41.4% | 5,729 |
| 64 | Southeast Fairbanks Census Area, AK | 97th | 6,152 | 85.9% | 5,287 |
| 65 | Roger Mills County, OK | 97th | 6,576 | 79.0% | 5,196 |
| 66 | Washington County, ID | 97th | 10,196 | 49.1% | 5,006 |
| 67 | Wheeler County, TX | 99th | 7,874 | 63.5% | 5,001 |
| 68 | Gilpin County, CO | 96th | 5,098 | 91.9% | 4,687 |
| 69 | Adams County, ID | 98th | 5,600 | 82.7% | 4,630 |
| 70 | Hutchinson County, TX | 99th | 16,633 | 26.9% | 4,478 |
| 71 | Gray County, TX | 99th | 16,348 | 26.3% | 4,303 |
| 72 | Ellis County, OK | 98th | 6,264 | 61.5% | 3,849 |
| 73 | Monroe County, FL | 99th | 45,789 | 8.0% | 3,663 |
| 74 | Elk County, KS | 97th | 4,585 | 74.1% | 3,397 |
| 75 | Moore County, TX | 98th | 12,724 | 25.1% | 3,199 |
| 76 | Hemphill County, TX | 99th | 4,866 | 62.6% | 3,047 |
| 77 | Donley County, TX | 97th | 4,622 | 65.0% | 3,005 |
| 78 | Carson County, TX | 98th | 6,339 | 47.0% | 2,981 |
| 79 | Jeff Davis County, TX | 98th | 3,667 | 80.7% | 2,958 |
| 80 | Lincoln County, ID | 97th | 4,649 | 62.6% | 2,912 |
| 81 | Juab County, UT | 98th | 6,784 | 42.9% | 2,907 |
| 82 | Barber County, KS | 97th | 6,204 | 45.4% | 2,816 |
| 83 | Oneida County, ID | 98th | 4,623 | 59.9% | 2,767 |
| 84 | Harper County, OK | 97th | 4,931 | 54.9% | 2,709 |
| 85 | Lipscomb County, TX | 99th | 4,185 | 61.3% | 2,565 |
| 86 | Crockett County, TX | 97th | 4,775 | 53.4% | 2,548 |
| 87 | Power County, ID | 98th | 6,231 | 40.8% | 2,544 |
| 88 | Carson City, NV | 98th | 22,496 | 10.3% | 2,308 |
| 89 | Greenlee County, AZ | 97th | 6,626 | 33.7% | 2,234 |
| 90 | Bailey County, TX | 97th | 5,324 | 40.2% | 2,138 |
| 91 | Wheeler County, OR | 96th | 2,480 | 79.1% | 1,962 |
| 92 | Eureka County, NV | 98th | 2,812 | 68.1% | 1,916 |
| 93 | Irion County, TX | 98th | 2,508 | 72.3% | 1,814 |
| 94 | Storey County, NV | 98th | 3,201 | 56.2% | 1,798 |
| 95 | Comanche County, KS | 99th | 2,804 | 58.0% | 1,626 |
| 96 | Briscoe County, TX | 97th | 2,593 | 62.4% | 1,617 |
| 97 | Armstrong County, TX | 97th | 2,442 | 66.1% | 1,615 |
| 98 | Sherman County, OR | 97th | 2,597 | 61.9% | 1,608 |
| 99 | Motley County, TX | 97th | 2,046 | 72.2% | 1,478 |
| 100 | Sterling County, TX | 98th | 1,818 | 56.9% | 1,034 |
Full rankings: States where housing has grown the most near wildfire-prone land
| Rank | State | Units near wildfire-prone land, 1990 | Units near wildfire-prone land, 2020 | # change | % change |
|---|---|---|---|---|---|
| 1 | Nevada | 185,402 | 287,960 | 102,558 | 55.3% |
| 2 | Arizona | 653,144 | 950,860 | 297,716 | 45.6% |
| 3 | Colorado | 575,018 | 760,548 | 185,530 | 32.3% |
| 4 | Utah | 274,836 | 361,372 | 86,536 | 31.5% |
| 5 | New Mexico | 394,770 | 513,841 | 119,071 | 30.2% |
| 6 | Idaho | 171,757 | 222,694 | 50,937 | 29.7% |
| 7 | Florida | 1,330,263 | 1,696,428 | 366,165 | 27.5% |
| 8 | Georgia | 1,165,624 | 1,449,011 | 283,387 | 24.3% |
| 9 | North Carolina | 1,284,186 | 1,592,195 | 308,009 | 24.0% |
| 10 | South Carolina | 781,779 | 966,772 | 184,993 | 23.7% |
| 11 | Alabama | 880,338 | 1,069,740 | 189,402 | 21.5% |
| 12 | Mississippi | 500,104 | 604,142 | 104,038 | 20.8% |
| 13 | Virginia | 924,533 | 1,113,242 | 188,709 | 20.4% |
| 14 | Tennessee | 638,716 | 768,522 | 129,806 | 20.3% |
| 14 | Arkansas | 402,318 | 483,804 | 81,486 | 20.3% |
| 16 | Missouri | 367,422 | 440,952 | 73,530 | 20.0% |
| 16 | Washington | 661,337 | 793,373 | 132,036 | 20.0% |
| 18 | Michigan | 807,437 | 966,644 | 159,207 | 19.7% |
| 19 | Texas | 1,747,701 | 2,083,507 | 335,806 | 19.2% |
| 20 | Alaska | 140,831 | 166,798 | 25,967 | 18.4% |
| 21 | Hawaii | 354,853 | 419,423 | 64,570 | 18.2% |
| 22 | Oregon | 405,910 | 479,224 | 73,314 | 18.1% |
| 23 | Montana | 220,640 | 257,180 | 36,540 | 16.6% |
| 24 | Maryland | 462,764 | 539,197 | 76,433 | 16.5% |
| 25 | Delaware | 29,240 | 33,928 | 4,688 | 16.0% |
| 26 | Maine | 433,189 | 496,980 | 63,791 | 14.7% |
| 27 | California | 3,646,036 | 4,157,221 | 511,185 | 14.0% |
| 28 | Indiana | 249,754 | 283,927 | 34,173 | 13.7% |
| 28 | Rhode Island | 111,367 | 126,593 | 15,226 | 13.7% |
| 30 | Wisconsin | 438,458 | 497,430 | 58,972 | 13.4% |
| 31 | South Dakota | 72,266 | 81,620 | 9,354 | 12.9% |
| 32 | Louisiana | 661,266 | 742,509 | 81,243 | 12.3% |
| 33 | Kentucky | 499,086 | 559,476 | 60,390 | 12.1% |
| 34 | North Dakota | 35,113 | 39,272 | 4,159 | 11.8% |
| 35 | New Hampshire | 373,742 | 414,588 | 40,846 | 10.9% |
| 36 | Wyoming | 157,928 | 174,788 | 16,860 | 10.7% |
| 37 | Vermont | 184,570 | 203,491 | 18,921 | 10.3% |
| 38 | Minnesota | 336,004 | 369,462 | 33,458 | 10.0% |
| 39 | Oklahoma | 503,032 | 552,929 | 49,897 | 9.9% |
| 40 | Massachusetts | 980,861 | 1,076,819 | 95,958 | 9.8% |
| 41 | Ohio | 675,058 | 737,551 | 62,493 | 9.3% |
| 42 | West Virginia | 618,137 | 670,289 | 52,152 | 8.4% |
| 42 | Connecticut | 634,104 | 687,671 | 53,567 | 8.4% |
| 44 | Illinois | 334,407 | 361,966 | 27,559 | 8.2% |
| 45 | New Jersey | 716,714 | 774,394 | 57,680 | 8.0% |
| 46 | Pennsylvania | 1,731,827 | 1,868,728 | 136,901 | 7.9% |
| 46 | New York | 1,416,568 | 1,528,305 | 111,737 | 7.9% |
| 48 | Kansas | 146,961 | 153,105 | 6,144 | 4.2% |
| 49 | Nebraska | 93,991 | 97,782 | 3,791 | 4.0% |
| 50 | Iowa | 71,004 | 70,897 | -107 | -0.2% |
| 51 | District of Columbia | 4,019 | 1,654 | -2,365 | -58.8% |
Homeowners are bracing for higher premiums
The threat isn’t lost on the people footing the bill, according to a separate LendingTree survey of 2,000 U.S. consumers. Among homeowners with home insurance, 39% say they’re extremely or very concerned that wildfire risk could drive up their insurance costs or shrink their coverage, and another 19% are somewhat concerned — a combined 58%.
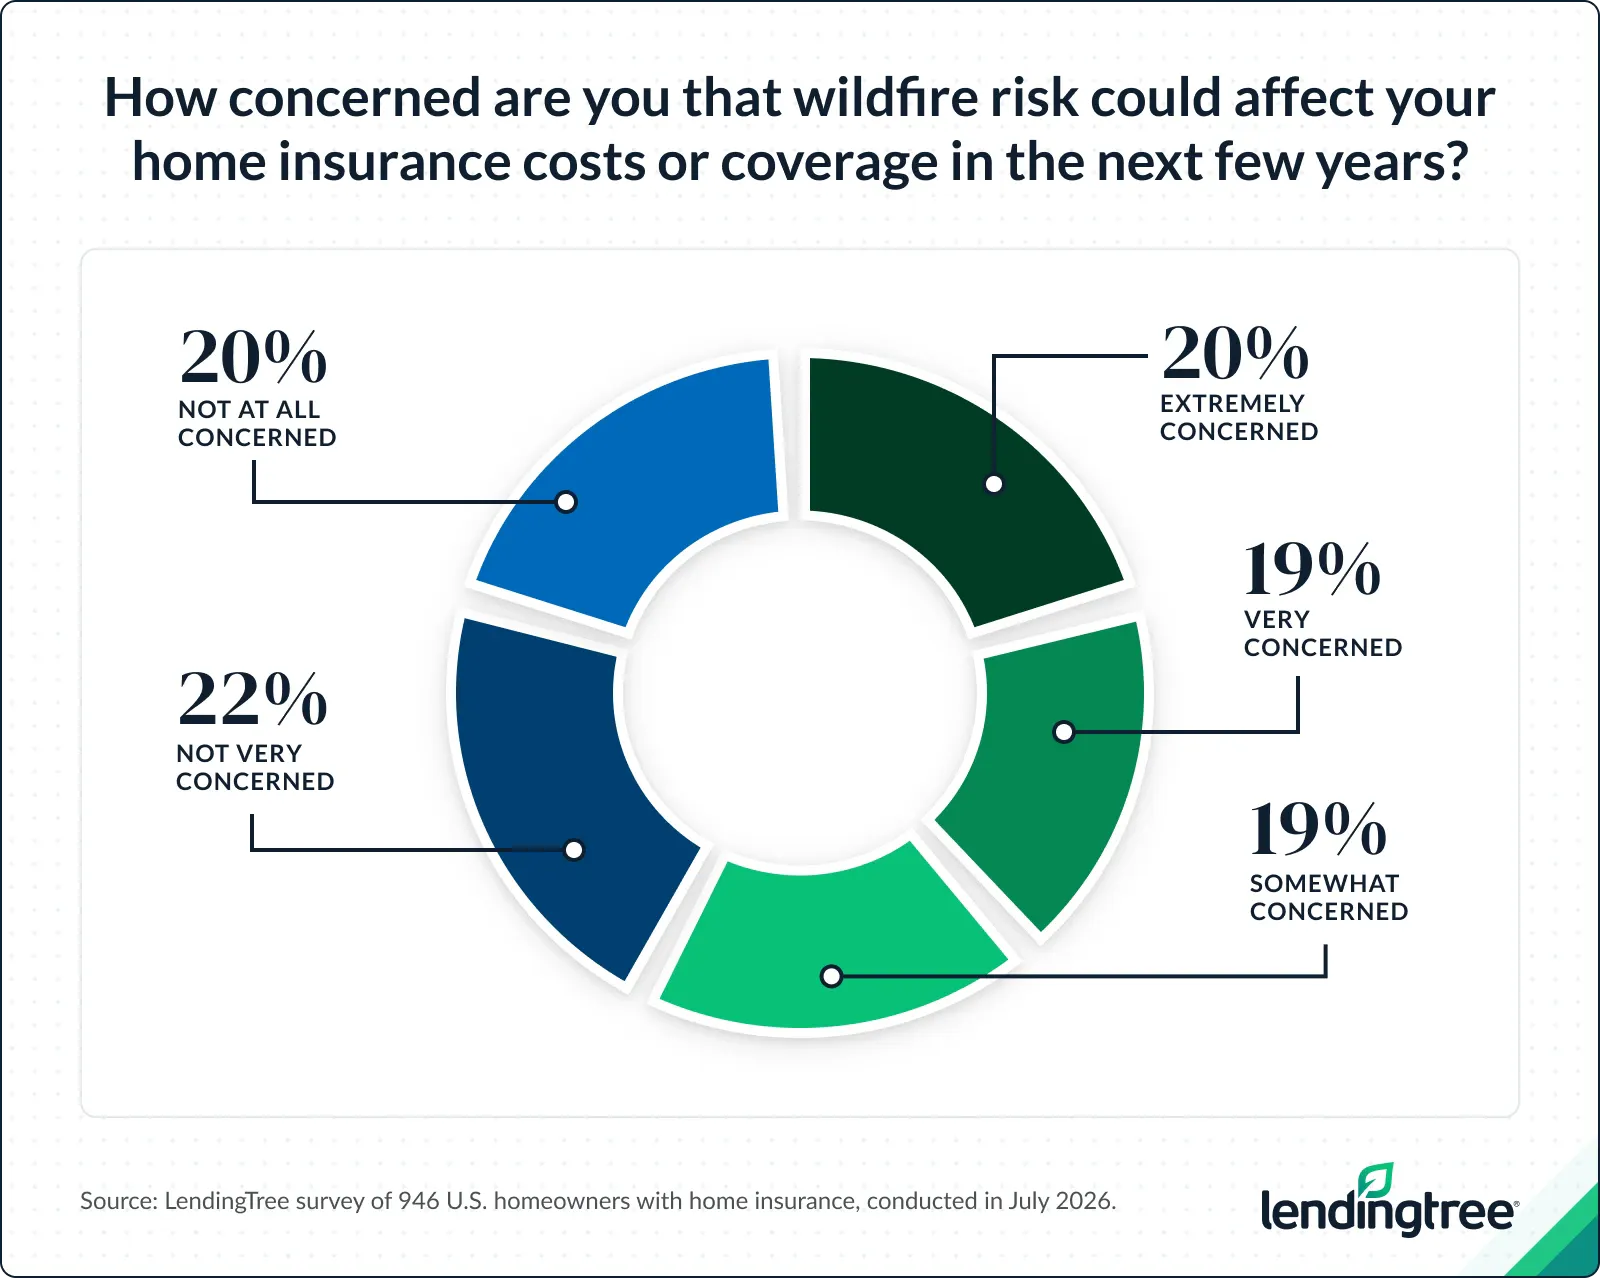
Affordability is the real sticking point, with 23% saying a wildfire-driven premium increase would cause significant financial strain and 18% saying they’d likely have to reduce or drop coverage altogether. Still, nearly a third (32%) say an increase would be manageable, although they would need to adjust their budget elsewhere.
That anxiety is already translating into action for some. Nearly 1 in 5 (19%) homeowners with insurance say they’ve made changes to their coverage because of wildfire risk — such as switching insurers or increasing their coverage limits — and another 16% are considering similar moves. On the flip side, 44% say they don’t feel a need to change anything, while 10% say they’d like to adjust their coverage but feel their options are limited or unavailable where they live.
Confidence in coverage is high, but confusion remains
Despite their concerns, most insured homeowners still trust that their policies have their back. Among insured homeowners, 65% are very or somewhat confident their coverage would cover wildfire damage.
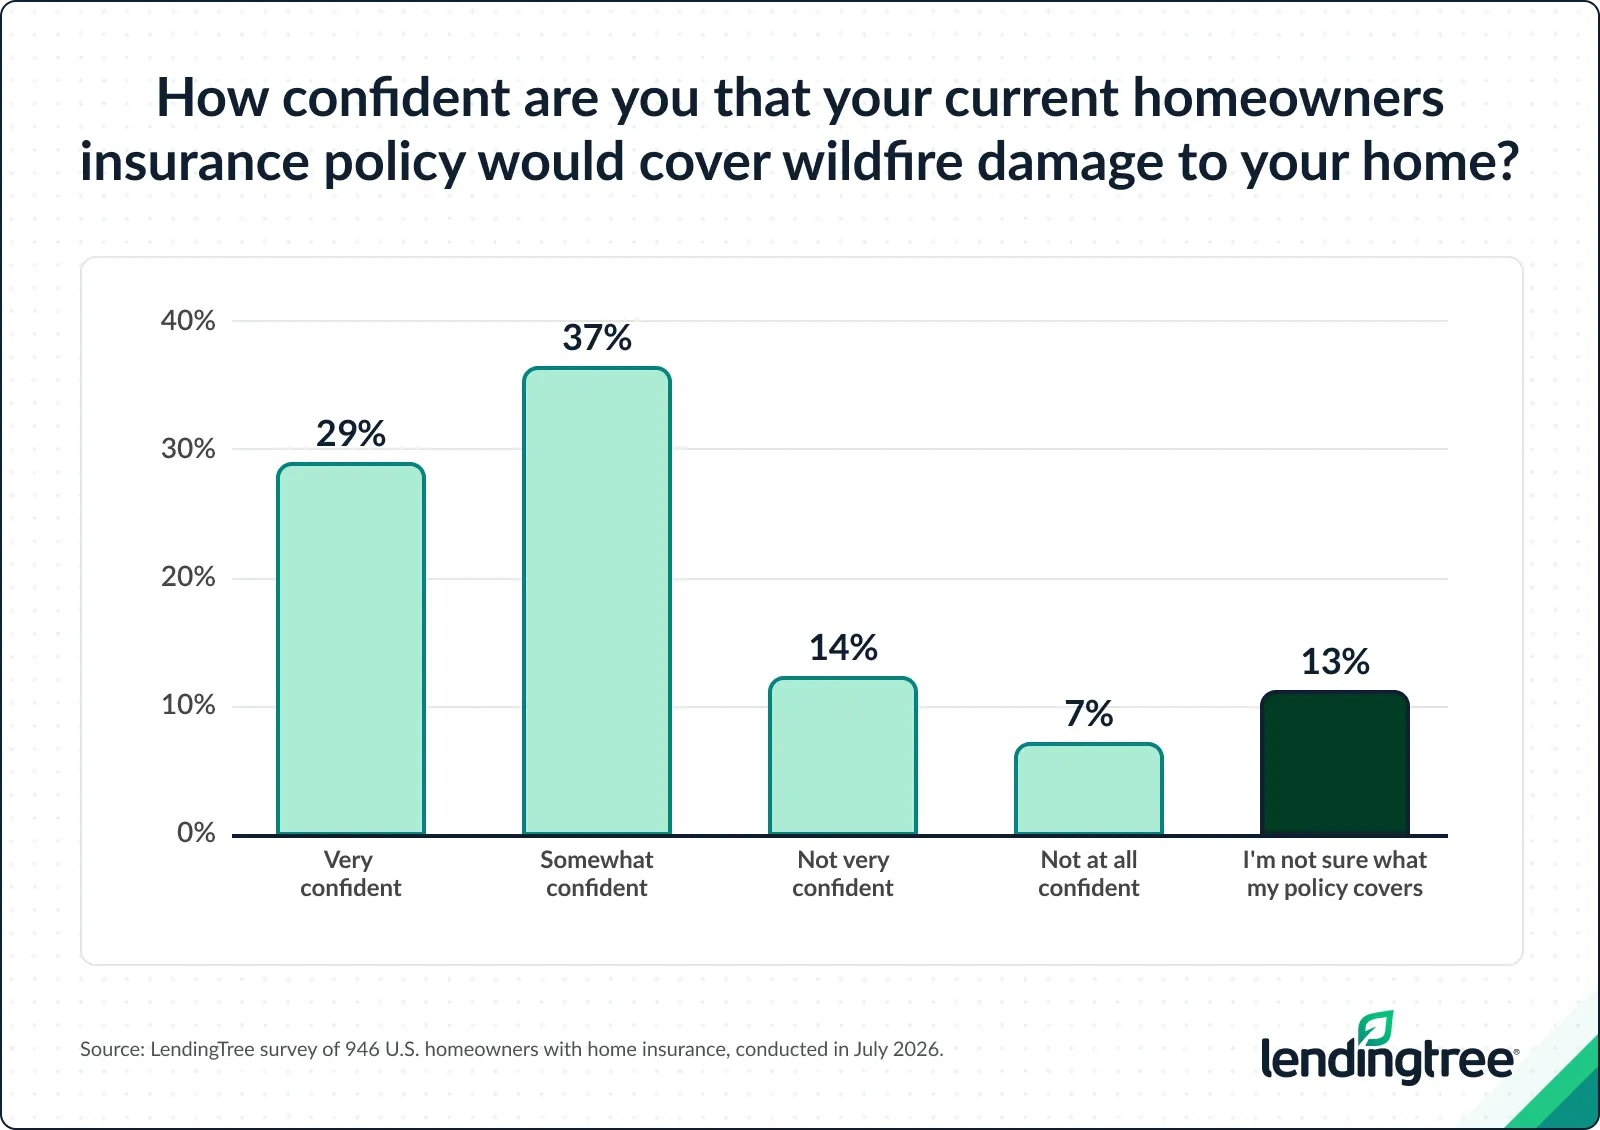
Still, that confidence isn’t universal. In fact, 14% say they’re not very confident, and 7% aren’t confident at all, while 13% simply don’t know what their policy covers — uncertainty that could create financial risk after a wildfire.
While standard homeowners insurance usually covers wildfire damage, coverage can vary by state. “In California, basic FAIR Plan policies cover fire and a few other risks, but not much else,” Bhatt says. “You can buy supplemental coverage to get many of the other protections that standard home insurance provides.”
Additionally, Nevada recently enacted a law that allows insurance companies to exclude wildfire coverage.
“If a policy excludes wildfires, you’ll have to buy separate coverage for them,” Bhatt says. “Review your policy summary or declarations page when you get your renewal notice each year. Check for any exclusions that may apply. You should also discuss your policy with your insurance agent and ask questions about anything you’re not sure about.”
Tips for preparing your home for wildfires
Wildfires can threaten both your property and your homeowners insurance. Taking proactive steps to reduce fire risk, documenting your home and understanding your policy can help you better prepare before a wildfire strikes. Consider the following steps:
- Take steps to protect your home. “Clear and maintain defensible space around your home, install ember-proof vents and take other steps to protect it from potential wildfires,” Bhatt says. “Create and maintain a home inventory to make it easier to file a claim if you’re affected by a wildfire.”
- Avoid filing insurance claims for minor repairs you can afford to pay yourself. “Your rate usually goes up after home insurance claims, and your insurance company may drop you if you file too many claims within a two-to-three-year period,” he says.
- Shop around for coverage. “Insurance companies often adjust their rates, and your own rate qualifications can also change, especially if you’ve avoided claims for a few years or your credit has improved,” he says. “Shopping around can often help you find a cheaper rate.”
Methodology
LendingTree analyzed data from the U.S. Forest Service’s Wildfire Risk to Communities, the U.S. Census Bureau’s 2024 American Community Survey (ACS) via IPUMS, the Federal Housing Finance Agency (FHFA) House Price Index, Freddie Mac’s Primary Mortgage Market Survey (PMMS) and Quadrant Information Services to rank states by wildfire-related insurance vulnerability.
Wildfire counts and acres burned come from LendingTree’s analysis of National Interagency Fire Center (NIFC) data via the Insurance Information Institute (III). The share of U.S. wildfires was calculated by dividing each state’s 2024 wildfire count by the U.S. total. The percentage change in wildfires was based on 2019 and 2024 wildfire counts, and states were included only if they had at least 100 wildfires in both years.
LendingTree’s wildfire insurance vulnerability score combines wildfire risk to homes, home insurance’s share of monthly housing costs and the share of owner-occupied households spending at least 30% of their income on housing costs. Wildfire risk to homes is weighted at 50%, while home insurance’s share of housing costs and the share of cost-burdened homeowners are each weighted at 25%.
Wildfire risk to homes is based on the U.S. Forest Service’s Risk to Potential Structures metric, also known as Risk to Homes. This percentile ranks states based on modeled wildfire risk to housing areas, accounting for wildfire likelihood, fire intensity and potential structural damage.
To estimate home insurance’s share of monthly housing costs, LendingTree used each state’s 2024 ACS median home value and estimated 2026 median home values using the percentage change implied by the state’s FHFA House Price Index between the average 2024 index level and the first-quarter 2026 index level. Annual property taxes were converted to effective 2024 property tax rates, then applied to estimated 2026 home values to project annual and monthly property tax costs.
Mortgage payments were estimated assuming a 20% down payment, an 80% loan-to-value ratio, a 30-year fixed-rate mortgage and a year-to-date average 2026 30-year fixed mortgage rate of 6.21%, based on Freddie Mac PMMS releases through May 21, 2026. Loan amounts were calculated as 80% of each estimated 2026 home value, and monthly principal-and-interest payments were modeled using the standard fixed-rate mortgage amortization formula.
To better align insurance assumptions with home values, each state’s dwelling coverage was approximated to the nearest available benchmark of $200,000, $350,000 or $500,000 based on the state’s home value. Unless otherwise noted, insurance assumptions included $100,000 in personal liability coverage, $1,000 in medical payments coverage and a $1,000 deductible. Total monthly housing costs were calculated as the estimated monthly mortgage payment, monthly property tax and monthly home insurance premium, and each component’s share was calculated as a percentage of that total.
Direct exposure was measured separately and reflects the share of buildings within direct exposure zones. Estimated buildings directly exposed to wildfire were calculated by multiplying the total number of buildings by the share of buildings directly exposed.
Housing units near wildfire-prone land refer to housing units in the wildland-urban interface, where homes meet or intermingle with undeveloped vegetation. The change was calculated using SILVIS Lab wildland-urban interface data from 1990 and 2020.
Additionally, LendingTree commissioned QuestionPro to conduct an online survey of 2,000 U.S. consumers ages 18 to 80 from July 2 to 8, 2026. The survey was administered using a nonprobability-based sample, and quotas were used to help ensure the sample reflected the overall population. Researchers reviewed all responses for quality control.
We defined generations as the following ages in 2026:
- Generation Z: 18 to 29
- Millennials: 30 to 45
- Generation X: 46 to 61
- Baby boomers: 62 to 80