Homeownership’s Racial Divide: Black Households Lag in Every Major Metro
Racial inequality is a major issue in the U.S., with systemic racism and historical discrimination causing various challenges in daily life — including in homebuying. This is especially true for Black Americans, who are among the most economically disadvantaged groups.
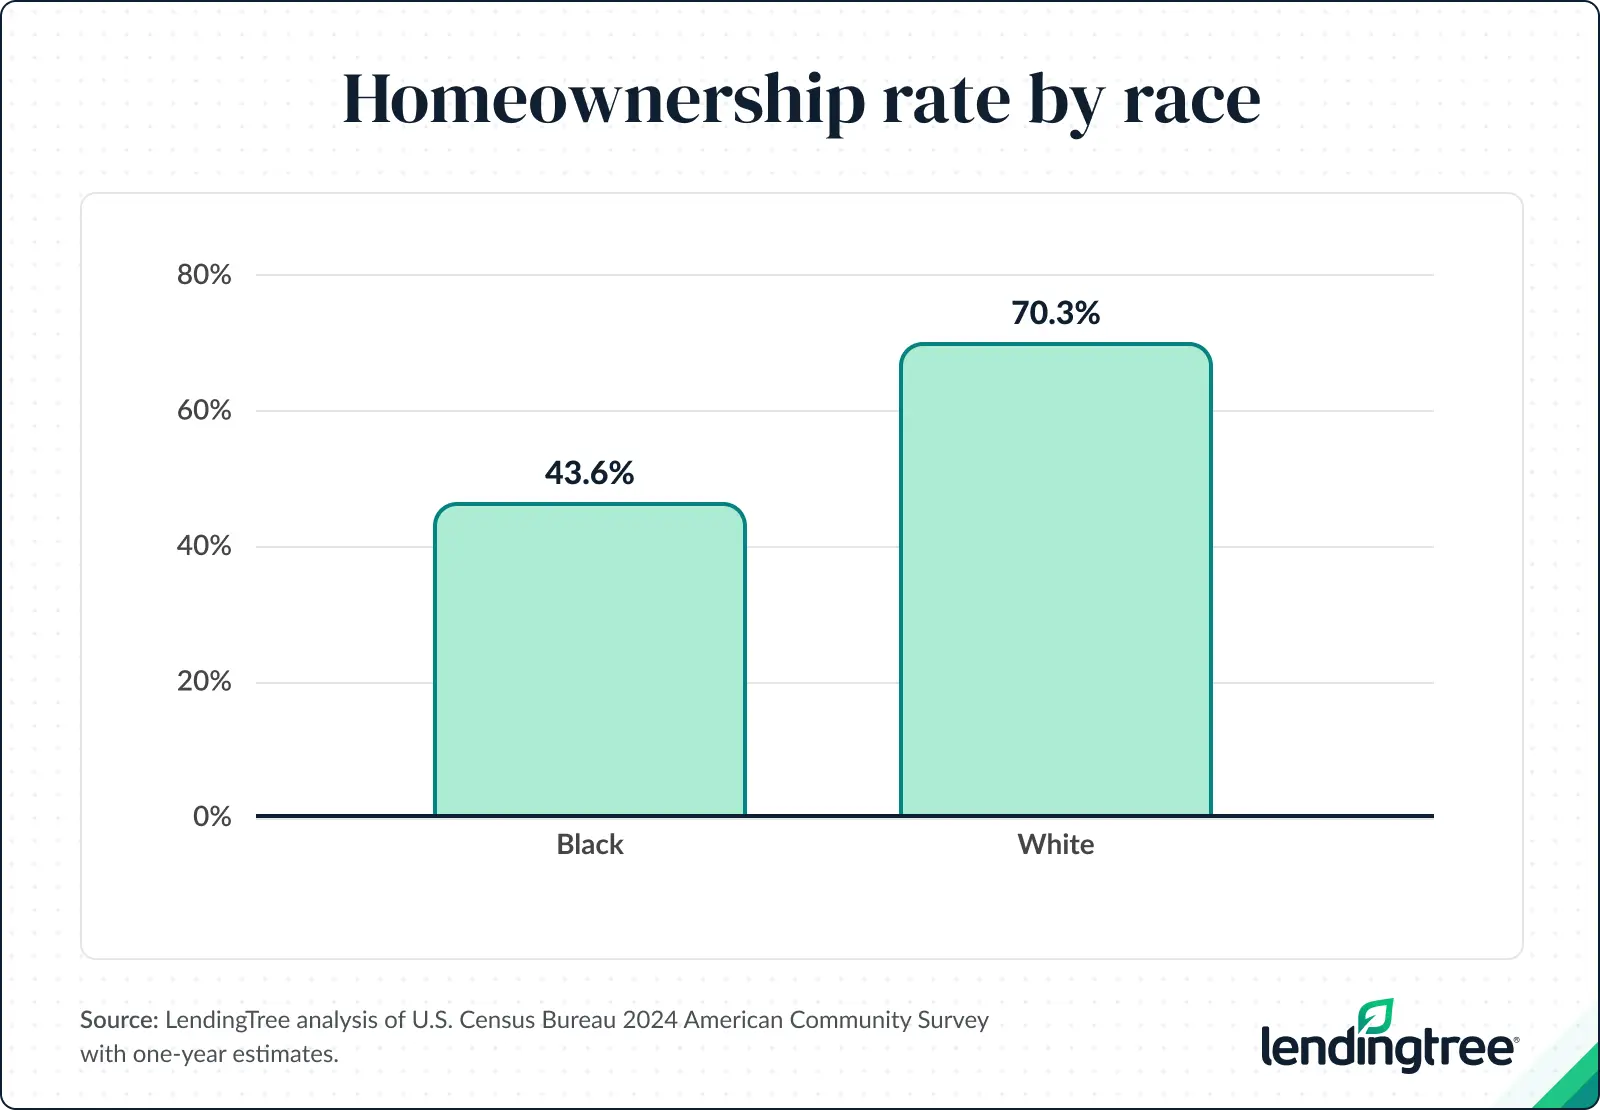
In this LendingTree study, we found that the Black homeownership rate across the 50 largest metros was 43.6%, compared with 70.3% among white householders.
Here’s a closer look at where Black homeownership rates are highest, as well as some tips on applying for a mortgage as someone in a disadvantaged group.
Key findings
- Black households remain underrepresented in homeownership across the largest U.S. metros. In 2024, the Black homeownership rate across the 50 largest metros was 43.6%, or 4.6 million households, compared with 70.3% among white householders.
- Atlanta tops the list for Black homeownership among the 50 largest metros, with a rate of 55.3%. Birmingham, Ala. (54.1%), and Richmond, Va. (52.8%), follow close behind. Only five metros have Black homeownership rates above 50.0%, with Washington, D.C., and Miami rounding out the group.
- San Jose, Calif. (29.2%), Minneapolis (30.1%) and Fresno, Calif. (30.5%), rank lowest for Black homeownership among the 50 largest metros. Several other major metros — including Los Angeles, New York and Seattle — also fall within the bottom 10.
- Not only is homeownership underrepresented, but Black homeowners’ median home values are lower. The median home value for owner-occupied homes owned by Black Americans nationwide was $278,500 in 2024 — 22.8% lower than the overall median home value of $360,600.
Homeownership rate among Black households is 43.6%
Across the largest 50 metros, Black households own a disproportionately low percentage of homes. In 2024, the Black homeownership rate in these areas was 43.6%, compared with 70.3% among white householders.
That means Black households own a collective 4.6 million homes across the 50 largest metros.
Matt Schulz, LendingTree chief consumer finance analyst and author of “Ask Questions, Save Money, Make More: How to Take Control of Your Financial Life,” says that income and credit scores play a huge role when it comes to making a home purchase.
“Without sufficient income and decent credit, getting a home can be a major challenge, and Black Americans still trail well behind white Americans and other groups in those areas,” he says. “Until that changes, that gap will likely remain.”
As far as income goes, the median income among Black households was $56,020 in 2024, compared with $88,010 among white households — a $31,990 difference.
Atlanta has highest Black homeownership rate
By metro, Atlanta tops the list for Black homeownership, with a rate of 55.3%. That’s followed by Birmingham, Ala. (54.1%), and Richmond, Va. (52.8%).
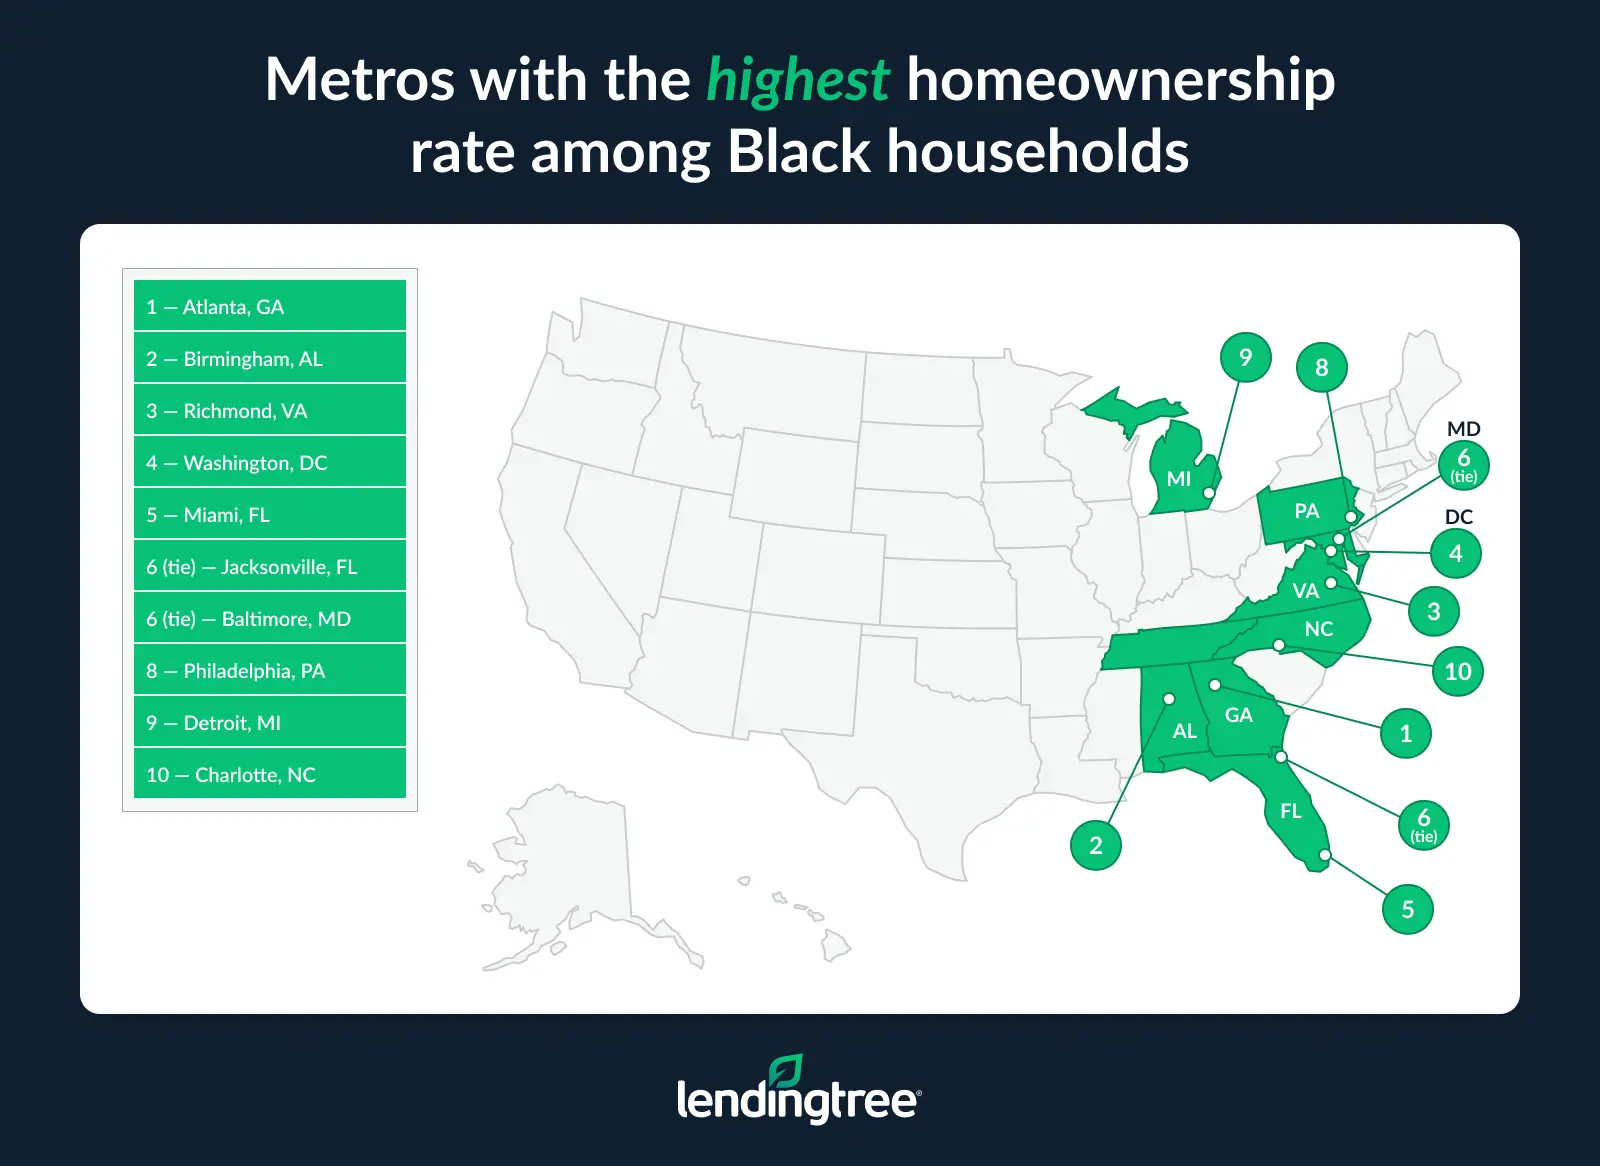
Washington, D.C. (52.5%), and Miami (52.0%) are the only other metros with Black homeownership rates above 50.0%.
Expensive metros have the lowest Black homeownership rates
When it comes to the metros with the lowest Black homeownership rates, the more expensive metros top the list. San Jose, Calif., ranks last, with a rate of just 29.2%. Minneapolis (30.1%) and Fresno, Calif. (30.5%), follow.
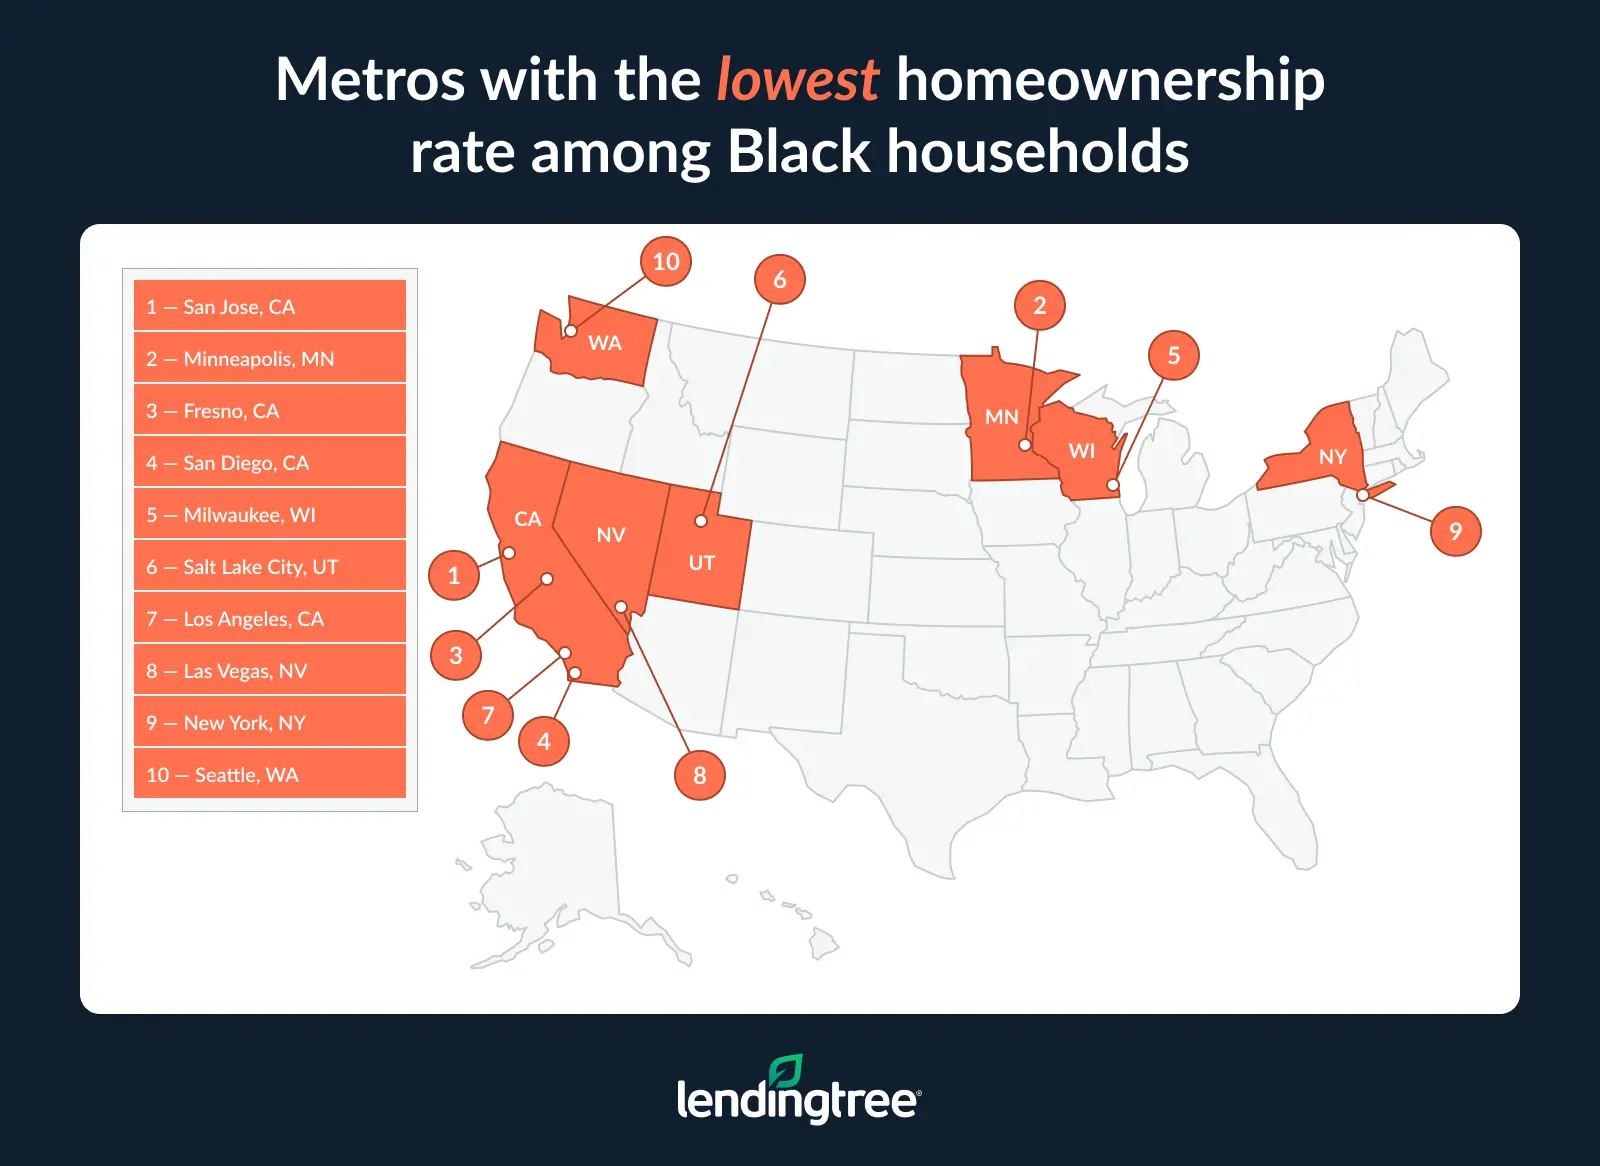
Other major metros also fall within the bottom 10: Los Angeles ranks seventh at 32.4%, New York ranks ninth at 33.4% and Seattle ranks 10th at 33.8%.
Affordability is a huge part of this gap, Schulz believes.
“Buying a home today is challenging anywhere,” he says. “However, it becomes just that much harder when you’re in one of the nation’s most expensive cities. Add lower income to the mix, and it becomes nearly impossible in some places.”
Full rankings: Metros with highest Black homeownership rates
| Rank | Metro | # of housing units occupied by Black people | # of owner-occupied housing units owned by Black homeowners | Black homeownership rate (%) |
|---|---|---|---|---|
| 1 | Atlanta, GA | 811,712 | 449,015 | 55.3% |
| 2 | Birmingham, AL | 139,413 | 75,469 | 54.1% |
| 3 | Richmond, VA | 158,363 | 83,673 | 52.8% |
| 4 | Washington, DC | 625,383 | 328,391 | 52.5% |
| 5 | Miami, FL | 401,738 | 208,884 | 52.0% |
| 6 | Jacksonville, FL | 143,266 | 69,953 | 48.8% |
| 6 | Baltimore, MD | 336,533 | 164,175 | 48.8% |
| 8 | Philadelphia, PA | 518,418 | 251,314 | 48.5% |
| 9 | Detroit, MI | 389,134 | 185,730 | 47.7% |
| 10 | Charlotte, NC | 256,319 | 121,911 | 47.6% |
| 11 | Orlando, FL | 163,118 | 76,976 | 47.2% |
| 12 | Riverside, CA | 114,938 | 54,112 | 47.1% |
| 13 | Raleigh, NC | 118,956 | 55,404 | 46.6% |
| 14 | Virginia Beach, VA | 216,240 | 100,451 | 46.5% |
| 15 | Tampa, FL | 150,970 | 69,715 | 46.2% |
| 16 | San Antonio, TX | 73,913 | 33,619 | 45.5% |
| 17 | St. Louis, MO | 202,528 | 91,434 | 45.1% |
| 18 | Cleveland, OH | 173,484 | 77,947 | 44.9% |
| 19 | Hartford, CT | 50,690 | 22,386 | 44.2% |
| 20 | Indianapolis, IN | 130,765 | 57,518 | 44.0% |
| 21 | Memphis, TN | 243,890 | 106,494 | 43.7% |
| 22 | Chicago, IL | 607,460 | 262,343 | 43.2% |
| 23 | Nashville, TN | 125,515 | 54,144 | 43.1% |
| 24 | Denver, CO | 72,647 | 30,626 | 42.2% |
| 25 | Providence, RI | 33,490 | 14,072 | 42.0% |
| 26 | Houston, TX | 534,730 | 222,079 | 41.5% |
| 27 | Louisville, KY | 70,791 | 29,324 | 41.4% |
| 28 | Sacramento, CA | 60,834 | 24,949 | 41.0% |
| 29 | Cincinnati, OH | 107,183 | 43,870 | 40.9% |
| 30 | Pittsburgh, PA | 76,926 | 31,342 | 40.7% |
| 31 | Phoenix, AZ | 104,481 | 42,420 | 40.6% |
| 32 | Kansas City, MO | 108,372 | 42,864 | 39.6% |
| 33 | Oklahoma City, OK | 58,041 | 22,623 | 39.0% |
| 34 | Dallas, TX | 535,238 | 206,171 | 38.5% |
| 35 | Austin, TX | 82,707 | 31,298 | 37.8% |
| 36 | Grand Rapids, MI | 25,015 | 9,321 | 37.3% |
| 37 | Boston, MA | 131,029 | 48,419 | 37.0% |
| 38 | Portland, OR | 30,702 | 11,164 | 36.4% |
| 39 | San Francisco, CA | 127,945 | 46,091 | 36.0% |
| 40 | Columbus, OH | 130,678 | 46,569 | 35.6% |
| 41 | Seattle, WA | 99,619 | 33,671 | 33.8% |
| 42 | New York, NY | 1,168,682 | 390,670 | 33.4% |
| 43 | Las Vegas, NV | 107,990 | 35,401 | 32.8% |
| 44 | Los Angeles, CA | 336,410 | 109,024 | 32.4% |
| 45 | Salt Lake City, UT | 8,283 | 2,632 | 31.8% |
| 46 | Milwaukee, WI | 101,994 | 32,171 | 31.5% |
| 47 | San Diego, CA | 55,694 | 17,152 | 30.8% |
| 48 | Fresno, CA | 15,612 | 4,769 | 30.5% |
| 49 | Minneapolis, MN | 128,077 | 38,555 | 30.1% |
| 50 | San Jose, CA | 17,719 | 5,178 | 29.2% |
Home values lower among Black households
Homeownership isn’t just underrepresented among Black households — Black homeowners’ median home values are also lower.
The median home value for owner-occupied homes owned by Black Americans nationwide was $278,500 in 2024 — 22.8% lower than the overall median home value of $360,600.
There are likely plenty of reasons for that, but Schulz believes one of them is that Black applicants may only be able to qualify for smaller mortgages than other Americans. “That combination of lower income and lower credit scores almost certainly lowers the ceiling on the size of mortgages that they are able to get,” he says.
Getting a mortgage as a disadvantaged group: Top expert tips
If homebuying wasn’t difficult enough, being part of a disadvantaged group makes it even harder to obtain a mortgage. We offer the following advice:
- Focus on improving your credit. “It’s so important,” Schulz says. “There is little in life that’s more expensive than crummy credit, and there’s no better example of that than with a mortgage. Lower credit scores mean higher mortgage rates. Higher mortgage rates mean bigger monthly payments and much more interest paid over the life of a loan.” Credit increases don’t have to be major to make a difference, either. “Even an interest rate that is only a tiny fraction of a percent smaller can save you thousands of dollars over the life of your loan,” he says.
- Shop around. “Offers can vary significantly from lender to lender, so taking the time to comparison shop can absolutely be worth the effort,” Schulz says. “Different lenders may have different rates, different fees and even different standards for who qualifies for a loan.”
- Take advantage of resources. “Google ‘resources for first-time homebuyers near me’ to find organizations and businesses that work with new homebuyers,” he says. “Whether you’re searching for education, down payment assistance, low-interest nonconventional mortgages or anything else involved in the homebuying process, these places can help. Let them.”
Methodology
LendingTree researchers analyzed the U.S. Census Bureau 2024 American Community Survey (ACS) with one-year estimates, the latest available. For each of the 50 largest metropolitan statistical areas (MSAs), we calculated the Black or African American homeownership rate.
We then ranked the metros from highest to lowest based on their Black household homeownership rate, with higher percentages indicating greater levels of homeownership among Black households.
View mortgage loan offers from up to 5 lenders in minutes