Despite Rising Home Prices, Homeownership Rates Have Increased Since 2012
While U.S. home prices have come down from recent highs, they remain relatively steep. Despite this, homeownership rates have gone up in recent years.
More specifically, according to a LendingTree analysis of the latest U.S. Census Bureau American Community Survey data, the share of owner-occupied homes in the nation’s 50 largest metropolitan areas increased by 93 basis points from 2019 to 2022 and 108 basis points from 2012 to 2022.
In other words, our findings indicate that even though home values in some areas have more than doubled since 2012, more people have become homeowners.
Key findings
- As of 2022, almost 43.5 million of the 70.4 million occupied housing units in the nation’s 50 largest metros were owner-occupied. The overall homeownership rate across these metros is 61.72%.
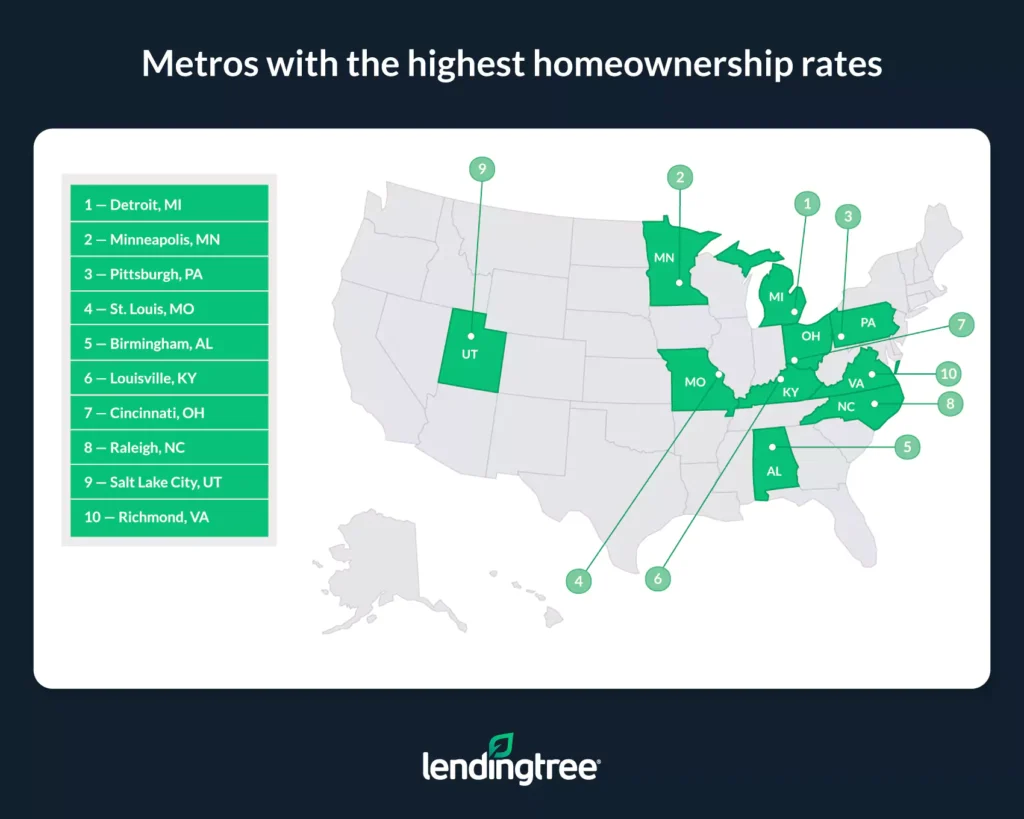
- Homeownership rates are highest in the Detroit, Minneapolis and Pittsburgh metros. The homeownership rates in these metros are 71.49%, 70.54% and 70.45%, respectively.
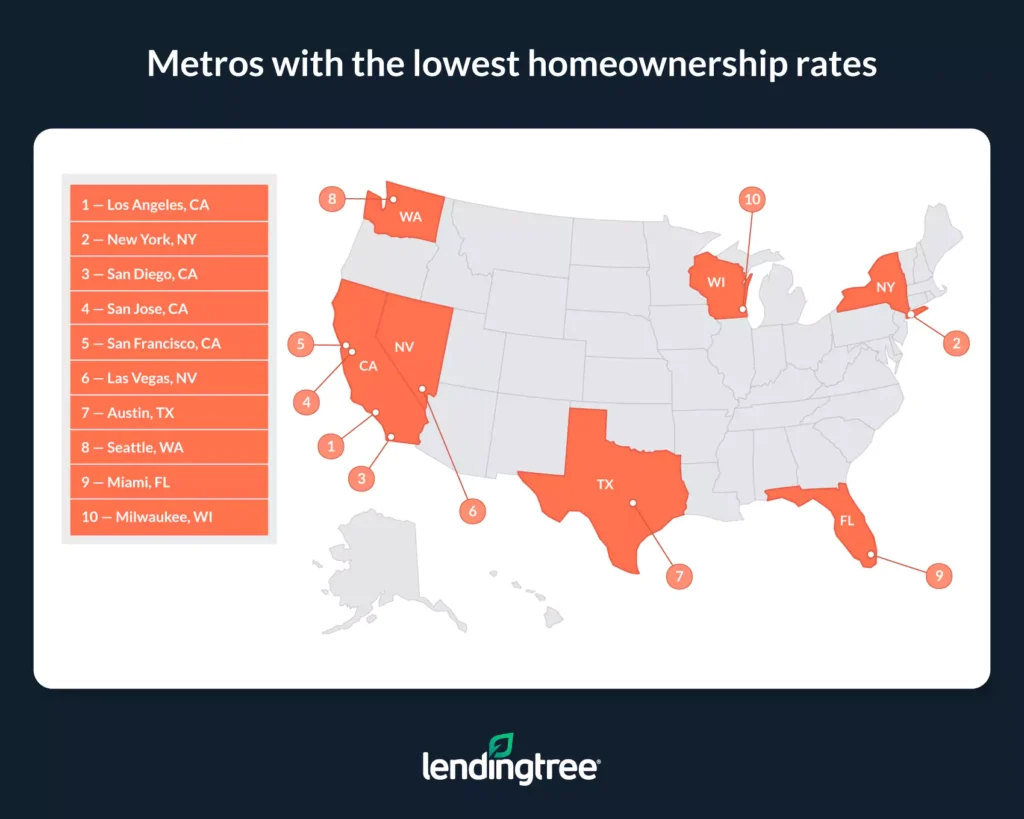
- Homeownership rates are lowest in the Los Angeles, New York, and San Diego metros. At 47.94%, Los Angeles is the only metro among the 50 largest where the homeownership rate is lower than 50.00%. In New York and San Diego, homeownership rates are higher — albeit still relatively low — at 51.72% and 54.53%.
- From 2019 to 2022, the homeownership rate across the nation’s 50 largest metros increased by 93 basis points from 60.79% to 61.72%. This represents an increase of 3,175,130 owner-occupied housing units. From 2012 to 2022, the homeownership rate rose by 108 basis points from 60.64% to 61.72%. That’s an increase of 6,155,379 owner-occupied housing units.
- Homeownership rates increased the most in Las Vegas, Virginia Beach, Va., and New Orleans from 2019 to 2022. Across these three metros, homeownership rates increased by an average of 305 basis points. Conversely, homeownership rates decreased by an average of 57 basis points in Nashville, Tenn., Salt Lake City, and San Jose, Calif.
- From 2012 to 2022, homeownership rates increased the most in Las Vegas, New Orleans, and Phoenix. On average, homeownership rates in these metros increased by 524 basis points from 2012 to 2022. Over that same period, homeownership rates increased in 37 of the nation’s other 50 largest metros, remained the same in one, and declined in nine. Homeownership rates decreased the most in Miami, San Jose, Calif., and Memphis, Tenn., falling by an average of 167 basis points.
- Homeownership rates have increased despite rising home prices. From 2012 to 2022, median home values across the nation’s 50 largest metros increased from 25.39% to 197.73%. The average increase across these metros was 97.38%. Despite this, homeownership rates still rose (barring a handful of exceptions).
Metros with the highest homeownership rates
No. 1: Detroit
- Total number of occupied housing units: 1,762,104
- Share of housing units that were owner-occupied in 2022: 71.49%
- Share of housing units that were renter-occupied in 2022: 28.51%
- Increase in share of owner-occupied housing units from 2019 to 2022: 1.87 percentage points
- Increase in share of owner-occupied housing units from 2012 to 2022: 2.44 percentage points
- Median home value: $245,500
- Percentage growth in median home value from 2019 to 2022: 28.00%
- Percentage growth in median home value from 2012 to 2022: 111.27%
No. 2: Minneapolis
- Total number of occupied housing units: 1,483,453
- Share of housing units that were owner-occupied in 2022: 70.54%
- Share of housing units that were renter-occupied in 2022: 29.46%
- Increase in share of owner-occupied housing units from 2019 to 2022: 0.38 percentage points
- Increase in share of owner-occupied housing units from 2012 to 2022: 1.11 percentage points
- Median home value: $359,800
- Percentage growth in median home value from 2019 to 2022: 26.47%
- Percentage growth in median home value from 2012 to 2022: 76.63%
No. 3: Pittsburgh
- Total number of occupied housing units: 1,021,314
- Share of housing units that were owner-occupied in 2022: 70.45%
- Share of housing units that were renter-occupied in 2022: 29.55%
- Increase in share of owner-occupied housing units from 2019 to 2022: 2.26 percentage points
- Increase in share of owner-occupied housing units from 2012 to 2022: 1.00 percentage points
- Median home value: $209,800
- Percentage growth in median home value from 2019 to 2022: 26.46%
- Percentage growth in median home value from 2012 to 2022: 68.79%
Metros with the lowest homeownership rates
No. 1: Los Angeles
- Total number of occupied housing units: 4,500,951
- Share of housing units that were owner-occupied in 2022: 47.94%
- Share of housing units that were renter-occupied in 2022: 52.06%
- Decrease in share of owner-occupied housing units from 2019 to 2022: -0.27 percentage points
- Decrease in share of owner-occupied housing units from 2012 to 2022: -0.49 percentage points
- Median home value: $847,400
- Percentage growth in median home value from 2019 to 2022: 27.07%
- Percentage growth in median home value from 2012 to 2022: 97.76%
No. 2: New York
- Total number of occupied housing units: 7,478,571
- Share of housing units that were owner-occupied in 2022: 51.72%
- Share of housing units that were renter-occupied in 2022: 48.28%
- Increase in share of owner-occupied housing units from 2019 to 2022: 0.87 percentage points
- Increase in share of owner-occupied housing units from 2012 to 2022: 0.36 percentage points
- Median home value: $578,800
- Percentage growth in median home value from 2019 to 2022: 19.86%
- Percentage growth in median home value from 2012 to 2022: 44.70%
No. 3: San Diego
- Total number of occupied housing units: 1,172,343
- Share of housing units that were owner-occupied in 2022: 54.53%
- Share of housing units that were renter-occupied in 2022: 45.47%
- Increase in share of owner-occupied housing units from 2019 to 2022: 0.70 percentage points
- Increase in share of owner-occupied housing units from 2012 to 2022: 1.41 percentage points
- Median home value: $846,600
- Percentage growth in median home value from 2019 to 2022: 36.70%
- Percentage growth in median home value from 2012 to 2022: 119.10%
Even in the face of affordability challenges, homeowners are here to stay
As our study shows, homeownership rates have increased in the majority of the nation’s largest metros relative to 2019 and 2012. This is despite the fact that home values in these metros are rising considerably.
While these higher homeownership rates indicate opportunities for people to purchase property even when home values are rising, it doesn’t mean homebuying is without challenges, or that it’s going to be an achievable goal for everyone. On the contrary, a combination of steep home prices and persistently high mortgage rates have made buying difficult for many in recent years. This is evidenced by the fact that, since the start of 2023, mortgage demand has stayed at or near its lowest levels in decades.
That said, there are nonetheless millions of homeowners in the U.S., and people are still purchasing new homes. Even groups who typically have less money at their disposal, like millennials and first-time homebuyers, are receiving mortgage offers.
While today’s housing market isn’t necessarily easy to navigate, that doesn’t mean homeownership is a vanishing concept or that the U.S. is poised to become a nation of primarily renters anytime soon.
Tips for homebuyers
If you’re an aspiring homeowner, the following tips can help you keep up with costs and make your dream of homeownership a more achievable reality.
- Shop around for a mortgage. Different lenders can offer different rates to the same borrowers. By shopping around and comparing offers from different lenders before getting a mortgage, you can potentially get a lower rate and save money on your monthly payments and over the lifetime of your loan.
- Give yourself plenty of time to save. Down payments can easily cost tens of thousands of dollars, and other costs associated with buying a new home, like paying for movers, can be anything but cheap. The more time you give yourself to save before buying a home, the more easily you’ll be able to tackle common homebuying expenses without resorting to borrowing even more money on top of your mortgage.
- Consider different loan options. While a conventional 30-year, fixed-rate mortgage is what first comes to mind for many thinking about getting a loan to buy a home, it’s not the only option. For example, loans backed by the Department of Veterans Affairs (VA) and the Federal Housing Administration (FHA) are often easier to qualify for than conventional mortgages and can come with lower rates and less strict down payment requirements. Just because the terms of a conventional mortgage might not be ideal for everyone doesn’t mean that options with more favorable terms don’t exist.
Methodology
LendingTree analyzed housing data from the U.S. Census Bureau 2022 (the latest available), 2019 and 2012 American Community Surveys with one-year estimates.
Data is derived at the metropolitan statistical area (MSA) level.
View mortgage loan offers from up to 5 lenders in minutes