Auto Loan Inquiries Rise Disproportionately in U.S. Cities With Highest Transit Ridership


In the six U.S. cities with the highest transit use, interest in auto loans amid the COVID-19 pandemic has grown at a faster rate than in the rest of the country, LendingTree researchers have found.
With average loan amounts of $35,637 for new vehicles and $20,969 for used vehicles (per Experian), a purchase isn’t a small commitment. From New York to San Francisco to Chicago, each city tells a different story during the COVID-19 crisis.
- From January 2020 through June 2020, cities with the highest public transportation ridership showed a much higher growth in interest in auto loans than the rest of the U.S., according to a LendingTree-compiled index.
- The biggest difference between the six-city and national indexes came in June, when inquiries in the six cities were 22 index points higher than the national index. The smallest difference, 7 index points, was in February.
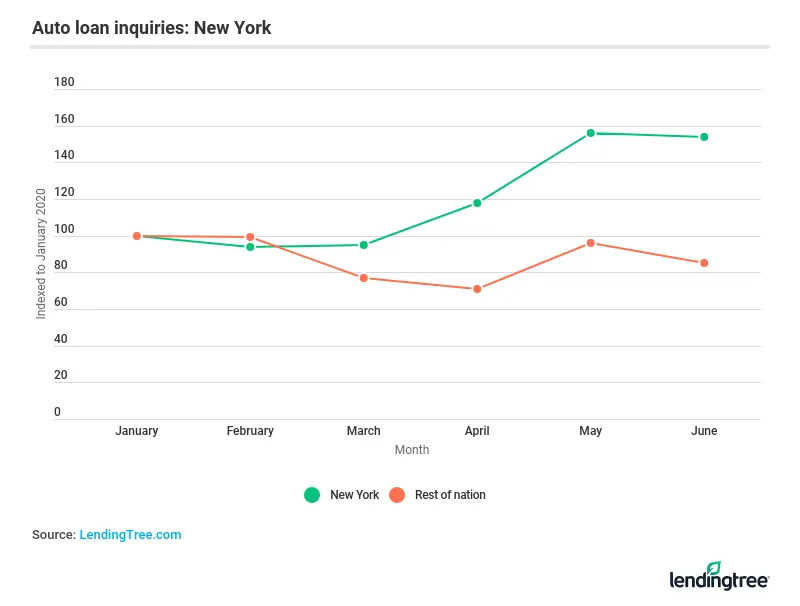
- New York saw the sharpest increase in auto loan inquiries in the first half of 2020 among the six cities. Car inquiries in the Big Apple were 56% higher in May than in January and 54% higher in June.
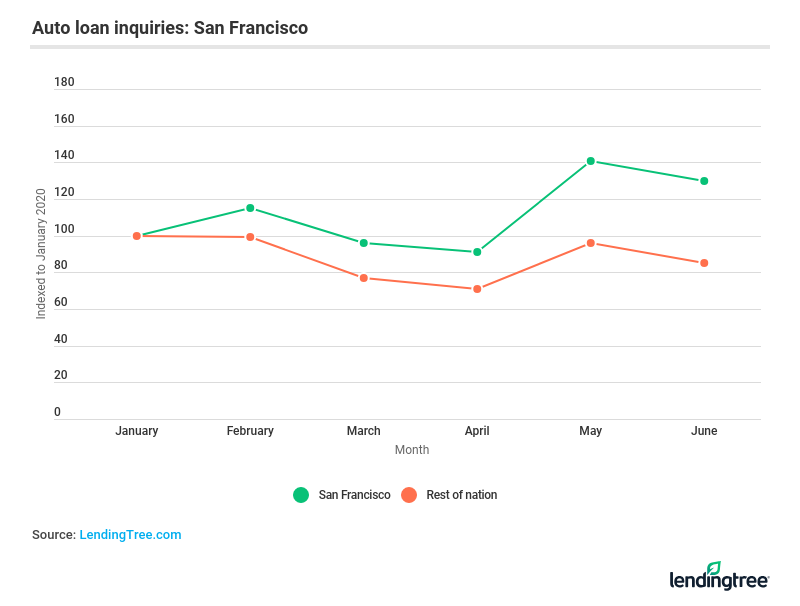
- San Francisco peaked in May, when auto inquiries were 41% higher than in January.
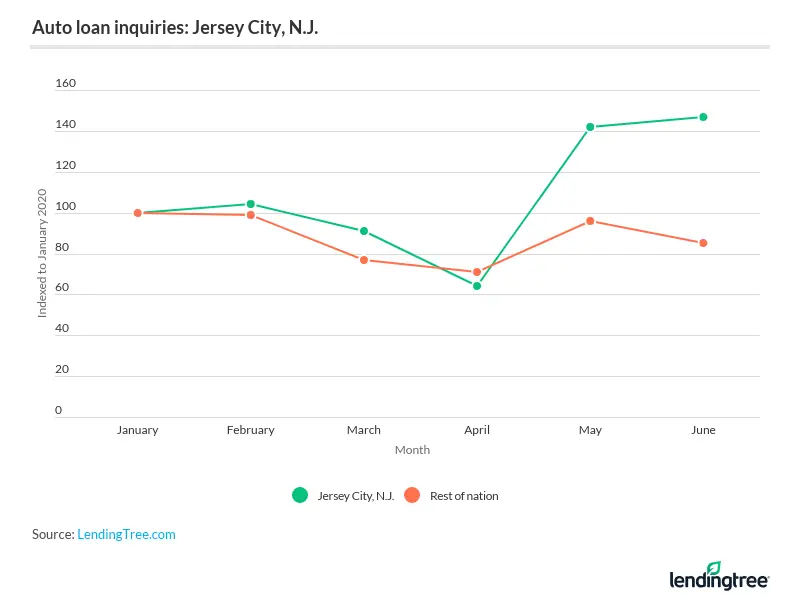
- Jersey City, N.J., was the only city with more inquiries in June than in May — 47% and 42% higher than January, respectively.
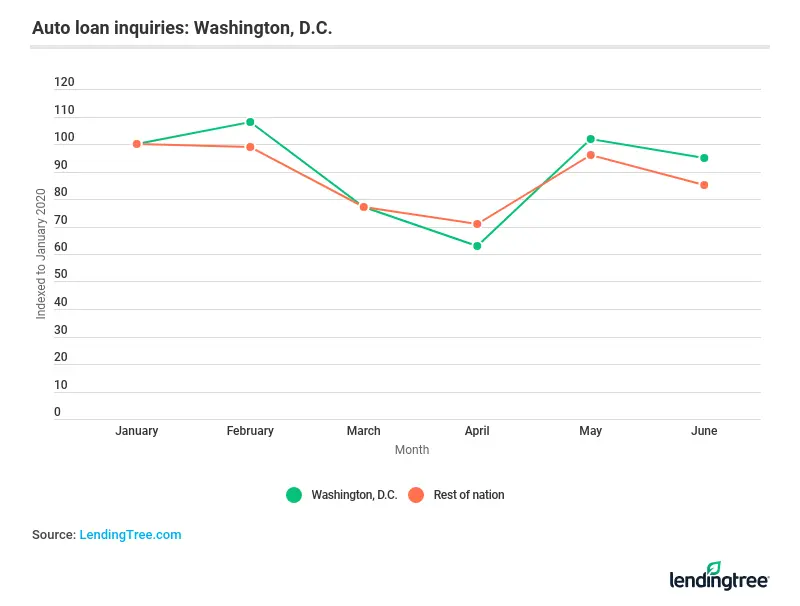
- Washington, D.C., and Chicago were the exceptions, as potential borrowers submitted more loan inquiries in February than in later months.
Closer look at cities with highest public transportation ridership
No. 1: New York
- 56.2% of commuters used public transportation in 2018 (the latest Census data available)
- 54.6% of occupied housing units had no vehicles available in 2018 (the latest Census data available)
- 31.7% of units had one vehicle available
New Yorkers were more likely to inquire about auto loans in May, by a difference of 69 index points, than the rest of the U.S. The city began to diverge from national inquiry trends earlier, in March. The Big Apple has the highest citywide commute cost in the U.S.
No. 2: Jersey City, N.J.
- 48.5% of commuters used public transportation in 2018
- 38.4% of occupied housing units had no vehicles available in 2018
- 43.9% of units had one vehicle available
Jersey City followed a different trajectory than New York, with car inquiries plunging in April. (New Jersey’s governor issued a stay-at-home order on March 21.) Inquiries fell below the national index by seven points in April but reversed course in May. Auto loan inquiries in Jersey City jumped month over month by 122.9% in May, the biggest percentage change among the cities highlighted.
No. 3: Washington, D.C.
- 34.8% of commuters used public transportation in 2018
- 35.4% of occupied housing units had no vehicles available in 2018
- 44.6% of units had one vehicle available
Look at the chart below to see a ton of similarities between auto loan inquiries in Washington, D.C., and throughout the rest of the U.S. In March, for example, both the city and U.S. indexes fell 23 points below January levels. The city also saw a noticeable month-over-month rise in May by 61.1%.
No. 4: San Francisco
- 33.5% of commuters used public transportation in 2018
- 30.6% of occupied housing units had no vehicles available in 2018
- 40.9% of units had one vehicle available
San Francisco’s index followed a similar up-and-down pattern as the national trend — until May and June, when there were index differences of 45 points. Interest in auto loans amid the beginning of the coronavirus — March and April — fell below January levels.
No. 5: Boston
- 33.4% of commuters used public transportation in 2018
- 34.1% of occupied housing units had no vehicles available in 2018
- 42.5% of units had one vehicle available
Boston had the fifth-highest percentage of commuters who used public transportation in 2018, according to the Census Bureau. LendingTree researchers included the city among the six with the highest public transportation ridership, but we didn’t feel the sample from our marketplace was robust enough to include a meaningful month-over-month comparison here.
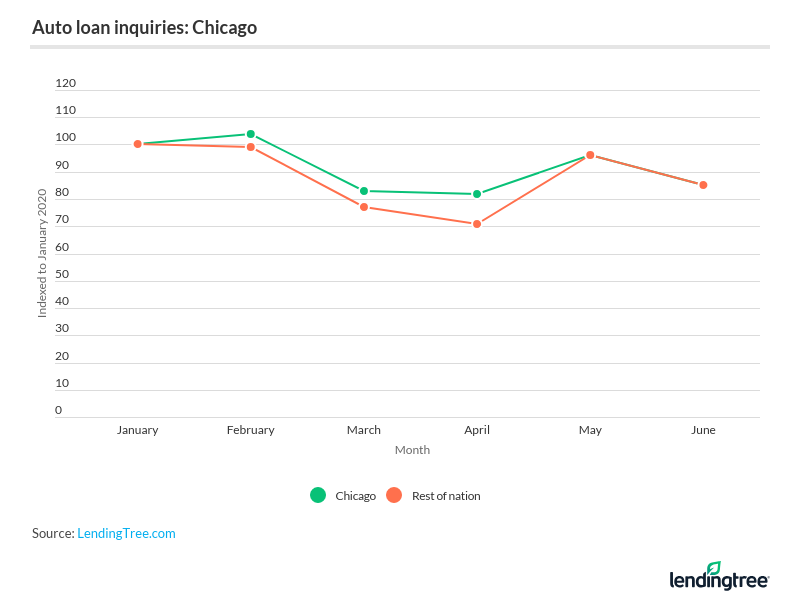
No. 6: Chicago
- 28.4% of commuters used public transportation in 2018
- 26.8% of occupied housing units had no vehicles available in 2018
- 44.1% of housing units had one vehicle available
Chicago didn’t show much of an elevated interest in auto loans compared to the U.S. as a whole, but it’s the city on our list with the highest number of households who already have a car. Inquiries were the same as national index levels in May and June, showing the most difference at 11 index points higher than national inquiries in April.
Why our national index differs from previous reports
In previous reports, we focused on changes in auto loan inquiries that came to our platform through organic means. In other words, borrowers who came to our site directly or through an online search.
For this analysis, we weren’t comfortable with the sample sizes of each city highlighted above from just organic search, so we opened it up to all prospective borrowers who came to our site. This shows a somewhat different pattern overall. While we prefer the other to give a stronger sense of American sentiment, we feel this is appropriate for comparing the locations of prospective borrowers.
Public transportation guidelines amid the pandemic
- Protect yourself: Wear a medical mask or multilayer cloth mask. Don’t touch your eyes, nose or mouth. Wash your hands immediately after each trip.
- Avoid touching surfaces when possible: When traveling via public transit, commuters can come in contact with all sorts of things: kiosks, touch screens, ticket machines, doors, benches, turnstiles, handrails and on and on. Opt for contactless fare payments when available on public transportation.
- Steer clear of food or drinks when commuting: Easier said than done, right? Sometimes your commute is the only chance you get to eat. But you’re more likely to touch your face while eating, which can do more harm amid a coronavirus pandemic.
- Keep personal belongings off the floor or seats: It’s best to keep your belongings — whether that’s a bag, briefcase or tablet — off the floor, seat or other surfaces. Consider wiping down your belongings with a cleaning method appropriate to the material after each trip and put your work clothes in the washer as soon as you get home.
- Avoid in-person and phone conversations: Studies have shown that the virus can be spread through droplets when talking. The droplets can remain in the air for up to 14 minutes, according to a study from the Proceedings of the National Academy of Sciences. Limiting time on the phone while in transit can be beneficial to fellow travelers.
- Travel during non-peak hours: Doing so should allow for better social distancing, giving you a better chance to stay six feet away from anyone not in your household. This could require changing your commute time or being willing to wait longer to avoid crowds.
Methodology
LendingTree analyzed proprietary auto loan inquiries, specifically looking at the six cities with the highest percentage of commuters who use public transportation. The six cities were: New York; Jersey City, N.J.; Washington, D.C.; San Francisco; Boston; and Chicago.
Get auto loan offers from up to 5 lenders in minutes