Ending EV Tax Credit Will Hit These States Hardest


The federal electric vehicle tax credit, designed to encourage EV purchases by making them more affordable, is set to expire Sept. 30, 2025. While it was initially due to expire in 2032, its brief run helped new-car buyers save $3.3 billion alone in tax year 2023.
Here’s a closer look at where consumers will miss out the most when the credit ends and where total claims were highest.
- Americans filed 487,990 returns claiming the new electric vehicle tax credit (totaling $3.3 billion) and 28,180 for the preowned EV credit ($95.6 million) in tax year 2023. The average credit was $6,709 for new EVs (maximum $7,500) and $3,392 for used EVs (maximum $4,000).
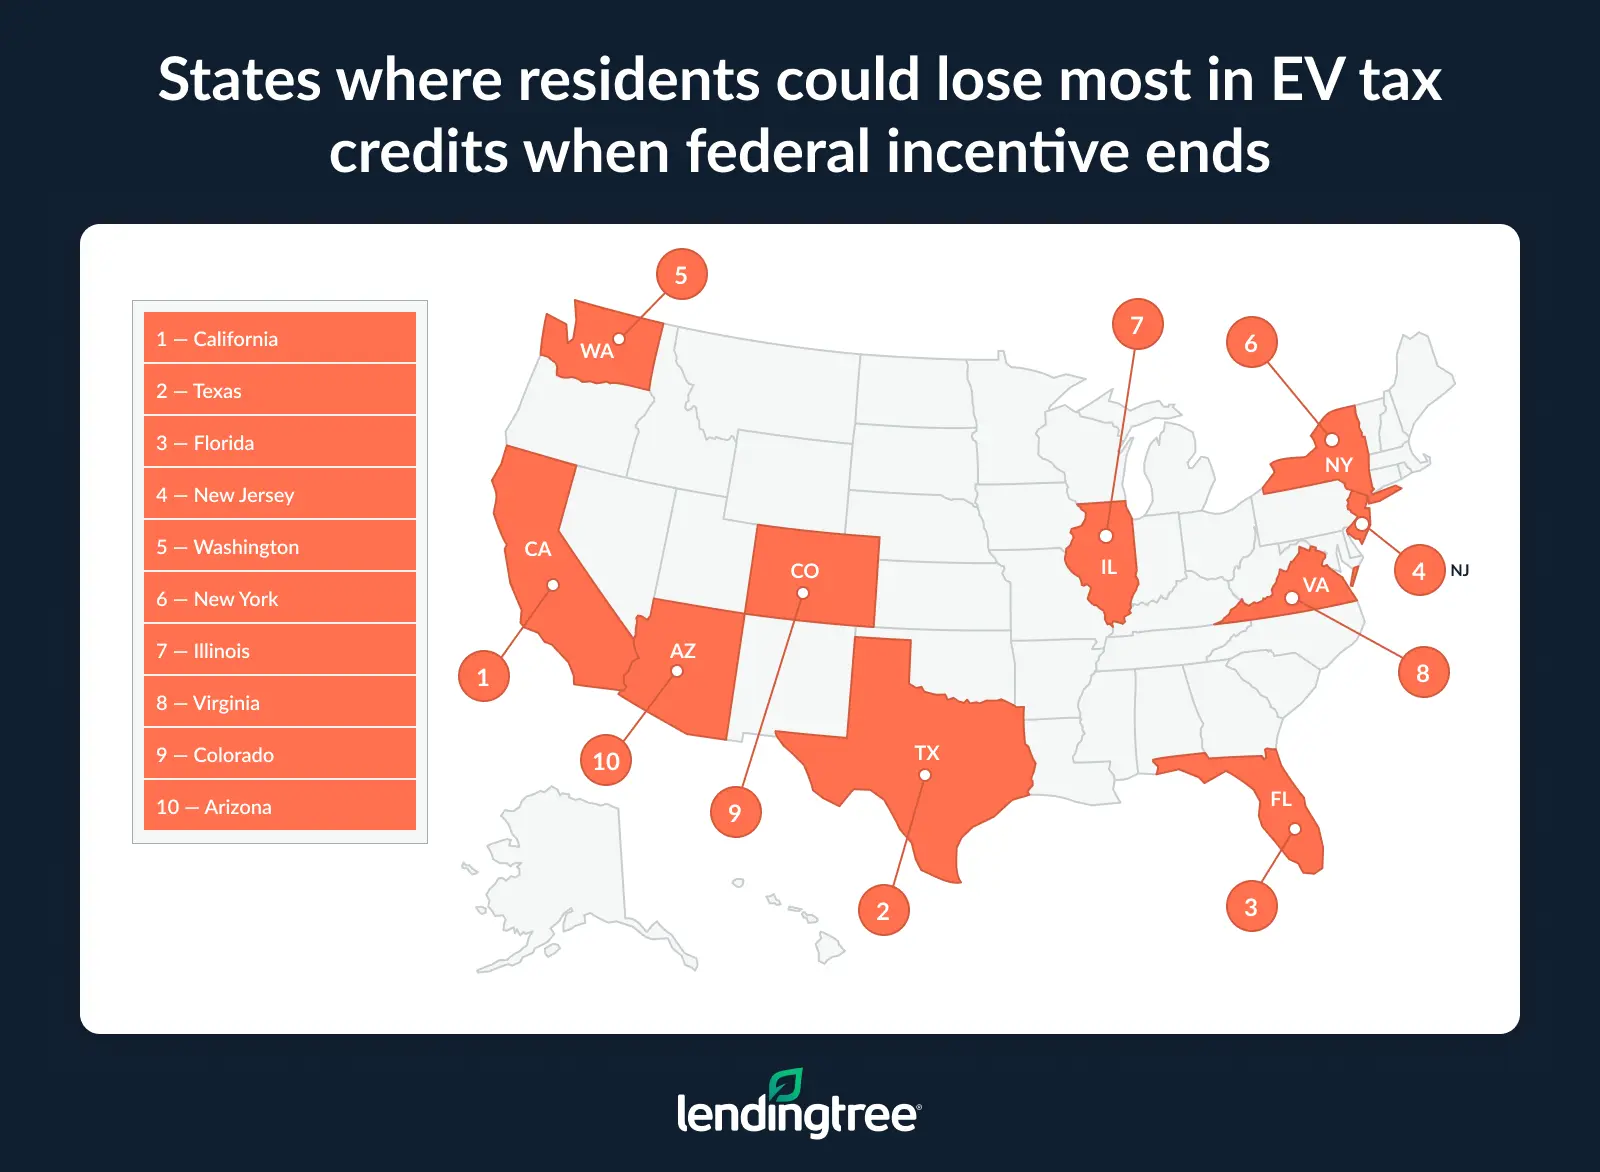
- Over a year, Californians could miss out on an estimated $1.1 billion in EV tax credits when the federal incentive ends. That includes credits for new and used electric vehicles. Texans could lose an estimated $272.7 million in potential savings, ahead of Floridians at $201.4 million.
- Looking beyond dollars, California would be hardest hit by the expiration of the new EV tax credit, as it leads in total claims and national share. Californians submitted 157,360 claims for the new EV tax credit in tax year 2023, or 32.2% of U.S. claims. Texas and Florida were next in claims at a far lower 38,870 and 30,090. For used EV credits, California also led, accounting for 23.2% of U.S. claims.
- Sticking with the Golden State, California accounts for 857 EV tax credit claims (new and used) per 100,000 returns — far above the U.S. average of 320. Washington (571) and New Jersey (506) also have high per-capita claim rates. Conversely, Mississippi (44), North Dakota (51) and Louisiana (57) have the fewest claims compared to the number of individual tax returns.
- Nationwide, only 1.7% of light-duty vehicles registered in 2023 were electric — an increase from 1.2% in 2022. California leads again, with EVs comprising 4.5% of registered vehicles. The District of Columbia (3.8%) and Hawaii (3.0%) follow. Meanwhile, just 0.2% of light-duty vehicles in Mississippi and North Dakota are electric.
- New EV sales totaled 310,839 in the second quarter of 2025, a 6.3% decrease from Q2 2024. The top three EVs sold in Q2 2025 were the Tesla Model Y (86,120), Tesla Model 3 (48,803) and Chevrolet Equinox EV (17,420). However, year-to-date Q1 and Q2 sales reached 607,089 — up 1.5% from the same period last year.
Americans claimed $3.3 billion in new EV tax credits
In tax year 2023 (filed in 2024 through Nov. 21), Americans filed 487,990 returns claiming the new electric vehicle tax credit, totaling $3.3 billion. For the preowned EV credit, Americans filed 28,180 returns, totaling $95.6 million.
On average, consumers received $6,709 of the $7,500 maximum for new EVs. These included new models purchased in 2023 or later, although electric vehicle owners could retroactively file for credits for models purchased in 2022 and earlier.
Among those buying used EVs and filing a claim, consumers received an average of $3,392 out of the $4,000 maximum.
Matt Schulz — LendingTree chief consumer finance analyst and author of “Ask Questions, Save Money, Make More: How to Take Control of Your Financial Life” — says those credits are big, especially when you consider how expensive vehicles are today.
“That these credits could often be taken at the point of sale makes them even more significant,” he says. “It’s one thing to have to wait until the following spring to get a rebate with your tax refund. It’s something else to be able to knock thousands of dollars off the price of a vehicle from the start. I have no doubt that those credits inspired people who may not otherwise have considered an electric vehicle to at least think about them.”
Californians could lose most from incentives ending
Over a year, Californians could miss out on an estimated $1.1 billion in EV tax credits (for both new and used vehicles) when the federal incentive ends. (Our estimate analyzes per-state totals from tax year 2023, which — as a reminder — covers returns filed in 2024 through Nov. 21.)
Following the Golden State, Texans could lose an estimated $272.7 million and Floridians could lose $201.4 million over a year.
“That’s an awful lot of potential buying power that will go away for consumers, so you could see a significant reduction in EV loan demand in certain parts of the country,” Schulz says. “That can be big, especially for auto lenders with a heavy EV focus.”
There’s still some good news, though. While the federal EV tax credit is phasing out, many states offer substantial incentives for electric vehicles, including the top-ranking California and Texas.
California has most EV credit claims
Looking at total new-vehicle claims, California again leads. Californians submitted 157,360 claims for the new EV tax credit in tax year 2023. That’s a significant 32.2% of U.S. claims.
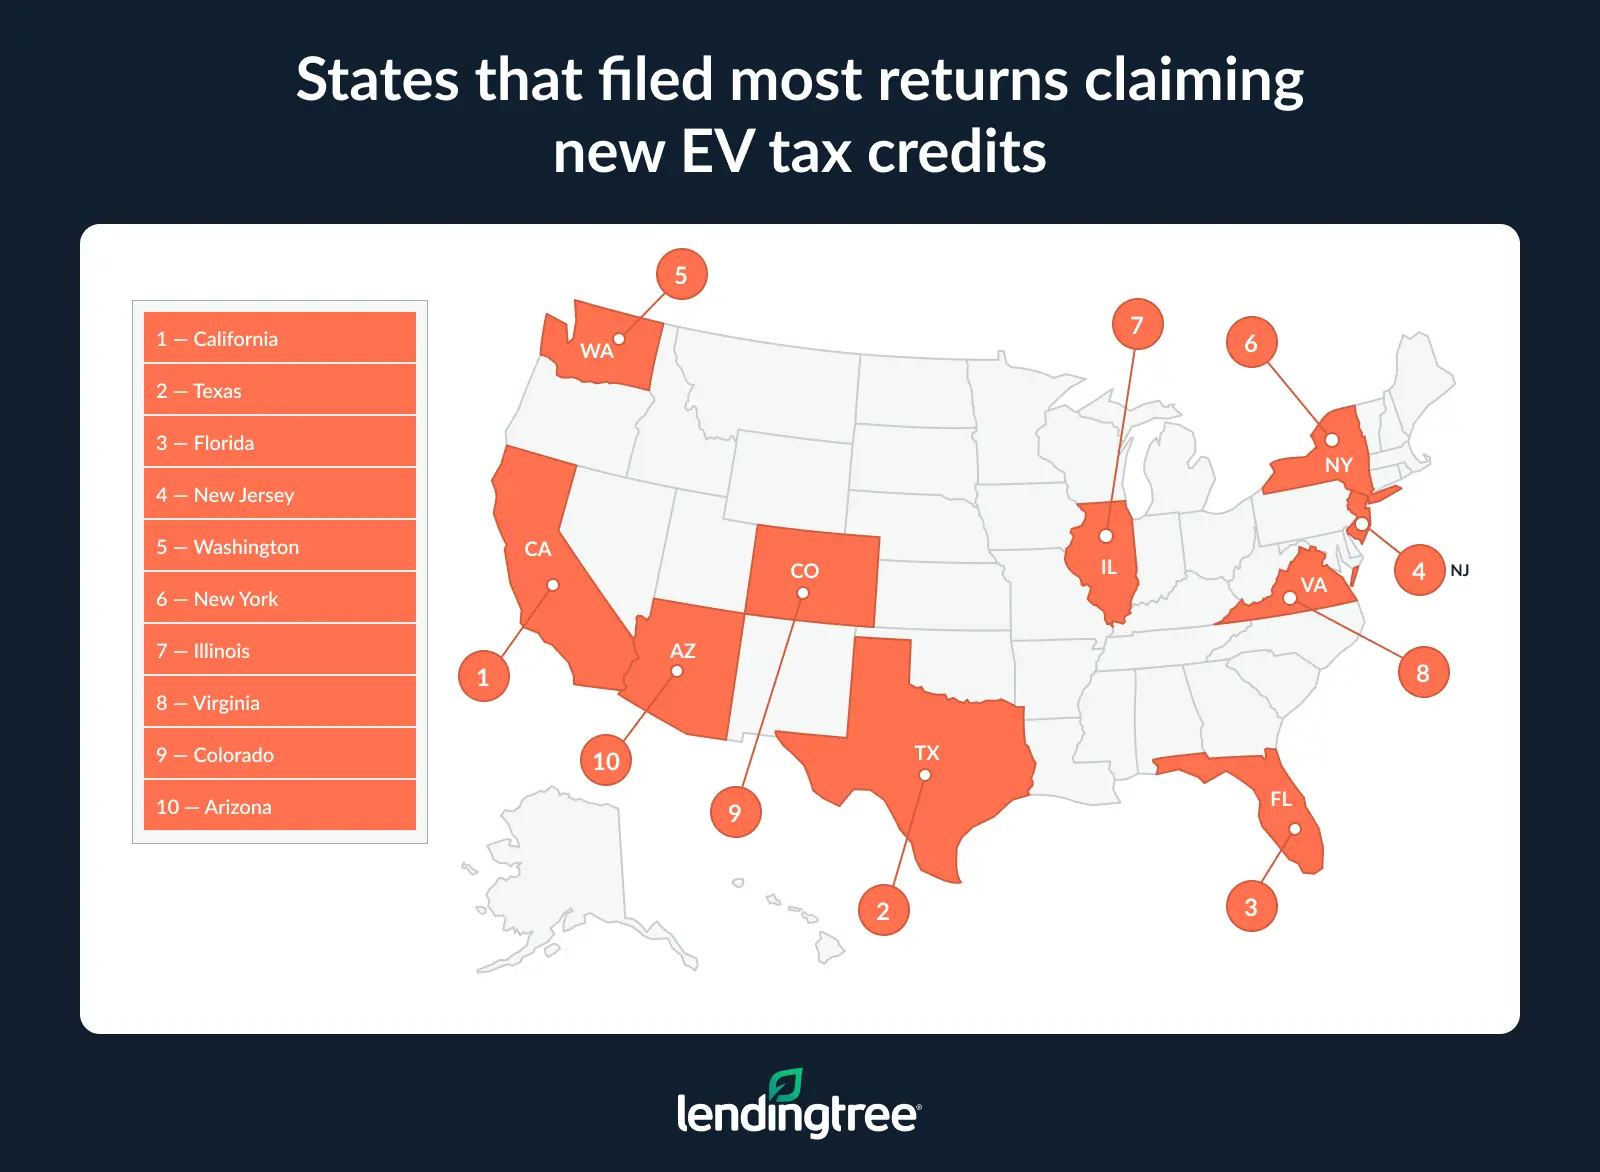
Texas follows at a distant 38,870 claims (or 8.0% of all returns). Florida ranks third, at 30,090 (or 6.2%). The rankings of the states’ potential losses and tax credit claims generally align outside of a few exceptions.
California also leads in used EV claims, with 6,540 returns accounting for 23.2% of U.S. claims. Washington (1,660, or 5.9%) and Texas (1,650, or 5.9%) follow.
Turning to per-capita figures, Californians make 857 EV tax credit claims (whether new or used) per 100,000 returns — far above the U.S. average of 320. Washington (571) and New Jersey (506) have the next highest per-capita claim rates.
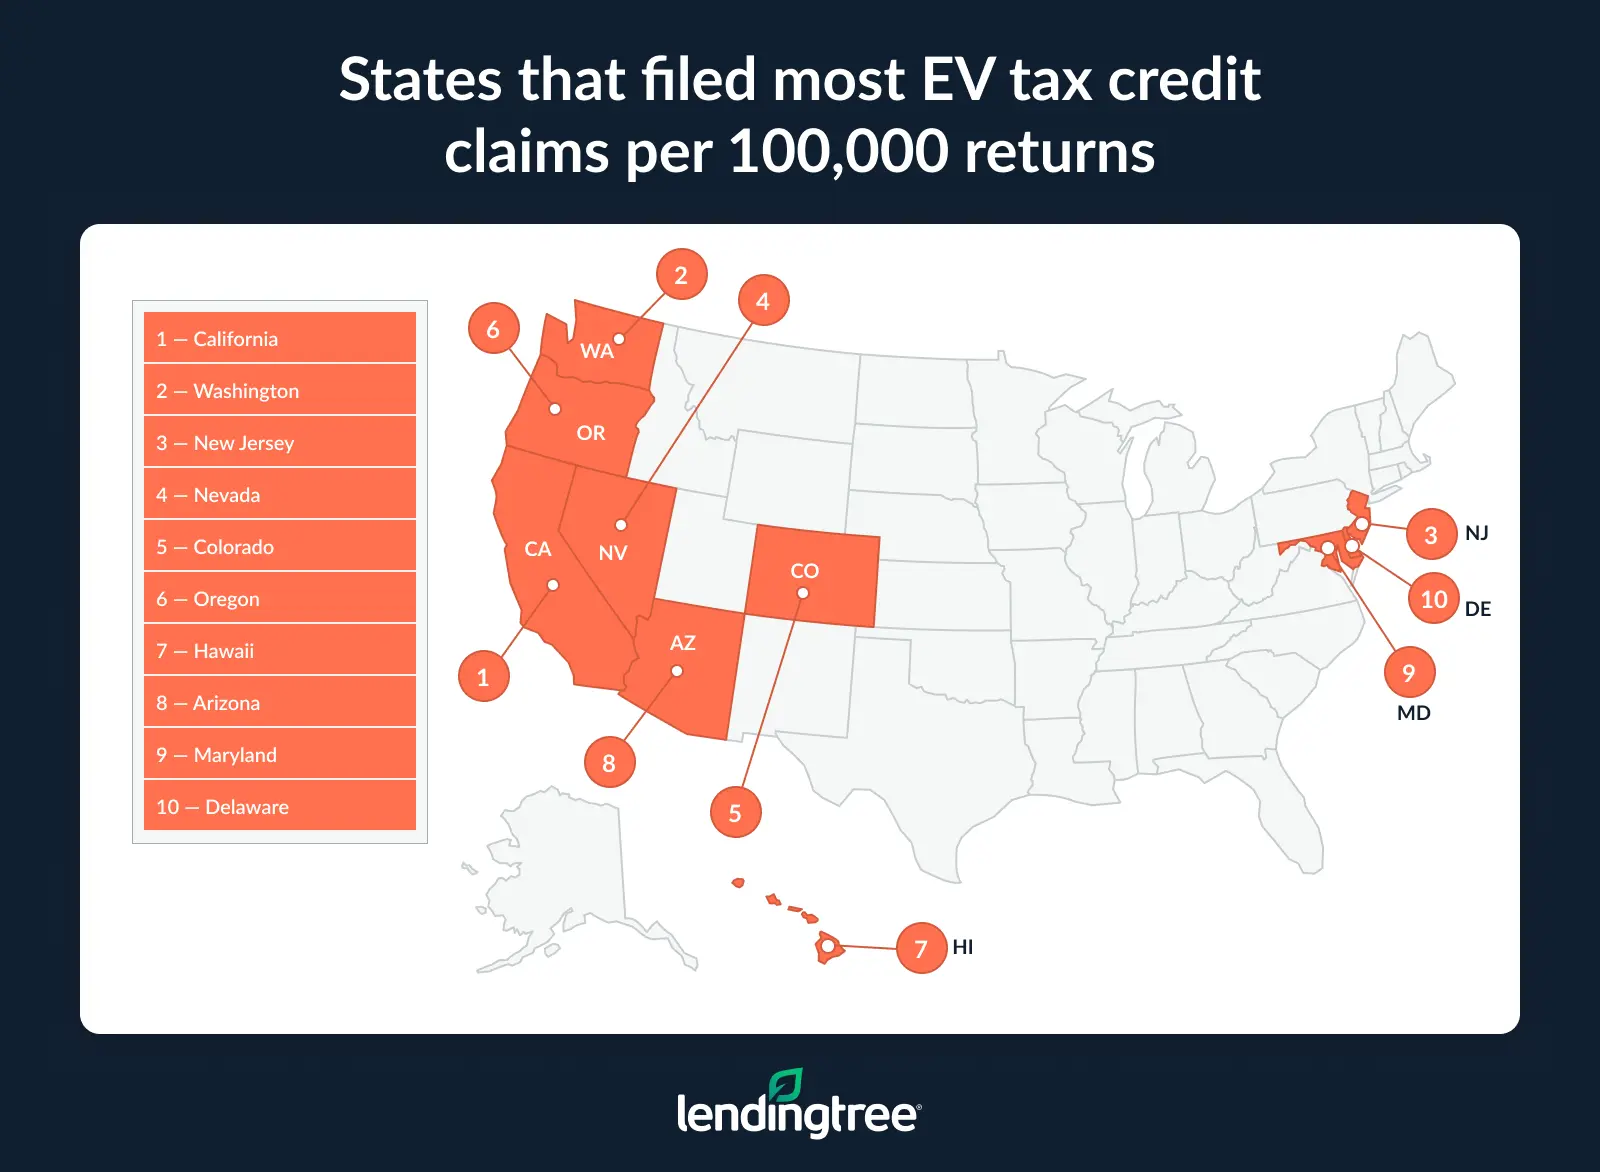
Conversely, Mississippi (44), North Dakota (51) and Louisiana (57) have the fewest claims compared to their number of individual tax returns.
Full rankings: States that filed most returns claiming new EV tax credits
| Rank | State | # of returns claiming credit | Amount (in thousands) | Avg. per return | % of total new EV tax credit returns |
|---|---|---|---|---|---|
| 1 | California | 157,360 | $1,044,071 | $6,635 | 32.2% |
| 2 | Texas | 38,870 | $267,015 | $6,869 | 8.0% |
| 3 | Florida | 30,090 | $196,506 | $6,531 | 6.2% |
| 4 | New Jersey | 23,090 | $160,742 | $6,962 | 4.7% |
| 5 | Washington | 19,850 | $136,819 | $6,893 | 4.1% |
| 6 | New York | 16,850 | $103,888 | $6,165 | 3.5% |
| 7 | Illinois | 14,910 | $100,525 | $6,742 | 3.1% |
| 8 | Virginia | 13,700 | $94,751 | $6,916 | 2.8% |
| 9 | Colorado | 13,060 | $88,462 | $6,774 | 2.7% |
| 10 | Arizona | 12,860 | $86,541 | $6,729 | 2.6% |
| 11 | Georgia | 12,360 | $82,772 | $6,697 | 2.5% |
| 12 | North Carolina | 11,990 | $82,959 | $6,919 | 2.5% |
| 13 | Maryland | 11,450 | $79,113 | $6,909 | 2.3% |
| 14 | Massachusetts | 10,690 | $73,905 | $6,913 | 2.2% |
| 15 | Pennsylvania | 10,680 | $71,961 | $6,738 | 2.2% |
| 16 | Oregon | 8,090 | $54,166 | $6,695 | 1.7% |
| 17 | Ohio | 7,900 | $53,821 | $6,813 | 1.6% |
| 18 | Nevada | 7,350 | $47,412 | $6,451 | 1.5% |
| 19 | Michigan | 7,320 | $48,941 | $6,686 | 1.5% |
| 20 | Minnesota | 5,420 | $37,218 | $6,867 | 1.1% |
| 21 | Utah | 4,700 | $31,431 | $6,687 | 1.0% |
| 22 | Tennessee | 4,550 | $30,492 | $6,702 | 0.9% |
| 23 | Connecticut | 3,910 | $26,730 | $6,836 | 0.8% |
| 24 | Missouri | 3,870 | $26,292 | $6,794 | 0.8% |
| 25 | Indiana | 3,820 | $25,631 | $6,710 | 0.8% |
| 26 | Wisconsin | 3,610 | $24,429 | $6,767 | 0.7% |
| 27 | South Carolina | 3,090 | $20,778 | $6,724 | 0.6% |
| 28 | Hawaii | 2,880 | $19,325 | $6,710 | 0.6% |
| 29 | Alabama | 1,890 | $12,537 | $6,633 | 0.4% |
| 30 | Delaware | 1,850 | $12,906 | $6,976 | 0.4% |
| 30 | Kentucky | 1,850 | $12,224 | $6,608 | 0.4% |
| 32 | Kansas | 1,730 | $11,813 | $6,828 | 0.4% |
| 33 | Oklahoma | 1,590 | $10,522 | $6,618 | 0.3% |
| 34 | New Mexico | 1,500 | $9,980 | $6,653 | 0.3% |
| 35 | Iowa | 1,450 | $9,723 | $6,706 | 0.3% |
| 36 | New Hampshire | 1,370 | $9,386 | $6,851 | 0.3% |
| 37 | Idaho | 1,130 | $7,429 | $6,574 | 0.2% |
| 38 | Arkansas | 1,090 | $7,336 | $6,730 | 0.2% |
| 39 | Nebraska | 1,080 | $7,261 | $6,723 | 0.2% |
| 40 | Louisiana | 1,020 | $6,408 | $6,282 | 0.2% |
| 41 | Vermont | 990 | $6,527 | $6,593 | 0.2% |
| 42 | Rhode Island | 970 | $6,533 | $6,735 | 0.2% |
| 43 | Maine | 900 | $5,727 | $6,363 | 0.2% |
| 44 | District of Columbia | 770 | $5,101 | $6,625 | 0.2% |
| 45 | West Virginia | 520 | $3,409 | $6,556 | 0.1% |
| 46 | Mississippi | 480 | $2,972 | $6,192 | 0.1% |
| 47 | Alaska | 360 | $2,271 | $6,308 | 0.1% |
| 48 | Montana | 310 | $1,935 | $6,242 | 0.1% |
| 49 | South Dakota | 260 | $1,685 | $6,481 | 0.1% |
| 50 | North Dakota | 170 | $1,046 | $6,153 | 0.0% |
| 51 | Wyoming | 160 | $935 | $5,844 | 0.0% |
Full rankings: States that filed most returns claiming used EV tax credits
| Rank | State | # of returns claiming credit | Amount (in thousands) | Avg. per return | % of total used EV tax credit returns |
|---|---|---|---|---|---|
| 1 | California | 6,540 | $21,743 | $3,325 | 23.2% |
| 2 | Washington | 1,660 | $5,689 | $3,427 | 5.9% |
| 3 | Texas | 1,650 | $5,666 | $3,434 | 5.9% |
| 4 | Florida | 1,460 | $4,928 | $3,375 | 5.2% |
| 5 | Arizona | 1,000 | $3,453 | $3,453 | 3.5% |
| 5 | New York | 1,000 | $3,275 | $3,275 | 3.5% |
| 7 | Oregon | 930 | $3,219 | $3,461 | 3.3% |
| 8 | Colorado | 920 | $3,072 | $3,339 | 3.3% |
| 9 | Pennsylvania | 820 | $2,831 | $3,452 | 2.9% |
| 10 | Georgia | 760 | $2,537 | $3,338 | 2.7% |
| 11 | North Carolina | 750 | $2,602 | $3,469 | 2.7% |
| 11 | Illinois | 750 | $2,555 | $3,407 | 2.7% |
| 13 | Utah | 730 | $2,589 | $3,547 | 2.6% |
| 14 | Ohio | 710 | $2,367 | $3,334 | 2.5% |
| 15 | Michigan | 670 | $2,366 | $3,531 | 2.4% |
| 16 | Virginia | 620 | $2,116 | $3,413 | 2.2% |
| 17 | Minnesota | 610 | $2,190 | $3,590 | 2.2% |
| 18 | Massachusetts | 540 | $1,930 | $3,574 | 1.9% |
| 19 | Maryland | 470 | $1,592 | $3,387 | 1.7% |
| 20 | Indiana | 460 | $1,550 | $3,370 | 1.6% |
| 21 | Wisconsin | 450 | $1,544 | $3,431 | 1.6% |
| 22 | Nevada | 410 | $1,343 | $3,276 | 1.5% |
| 23 | New Jersey | 400 | $1,386 | $3,465 | 1.4% |
| 24 | Missouri | 390 | $1,338 | $3,431 | 1.4% |
| 25 | Tennessee | 380 | $1,253 | $3,297 | 1.3% |
| 26 | Connecticut | 250 | $873 | $3,492 | 0.9% |
| 27 | South Carolina | 240 | $817 | $3,404 | 0.9% |
| 28 | Kansas | 220 | $710 | $3,227 | 0.8% |
| 29 | Kentucky | 200 | $665 | $3,325 | 0.7% |
| 30 | Iowa | 190 | $661 | $3,479 | 0.7% |
| 31 | Alabama | 180 | $592 | $3,289 | 0.6% |
| 31 | New Mexico | 180 | $577 | $3,206 | 0.6% |
| 31 | Idaho | 180 | $570 | $3,167 | 0.6% |
| 34 | Maine | 170 | $574 | $3,376 | 0.6% |
| 35 | Oklahoma | 150 | $519 | $3,460 | 0.5% |
| 35 | Vermont | 150 | $498 | $3,320 | 0.5% |
| 37 | New Hampshire | 140 | $480 | $3,429 | 0.5% |
| 38 | Hawaii | 130 | $414 | $3,185 | 0.5% |
| 39 | Nebraska | 110 | $361 | $3,282 | 0.4% |
| 40 | Arkansas | 100 | $307 | $3,070 | 0.4% |
| 41 | Rhode Island | 80 | $283 | $3,538 | 0.3% |
| 41 | Louisiana | 80 | $267 | $3,338 | 0.3% |
| 43 | Alaska | 60 | $227 | $3,783 | 0.2% |
| 43 | Delaware | 60 | $210 | $3,500 | 0.2% |
| 43 | Mississippi | 60 | $178 | $2,967 | 0.2% |
| 46 | District of Columbia | 50 | $175 | $3,500 | 0.2% |
| 47 | West Virginia | 40 | $139 | $3,475 | 0.1% |
| 47 | Montana | 40 | $121 | $3,025 | 0.1% |
| 49 | South Dakota | 20 | $69 | $3,450 | 0.1% |
| 49 | North Dakota | 20 | $61 | $3,050 | 0.1% |
| 51 | Wyoming | 10 | $52 | $4,000 | 0.0% |
Full rankings: States that filed most returns claiming new, used EV tax credits per capita
| Rank | State | # of returns claiming credit | Total individual tax returns | Claims per 100,000 returns |
|---|---|---|---|---|
| 1 | California | 163,900 | 19,124,265 | 857 |
| 2 | Washington | 21,510 | 3,769,036 | 571 |
| 3 | New Jersey | 23,490 | 4,642,496 | 506 |
| 4 | Nevada | 7,760 | 1,556,340 | 499 |
| 5 | Colorado | 13,980 | 3,096,522 | 451 |
| 6 | Oregon | 9,020 | 2,076,524 | 434 |
| 7 | Hawaii | 3,010 | 694,372 | 433 |
| 8 | Arizona | 13,860 | 3,375,895 | 411 |
| 9 | Maryland | 11,920 | 3,089,291 | 386 |
| 10 | Delaware | 1,910 | 502,694 | 380 |
| 11 | Utah | 5,430 | 1,543,866 | 352 |
| 12 | Virginia | 14,320 | 4,155,023 | 345 |
| 13 | Vermont | 1140 | 334,898 | 340 |
| 14 | Massachusetts | 11,230 | 3,593,199 | 313 |
| 15 | Texas | 40,520 | 13,644,352 | 297 |
| 16 | Florida | 31,550 | 11,243,202 | 281 |
| 17 | Georgia | 13,120 | 4,888,634 | 268 |
| 18 | North Carolina | 12,740 | 4,922,651 | 259 |
| 19 | Illinois | 15,660 | 6,094,211 | 257 |
| 20 | District of Columbia | 820 | 351,128 | 234 |
| 21 | Connecticut | 4,160 | 1,819,772 | 229 |
| 22 | Minnesota | 6,030 | 2,895,657 | 208 |
| 23 | New Hampshire | 1,510 | 727,940 | 207 |
| 24 | Rhode Island | 1050 | 571,304 | 184 |
| 25 | Pennsylvania | 11,500 | 6,291,892 | 183 |
| 26 | New York | 17,850 | 9,792,613 | 182 |
| 27 | New Mexico | 1,680 | 979,315 | 172 |
| 28 | Michigan | 7,990 | 4,858,106 | 164 |
| 29 | Tennessee | 4,930 | 3,242,083 | 152 |
| 29 | Ohio | 8,610 | 5,670,302 | 152 |
| 31 | Maine | 1070 | 708,046 | 151 |
| 32 | Idaho | 1,310 | 877,625 | 149 |
| 32 | Missouri | 4,260 | 2,861,706 | 149 |
| 34 | Kansas | 1,950 | 1,361,800 | 143 |
| 35 | Wisconsin | 4,060 | 2,936,639 | 138 |
| 36 | South Carolina | 3,330 | 2,472,144 | 135 |
| 37 | Indiana | 4,280 | 3,233,610 | 132 |
| 38 | Nebraska | 1,190 | 951,751 | 125 |
| 39 | Alaska | 420 | 342,151 | 123 |
| 40 | Iowa | 1,640 | 1,478,656 | 111 |
| 41 | Kentucky | 2,050 | 1,978,376 | 104 |
| 42 | Oklahoma | 1,740 | 1,694,294 | 103 |
| 43 | Alabama | 2,070 | 2,131,810 | 97 |
| 44 | Arkansas | 1,190 | 1,286,121 | 93 |
| 45 | West Virginia | 560 | 774,459 | 72 |
| 46 | Montana | 350 | 551,175 | 64 |
| 47 | South Dakota | 280 | 444,486 | 63 |
| 48 | Wyoming | 170 | 281,706 | 60 |
| 49 | Louisiana | 1,100 | 1,945,064 | 57 |
| 50 | North Dakota | 190 | 371,986 | 51 |
| 51 | Mississippi | 540 | 1,223,412 | 44 |
Electric vehicles still the minority
Nationwide, only 1.7% of light-duty vehicles registered in 2023 were electric (including plug-in hybrids). While that’s small, it’s an increase from 1.2% in 2022. Still, EV registrations have been growing significantly over time. In fact, registrations jumped 23.1% between 2019 and 2020, according to a LendingTree analysis of EV popularity.
Schulz strongly believes that eliminating the EV tax credit will slow the growth of electric vehicle adoption.
“Even though they may be less expensive over time, EVs tend to be more expensive up front than gas-powered vehicles,” he says. “Tax credits helped bridge that gap. But with those gone, that’ll no longer be possible. That makes EVs a harder sell today, especially given people’s cost consciousness amid rising prices for other products.”
California leads again, with 4.5% of registered vehicles being EVs. Why California? According to a LendingTree analysis of electric vehicle infrastructure, California had 281 EV- and PHEV-related laws and incentives earlier in 2025 — by far the most of any state.
The District of Columbia (3.8%) and Hawaii (3.0%) rank second and third, respectively. Conversely, just 0.2% of light-duty vehicles in Mississippi and North Dakota are electric.
When it comes to new EV sales, there were 310,839 in the second quarter of 2025. That’s a 6.3% decrease from Q2 2024.
The Tesla Model Y was the most popular EV in Q2 2025, selling 86,120 units. The Tesla Model 3 (48,803) and Chevrolet Equinox EV (17,420) follow.
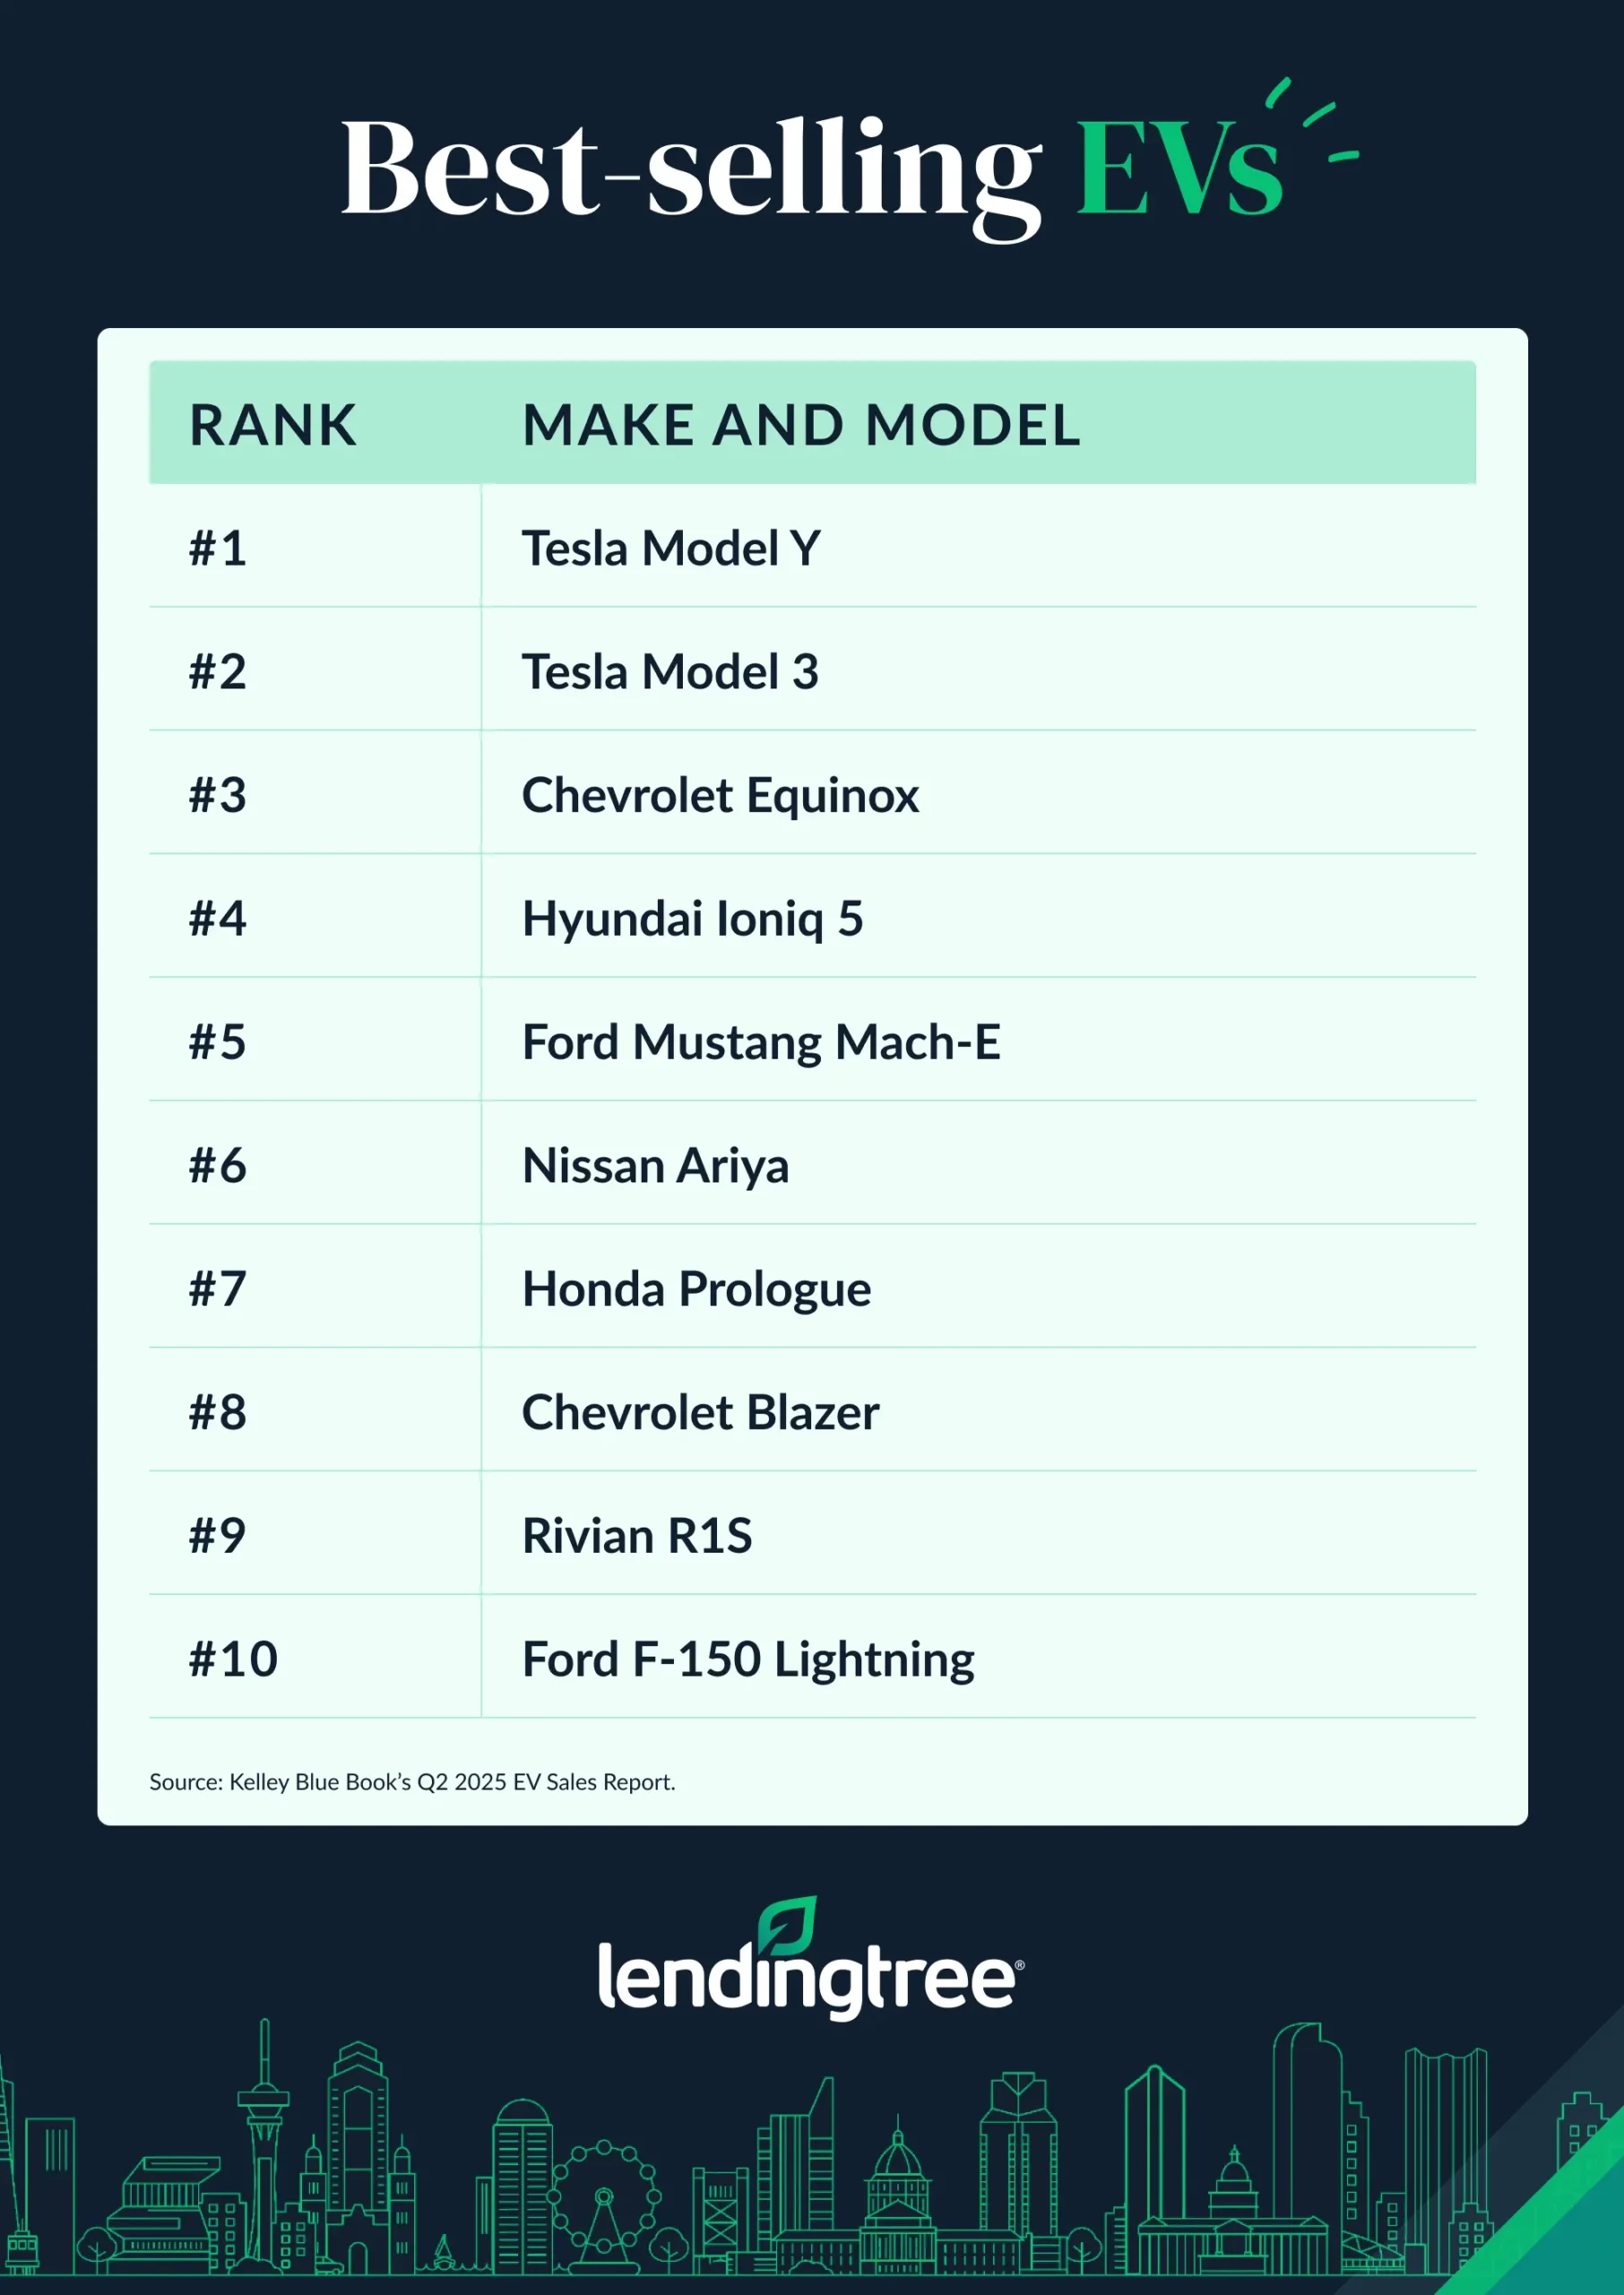
Meanwhile, Q1 and Q2 2025 sales totaled 607,089, up 1.5% from the same period last year.
Full rankings: States with highest EV adoption rates
| Rank | State | EV registrations | Light-duty registrations | EV share (%) | % of total EV registrations |
|---|---|---|---|---|---|
| 1 | California | 1,667,300 | 36,850,300 | 4.5% | 34.3% |
| 2 | District of Columbia | 11,800 | 312,100 | 3.8% | 0.2% |
| 3 | Hawaii | 32,900 | 1,080,100 | 3.0% | 0.7% |
| 4 | Washington | 193,300 | 6,816,100 | 2.8% | 4.0% |
| 5 | Oregon | 93,200 | 3,832,700 | 2.4% | 1.9% |
| 5 | New Jersey | 175,700 | 7,324,100 | 2.4% | 3.6% |
| 7 | Vermont | 13,500 | 593,100 | 2.3% | 0.3% |
| 7 | Colorado | 127,600 | 5,441,800 | 2.3% | 2.6% |
| 7 | Nevada | 58,000 | 2,556,100 | 2.3% | 1.2% |
| 10 | Massachusetts | 117,600 | 5,491,100 | 2.1% | 2.4% |
| 11 | Maryland | 103,400 | 5,060,000 | 2.0% | 2.1% |
| 11 | New York | 223,600 | 11,318,600 | 2.0% | 4.6% |
| 13 | Arizona | 115,400 | 6,529,000 | 1.8% | 2.4% |
| 14 | Utah | 53,000 | 3,076,200 | 1.7% | 1.1% |
| 14 | Connecticut | 50,000 | 2,945,700 | 1.7% | 1.0% |
| 14 | Florida | 312,200 | 18,583,200 | 1.7% | 6.4% |
| 17 | Virginia | 111,700 | 7,723,500 | 1.4% | 2.3% |
| 18 | Illinois | 133,000 | 10,043,200 | 1.3% | 2.7% |
| 18 | Delaware | 12,200 | 914,700 | 1.3% | 0.3% |
| 18 | Rhode Island | 11,500 | 877,600 | 1.3% | 0.2% |
| 18 | Oklahoma | 55,800 | 4,287,900 | 1.3% | 1.1% |
| 22 | Maine | 15,000 | 1,236,000 | 1.2% | 0.3% |
| 22 | New Hampshire | 16,500 | 1,383,700 | 1.2% | 0.3% |
| 22 | Georgia | 115,100 | 9,642,400 | 1.2% | 2.4% |
| 25 | Pennsylvania | 109,100 | 10,211,000 | 1.1% | 2.2% |
| 25 | Texas | 285,400 | 25,796,600 | 1.1% | 5.9% |
| 27 | Minnesota | 53,200 | 5,118,500 | 1.0% | 1.1% |
| 27 | North Carolina | 93,900 | 9,085,500 | 1.0% | 1.9% |
| 29 | Michigan | 79,400 | 8,525,400 | 0.9% | 1.6% |
| 30 | New Mexico | 15,200 | 1,952,400 | 0.8% | 0.3% |
| 31 | Idaho | 13,100 | 1,974,600 | 0.7% | 0.3% |
| 31 | Wisconsin | 37,400 | 5,529,000 | 0.7% | 0.8% |
| 31 | Montana | 7,100 | 1,021,700 | 0.7% | 0.1% |
| 31 | Missouri | 40,800 | 5,626,000 | 0.7% | 0.8% |
| 31 | Ohio | 74,400 | 10,317,300 | 0.7% | 1.5% |
| 31 | Tennessee | 44,200 | 6,538,800 | 0.7% | 0.9% |
| 37 | Indiana | 39,000 | 6,172,100 | 0.6% | 0.8% |
| 37 | Kansas | 16,900 | 2,621,100 | 0.6% | 0.3% |
| 37 | Alaska | 3,600 | 559,800 | 0.6% | 0.1% |
| 37 | South Carolina | 29,900 | 5,042,400 | 0.6% | 0.6% |
| 41 | Iowa | 15,100 | 3,153,300 | 0.5% | 0.3% |
| 41 | Nebraska | 10,700 | 1,971,200 | 0.5% | 0.2% |
| 43 | Kentucky | 17,200 | 4,039,700 | 0.4% | 0.4% |
| 43 | Alabama | 18,800 | 4,835,900 | 0.4% | 0.4% |
| 43 | Arkansas | 10,300 | 2,708,300 | 0.4% | 0.2% |
| 46 | West Virginia | 4,600 | 1,510,900 | 0.3% | 0.1% |
| 46 | South Dakota | 3,000 | 918,000 | 0.3% | 0.1% |
| 46 | Wyoming | 1,900 | 652,900 | 0.3% | 0.0% |
| 46 | Louisiana | 12,200 | 3,774,200 | 0.3% | 0.3% |
| 50 | North Dakota | 1,800 | 797,400 | 0.2% | 0.0% |
| 50 | Mississippi | 5,600 | 2,723,300 | 0.2% | 0.1% |
Going electric after federal incentives end? Top financial tips
In light of expiring tax credits, there are a few new things to keep in mind when weighing the financial benefits of purchasing an EV. Here’s what we recommend:
- If you have your heart set on an electric vehicle, the disappearance of the EV tax credit makes it even more important for you to find other ways to keep your costs down. “Comparing rates among various lenders is a must,” Schulz says. “Offers can vary widely among lenders, so you may pay too much if you go with the first option. It’s also important to shop around with various sellers. It has never been easier to compare prices from a variety of car sellers.”
- If you’re considering an EV for the first time, ask yourself some key questions. Are you willing to pay extra up front to get an electric vehicle? Do you expect to keep it long enough to realize savings from reduced gas usage? Does your area have the infrastructure to support EVs? Do you frequently drive long distances where having an EV might prove challenging? “These are just a few of the things to think through,” Schulz says. “If you do, they’ll lead to making the best choice for you and your family.”
- Factor in resale value early. With EV technology evolving quickly, today’s models can depreciate faster than traditional models. Before you buy, research which models retain their value best and whether battery replacement costs might impact their value in the future. A little foresight now can save thousands of dollars later.
Methodology
LendingTree researchers used IRS data on individual income tax returns for fiscal year 2024 and the Clean Vehicle Credits table for tax year 2023 (claims filed in 2024 through Nov. 21) by state. Electric vehicle (EV) tax credit claims per 100,000 returns (for used and new vehicles) were calculated using these datasets.
To determine adoption rates, we combined state-level registrations of EVs and plug-in hybrid EVs (PHEVs). We then divided this total by the total number of light-duty vehicle registrations sourced from the U.S. Department of Energy Alternative Fuels Data Center (AFDC) for 2023.
We also utilized Kelley Blue Book’s Q1 and Q2 2025 EV Sales Reports.
Get auto loan offers from up to 5 lenders in minutes