Construction Wages Up 21% — States Where Industry Is Struggling the Most


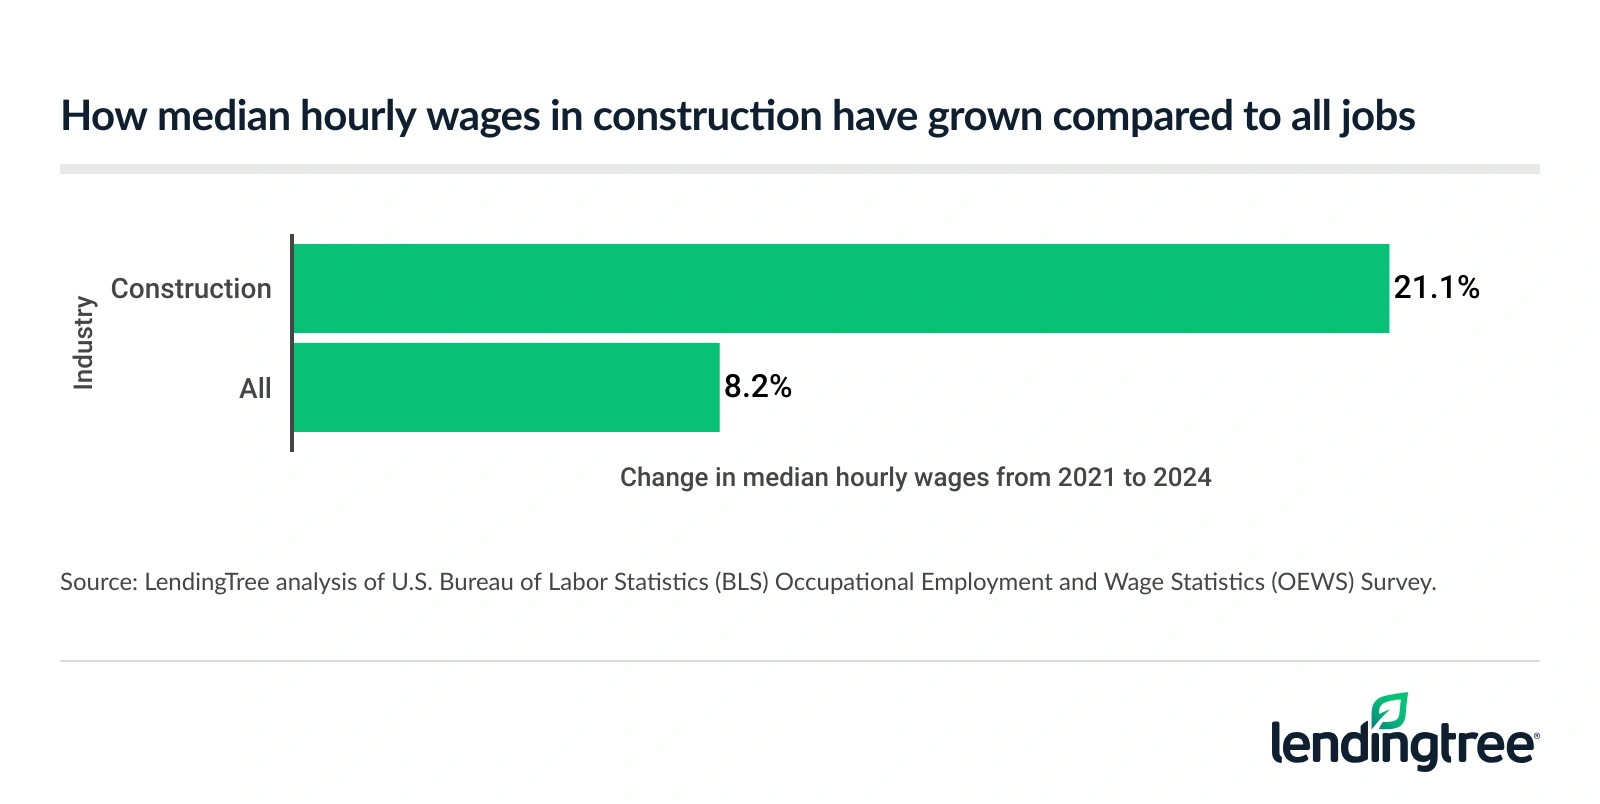
Median hourly wages for construction workers rose 21.1% from 2021 to 2024 — more than double the 8.2% wage growth across all occupations. On the surface, higher pay is encouraging, but it can also signal underlying challenges, such as severe labor shortages.
To better understand the health of the construction industry, our study measures key indicators in every state, revealing where the industry is thriving and where it’s struggling the most.
Key findings
- The construction industry faces mounting challenges. Median hourly wages for construction workers rose 21.1% from 2021 to 2024, significantly outpacing the 8.2% growth across all occupations. This much sharper increase points to strong demand and hiring difficulties.
- Pennsylvania’s construction industry is under the most strain. Construction wages in the state grew 13.4 percentage points faster than overall wage growth, while industry employment was 7.4 points slower than total job growth — trends that indicate a tightening labor market. The District of Columbia and Massachusetts tie for the next highest level of strain.
- Idaho’s construction industry appears to be the healthiest. In this state, construction wage growth has remained below the overall rate — suggesting employers aren’t facing labor shortages — and employment is expanding faster than in the economy as a whole.
Median wages for construction workers rose faster than average
Median hourly wages for construction industry workers rose sharply between 2021 and 2024, jumping 21.1% from $23.18 to $28.06. The bump is more than double the 8.2% wage growth across all occupations over the same period. Hourly wages rose from $22.00 to $23.80 for workers in all industries.
While wages have increased in the construction industry, its job growth rate tells a contrasting story. Construction employment increased by 8.8% from 2021 to 2024 — slower than the 9.4% growth rate across all industries.
“That’s massive growth in hourly wages in such a short amount of time,” says Matt Schulz, LendingTree chief consumer finance analyst and author of “Ask Questions, Save Money, Make More: How to Take Control of Your Financial Life.” “That’s great news for construction workers because it hints there’s incredibly strong demand for their skills.”
However, the sharp wage increase, alongside slower job growth, reflects the industry’s labor supply challenges. In recent years, the construction industry has struggled to keep up with the demand for skilled workers — a challenge driven by multiple factors. Along with an aging workforce and a lack of younger workers entering the field, there’s been a concurrent boom in urbanization, infrastructure investments and private construction projects, particularly in fast-growing areas.
These pressures have left construction companies scrambling to fill positions, resulting in increased wages as they compete to hire from a limited talent pool.
Despite the slower construction job growth between 2021 and 2024, employment in the industry is expected to outpace overall job growth over the next decade.
In 2023, construction employment reached an all-time high, overcoming losses caused by the Great Recession. Between 2023 and 2033, the U.S. Bureau of Labor Statistics estimates a 4.7% increase in construction jobs, compared with 4.0% for all industries.
Associated Builders and Contractors, a national trade association representing the construction industry, estimates the field will need to gain 439,000 new workers in 2025 and 499,000 more in 2026 to meet the expected demand for construction services.
Pennsylvania’s construction industry is struggling the most
Our study reviewed three metrics to determine which states were struggling the most and least in this regard: construction wage growth relative to all industries, construction employment growth relative to all industries and the number of new housing construction permits per 1,000 housing units.
From 2021 to 2024, hourly wages in Pennsylvania’s construction industry increased by 21.5%, compared with just 8.1% for all sectors in the state — a 13.4 percentage point difference and the fifth-biggest gap in our study.
Also, employment growth in Pennsylvania’s construction sector lagged severely behind total job growth. Construction employment grew a mere 0.4%, while job growth across all industries was 7.7%. Additionally, the Keystone State had only 4.25 new construction permits per 1,000 existing housing units, the fifth-lowest rate for that metric in our study.
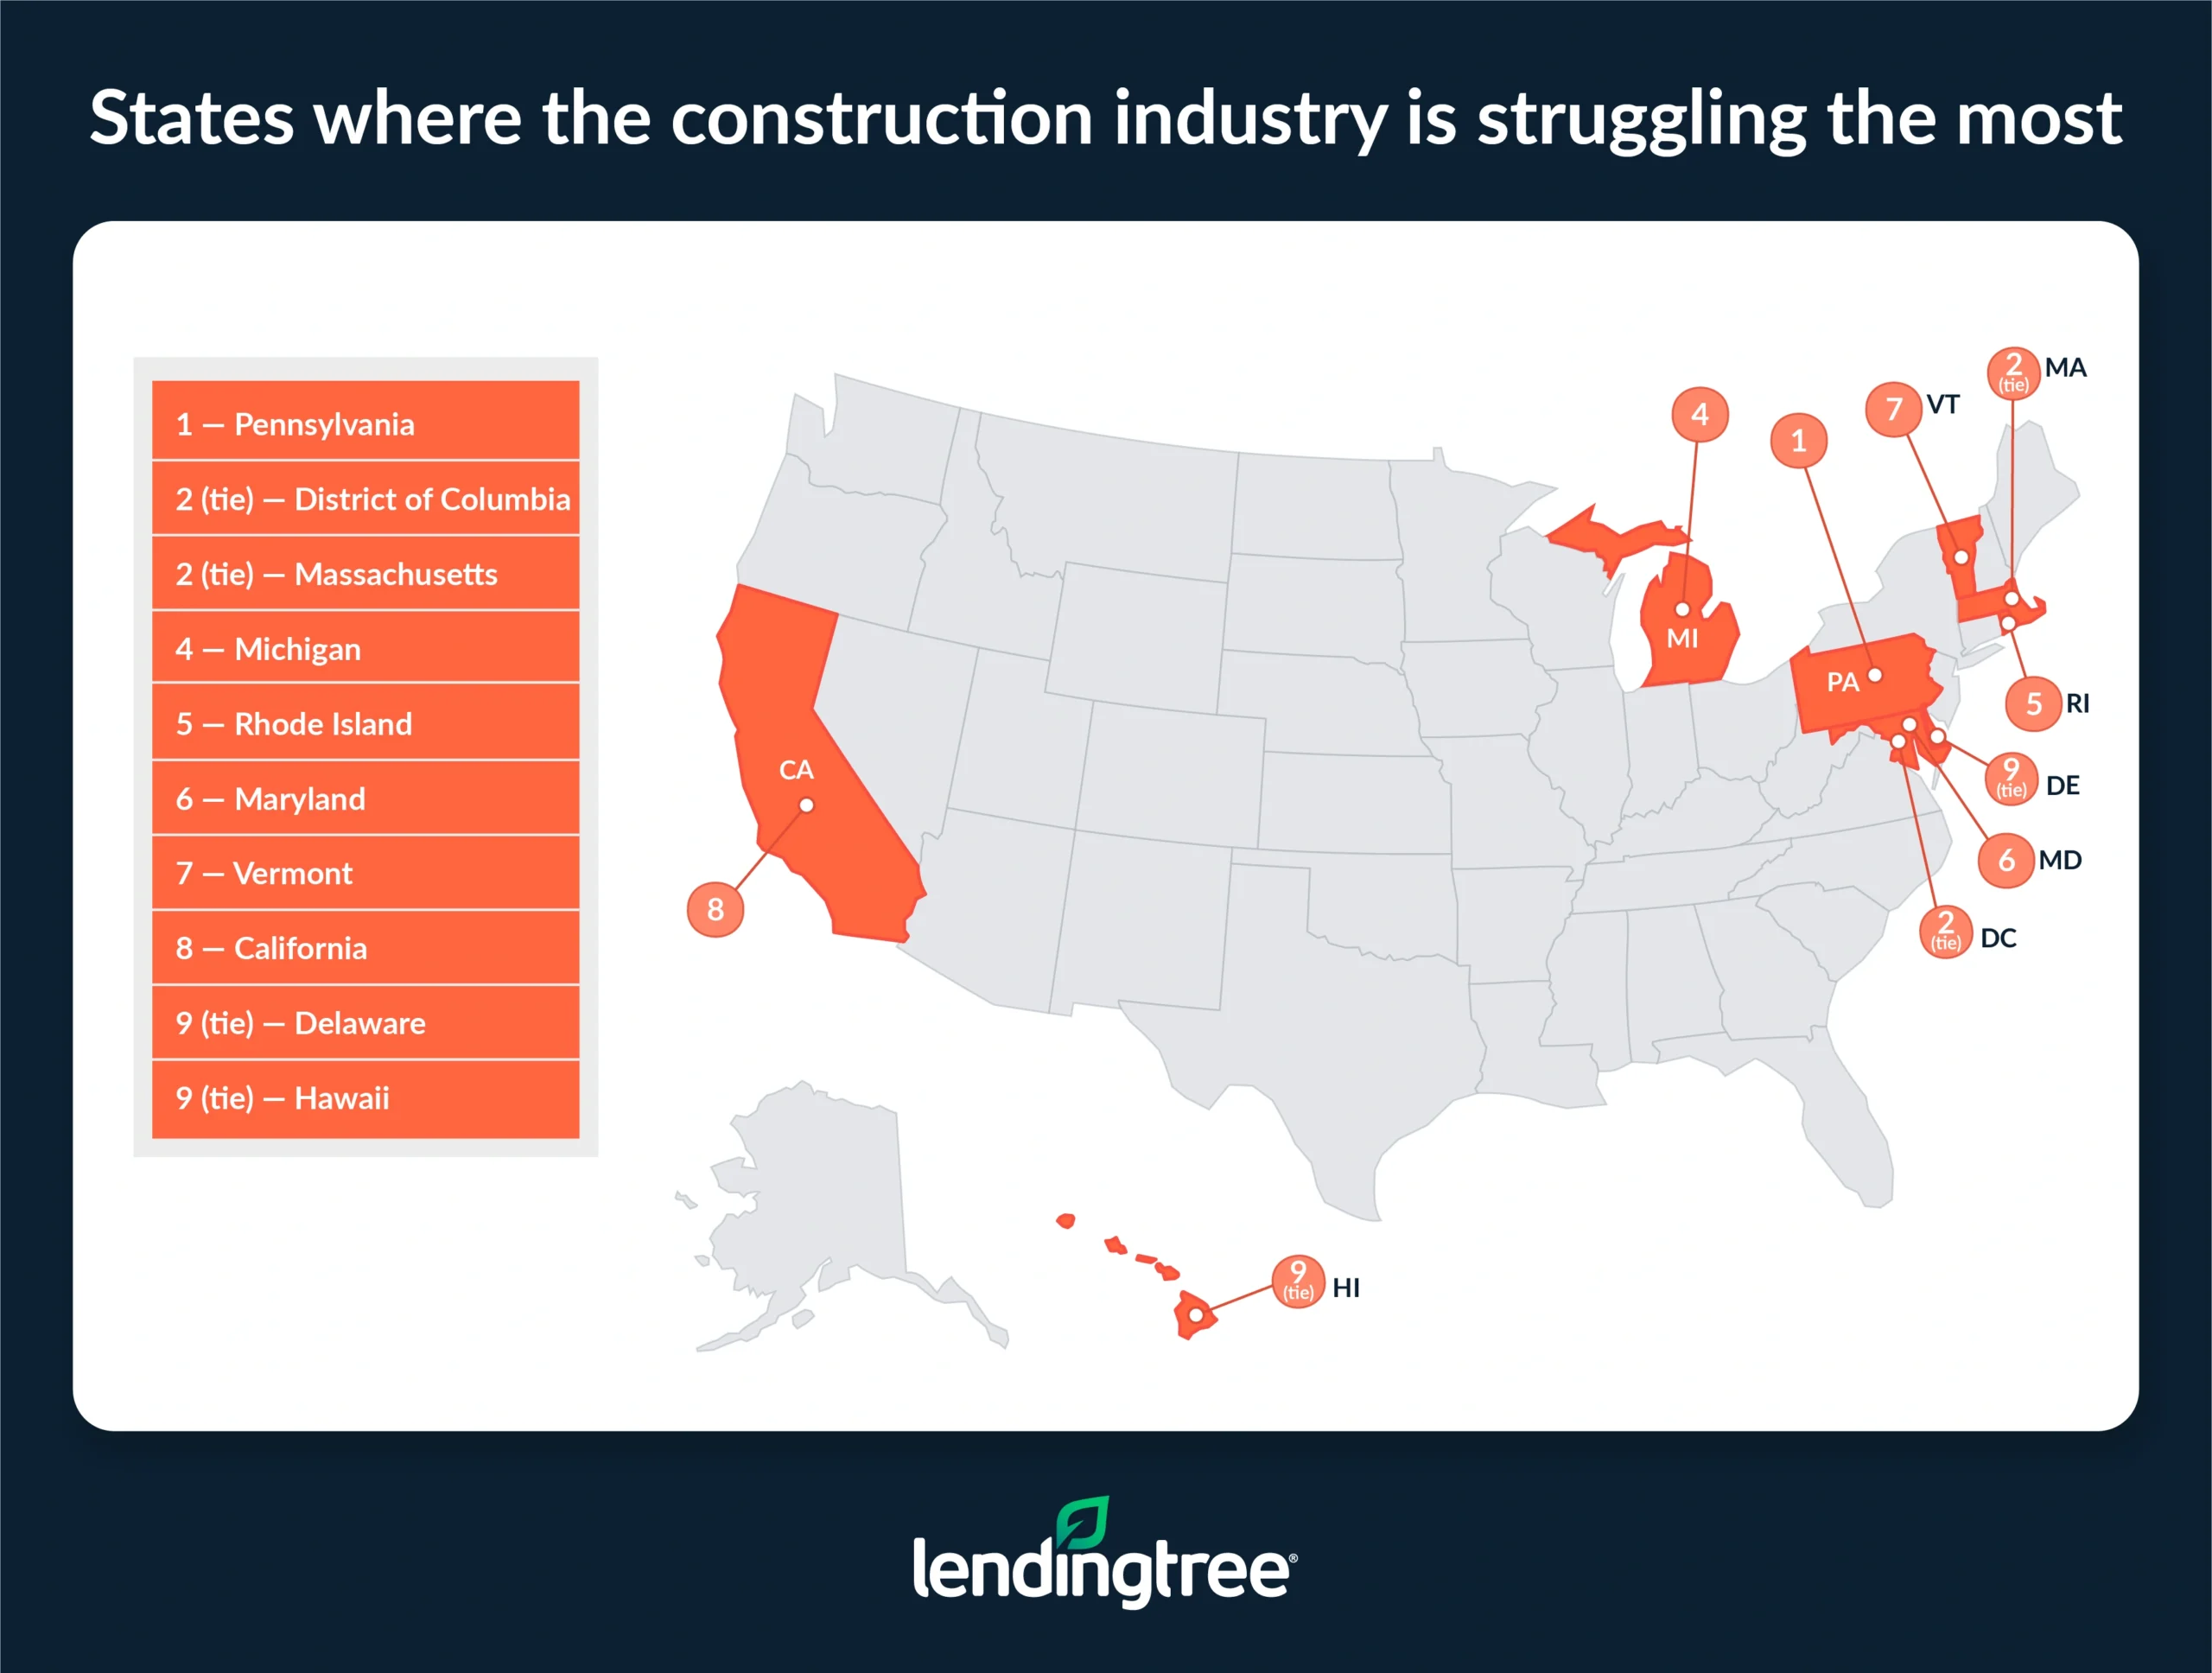
The District of Columbia and Massachusetts tie for the second-worst health. The nation’s capital saw a healthy 1.5 percentage point difference between its construction median hourly wage increase (11.5%) and overall median hourly wage increase (10.1%). However, construction employment fell by 5.3% between 2021 and 2024, while overall employment grew by 7.1% — creating a -12.4 percentage point gap, the second-worst in our study.
Massachusetts had the third-highest percentage point difference in construction wage growth compared to all industries at 22.8% versus 6.4%, a 16.4 percentage point gap.
Challenges in the construction industry have led to project delays and increased building costs, which ultimately impact consumers. “When the cost of building a new home goes up, the price of that home is probably going to go up, too,” Schulz says. “That’s true whether you’re talking about the costs of labor, supplies or anything else that goes into building a home. It all adds up to make homebuilding more expensive, which means higher home prices for consumers.”
Idaho’s construction industry is struggling the least
The construction industry in Idaho appears to be the healthiest in the country. Wage growth in the state’s construction sector (14.4%) was substantially lower than the overall wage growth (23.8%): a -9.4 percentage point difference. Meanwhile, the growth rate in the construction industry was in the double digits (23.7%) and over twice the state’s overall job growth rate (11.6%).
The lower relative wage growth and double-digit employment increase indicate that Idaho’s construction industry isn’t facing widespread labor shortages and is growing at a healthy clip without having to raise wages to incentivize or attract workers.
The Gem State reported 21.62 new permits per 1,000 housing units, giving it the highest ranking for that metric. It’s the only state above 20.00.
Idaho’s thriving construction industry is likely fueled mainly by the state’s rapid population growth. Idaho experienced the seventh-highest population increase between 2023 and 2024, according to the U.S. Census Bureau, resulting in a surge in housing demand and construction activity. Employment in Idaho’s construction sector grew more than 60% from 2004 to 2024, and construction is one of the state’s top industries, according to its Department of Labor.
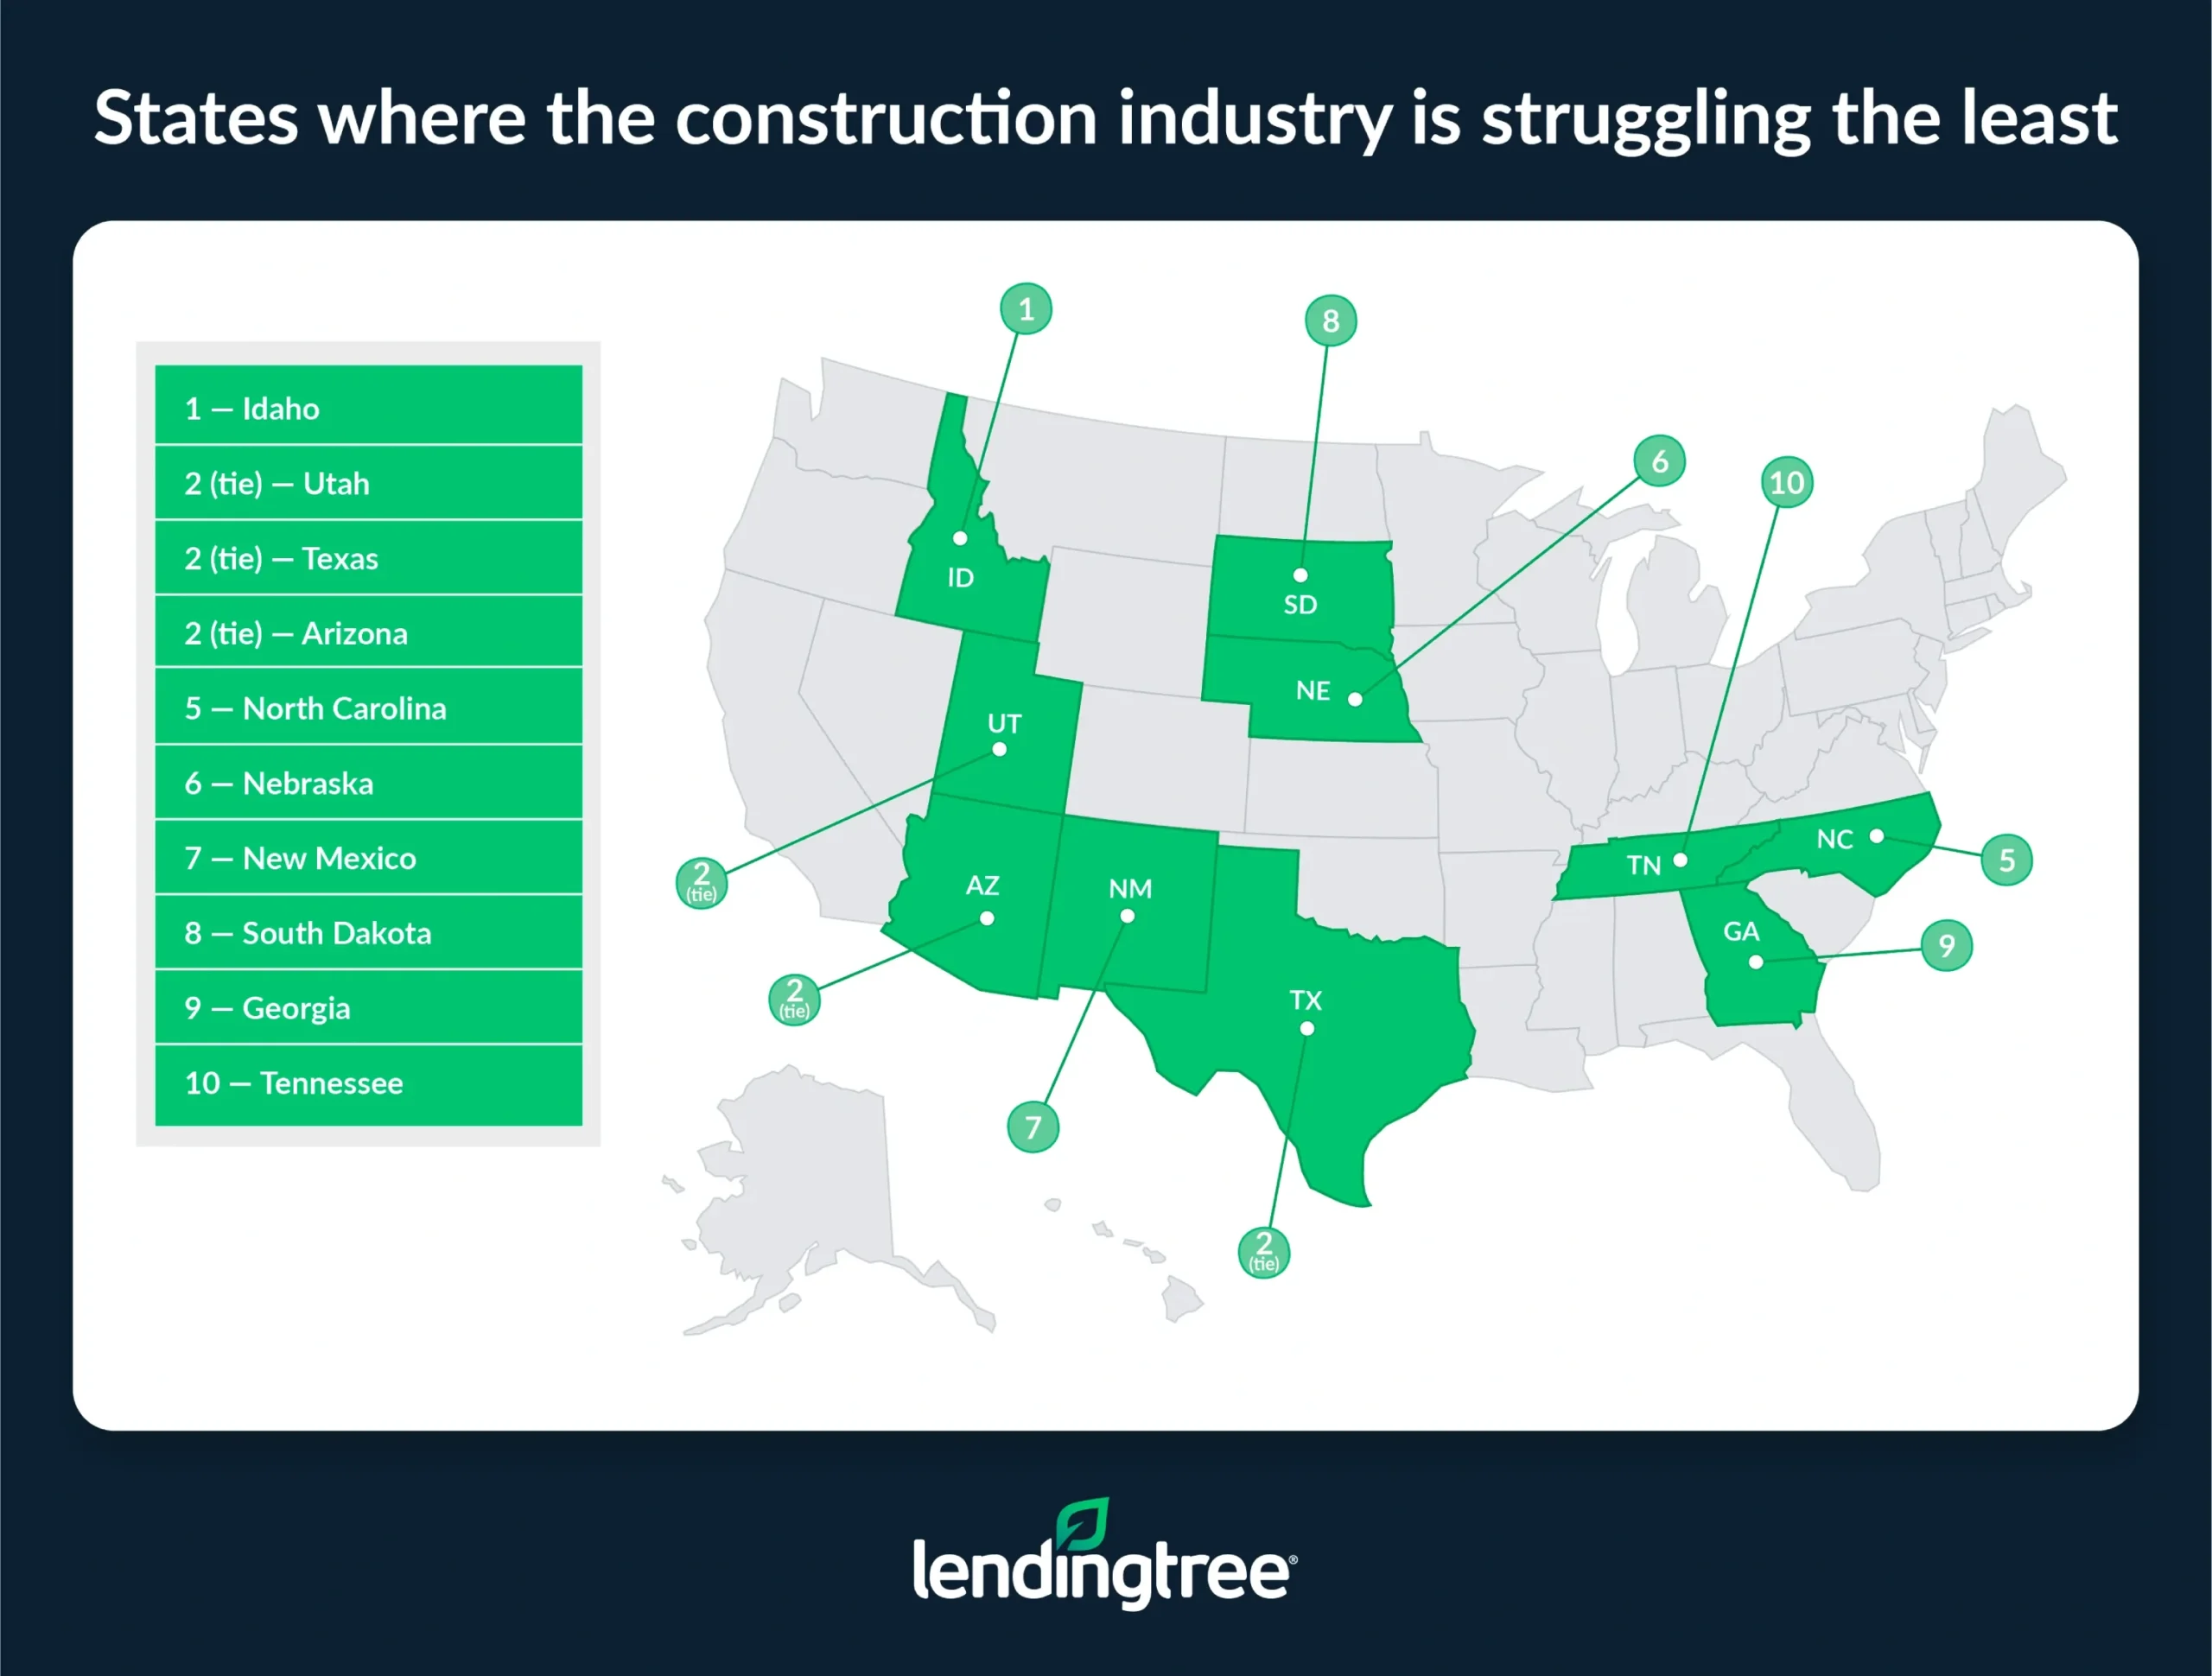
Utah, Texas and Arizona tie for the second-healthiest construction industry climates. Wage growth in Utah’s construction sector (13.6%) was lower than the overall wage growth (25.0%), a gap representing a -11.4 percentage point difference. The Beehive State also had the third-highest rate of new construction permits per 1,000 housing units, 18.99.
Texas experienced the lowest relative wage growth in our study (-14.6) while still having higher construction employment growth (15.6%) than the overall job growth rate (13.3%). Meanwhile, Arizona had the second-highest score for relative employment growth (15.7) and the fifth-highest rate of new permits per 1,000 (18.40).
These three states all experienced substantial population growth in recent years, prompting major infrastructure projects and driving the demand for residential and commercial construction.
Full rankings
| Rank | State | Index score | Wage change, overall | Wage change, construction | Difference | Employment change, overall | Employment change, construction | Difference | New permits per 1,000 units |
|---|---|---|---|---|---|---|---|---|---|
| 1 | Pennsylvania | 100.0 | 8.1% | 21.5% | 13.4 | 7.7% | 0.4% | -7.4 | 4.25 |
| 2 | District of Columbia | 90.7 | 10.1% | 11.5% | 1.5 | 7.1% | -5.3% | -12.4 | 4.73 |
| 2 | Massachusetts | 90.7 | 6.4% | 22.8% | 16.4 | 7.3% | 5.3% | -2.0 | 4.71 |
| 4 | Michigan | 84.7 | 6.9% | 24.0% | 17.1 | 8.2% | 9.8% | 1.6 | 4.68 |
| 5 | Rhode Island | 79.7 | 13.1% | 7.5% | -5.6 | 7.9% | -1.2% | -9.1 | 3.61 |
| 6 | Maryland | 78.0 | 19.8% | 21.9% | 2.1 | 7.9% | 3.0% | -4.9 | 6.54 |
| 7 | Vermont | 76.3 | 11.8% | 21.7% | 10.0 | 7.1% | 3.5% | -3.6 | 7.77 |
| 8 | California | 73.7 | 18.8% | 17.8% | -1.1 | 9.2% | 2.4% | -6.9 | 6.88 |
| 9 | Delaware | 70.3 | 9.3% | 23.4% | 14.2 | 9.4% | 1.8% | -7.6 | 15.15 |
| 9 | Hawaii | 70.3 | 11.7% | 6.7% | -5.0 | 13.2% | -2.2% | -15.4 | 6.78 |
| 11 | Connecticut | 66.9 | 19.9% | 5.7% | -14.2 | 6.9% | -0.7% | -7.6 | 3.83 |
| 12 | Maine | 66.1 | 15.1% | 24.6% | 9.4 | 7.3% | 6.9% | -0.4 | 7.97 |
| 13 | Alabama | 65.3 | 17.6% | 23.9% | 6.3 | 8.5% | 5.1% | -3.4 | 8.78 |
| 14 | Wyoming | 64.4 | 7.2% | 19.6% | 12.4 | 6.9% | 9.7% | 2.8 | 7.62 |
| 15 | Illinois | 63.6 | 7.2% | 6.0% | -1.3 | 7.9% | 11.3% | 3.4 | 3.72 |
| 15 | New York | 63.6 | 20.0% | 9.6% | -10.5 | 10.1% | 3.6% | -6.4 | 5.39 |
| 17 | Mississippi | 61.9 | 11.4% | 20.5% | 9.1 | 5.3% | 10.9% | 5.7 | 5.84 |
| 17 | South Carolina | 61.9 | 20.2% | 25.5% | 5.4 | 9.9% | -0.3% | -10.2 | 18.90 |
| 19 | Ohio | 61.0 | 21.1% | 24.1% | 2.9 | 6.3% | 10.7% | 4.4 | 5.91 |
| 19 | Wisconsin | 61.0 | 8.7% | 8.7% | 0.0 | 6.1% | 2.3% | -3.8 | 8.55 |
| 21 | North Dakota | 60.2 | 7.1% | 24.1% | 16.9 | 7.3% | 24.4% | 17.1 | 6.13 |
| 22 | Nevada | 58.5 | 22.6% | 25.8% | 3.2 | 18.6% | 12.5% | -6.1 | 14.83 |
| 23 | Minnesota | 56.8 | 13.1% | 15.1% | 2.0 | 6.8% | 6.4% | -0.4 | 8.12 |
| 24 | Washington | 55.9 | 22.1% | 20.2% | -1.9 | 10.4% | 2.9% | -7.5 | 11.24 |
| 25 | Alaska | 53.4 | 21.7% | 18.5% | -3.2 | 8.5% | 15.3% | 6.8 | 3.13 |
| 26 | New Hampshire | 52.5 | 12.0% | 22.3% | 10.3 | 7.5% | 18.3% | 10.7 | 7.60 |
| 27 | Virginia | 51.7 | 12.3% | 10.0% | -2.3 | 8.3% | 3.4% | -4.9 | 9.16 |
| 28 | Oklahoma | 49.2 | 17.2% | 7.5% | -9.7 | 8.6% | 5.3% | -3.3 | 7.64 |
| 29 | Iowa | 47.5 | 22.0% | 20.8% | -1.2 | 5.2% | 6.3% | 1.1 | 8.66 |
| 30 | Oregon | 46.6 | 13.8% | 10.3% | -3.6 | 7.7% | 7.5% | -0.2 | 7.78 |
| 31 | New Jersey | 44.9 | 18.7% | 16.7% | -2.1 | 10.4% | 8.8% | -1.6 | 9.18 |
| 31 | West Virginia | 44.9 | 17.6% | 13.1% | -4.5 | 6.7% | 12.2% | 5.5 | 4.85 |
| 33 | Kansas | 44.1 | 23.2% | 10.0% | -13.2 | 6.9% | 4.9% | -1.9 | 6.97 |
| 34 | Indiana | 42.4 | 22.4% | 24.8% | 2.4 | 6.8% | 11.6% | 4.8 | 8.87 |
| 35 | Arkansas | 39.8 | 11.8% | 21.7% | 9.9 | 8.2% | 16.1% | 7.9 | 9.71 |
| 36 | Montana | 36.4 | 24.5% | 23.2% | -1.3 | 8.5% | 11.2% | 2.7 | 10.02 |
| 37 | Florida | 33.9 | 23.6% | 21.5% | -2.0 | 14.1% | 14.2% | 0.1 | 16.58 |
| 38 | Kentucky | 33.1 | 21.4% | 9.6% | -11.8 | 8.4% | 9.4% | 0.9 | 7.99 |
| 38 | Missouri | 33.1 | 21.7% | 12.9% | -8.7 | 7.0% | 17.3% | 10.3 | 6.49 |
| 40 | Louisiana | 30.5 | 17.3% | 7.2% | -10.1 | 6.6% | 14.4% | 7.8 | 6.73 |
| 41 | Tennessee | 28.8 | 22.3% | 23.0% | 0.7 | 9.6% | 17.1% | 7.4 | 14.04 |
| 42 | Georgia | 25.4 | 22.6% | 8.7% | -13.9 | 10.9% | 7.7% | -3.2 | 14.83 |
| 43 | South Dakota | 23.7 | 21.0% | 17.4% | -3.5 | 7.5% | 11.9% | 4.4 | 14.42 |
| 44 | New Mexico | 22.0 | 21.3% | 7.7% | -13.6 | 10.9% | 15.7% | 4.9 | 7.84 |
| 45 | Nebraska | 17.8 | 23.7% | 9.3% | -14.4 | 6.0% | 7.6% | 1.6 | 12.00 |
| 46 | North Carolina | 12.7 | 22.3% | 11.4% | -11.0 | 10.8% | 13.0% | 2.2 | 19.11 |
| 47 | Arizona | 8.5 | 23.6% | 20.1% | -3.5 | 11.0% | 26.6% | 15.7 | 18.40 |
| 47 | Texas | 8.5 | 21.7% | 7.0% | -14.6 | 13.3% | 15.6% | 2.4 | 18.21 |
| 47 | Utah | 8.5 | 25.0% | 13.6% | -11.4 | 10.0% | 13.6% | 3.6 | 18.99 |
| 50 | Idaho | 0.0 | 23.8% | 14.4% | -9.4 | 11.6% | 23.7% | 12.1 | 21.62 |
5 tips for workers to succeed in the construction industry
While the construction industry continues to face its share of challenges, the demand for skilled workers and the expected growth of the sector mean there are ample opportunities for those looking to advance. Whether you’re just entering the field, looking to move up or want to ensure your long-term success, keep these tips in mind to build a rewarding career in construction.
- Know your value. “It can be strange and even uncomfortable to ask for more money, even when you know you’re in an in-demand field where wages are rising quickly,” Schulz says. “However, the more you know about the state of the industry nationally and, more importantly, in the area where you live, the more confident you can be in seeking higher wages.”
- Be willing to make bold moves. “Flexibility is enormously important when searching for any job, and construction is no exception,” Schulz says. “Of course, leaving your current location isn’t always wise or even possible; however, dismissing possibilities in other locations isn’t always the right move either. Sometimes, the right gig for the right pay in the right place with the right people appears, and you’d be wrong not to at least consider a change.”
- Commit to continuous learning. Stay competitive by constantly updating your knowledge and skills. This includes staying on top of new technology, tools and industry trends by reading professional journals and websites. Take advantage of training programs and certifications to improve your efficiency and productivity, too.
- Strengthen your soft skills. Technical know-how isn’t enough — communication, teamwork, time management and problem-solving are equally important on the job site. Developing these skills will enable you to work safely and effectively with diverse crews and clients.
- Build a strong network. “Now more than ever, your network is essential to your job search,” Schulz says. “Treat your connections like gold because they are some of the most valuable assets you have. Also, make the effort to expand your network. You never know where that new friendship might lead.”
Methodology
To identify the states where the construction industry is struggling most, researchers analyzed data across three key metrics:
- Relative wage growth: The difference between the percentage change in wages for construction workers and all workers from 2021 to 2024. U.S. Bureau of Labor Statistics (BLS) Occupational Employment and Wage Statistics (OEWS) Survey.
- Relative employment growth: The difference between the percentage change in employment for construction workers and all workers from 2021 to 2024. BLS OEWS Survey.
- New housing construction: The number of newly permitted housing units per 1,000 existing housing units. U.S. Census Bureau 2024 Building Permits Survey and Census Bureau 2023 American Community Survey with one-year estimates.
States were ranked on each metric. Final rankings were determined by averaging each state’s position across the three categories, with higher averages indicating more severe struggles in the construction industry.
Colorado wasn’t included because the BLS had data quality concerns.
View mortgage loan offers from up to 5 lenders in minutes