Portland, Ore., Has Worst Housing Crisis Outlook — Here’s Why


Buying a house feels increasingly out of reach for prospective first-time homebuyers. Depending on where you’re looking, purchasing a home — regardless of whether it’s for the first time — may become even more difficult.
According to a LendingTree study, Pacific Northwest metros have the worst housing crisis outlook, while Southern metros have the best.
Here’s what else we found.
Key findings
- Pacific Northwest metros have the worst housing crisis outlook. When analyzing vacancy rates, housing unit approvals, home value-to-income ratios and changes in those ratios, three of the five metros with the worst outlook are in the Pacific Northwest.
- Portland, Ore., ranks worst, largely due to its lack of available housing and unaffordability. Across the 100 largest U.S. metros, Portland has the fourth-lowest vacancy rate (4.76%) and 13th-highest home value-to-income ratio (5.57). Boise, Idaho, and Bridgeport, Conn., rank second and third overall.
- Southern metros have the best housing outlook. The metros with the best outlooks are led by McAllen, Texas, Wilmington, N.C., and Winston-Salem, N.C. These metros generally have the highest housing unit approval and vacancy rates.
- However, unaffordability in some Southern metros is climbing. Three of the five metros with the biggest increases in home value-to-income ratios are in the South. Durham, N.C. (8.60%), is highest, ahead of Charlotte, N.C. (7.20%), and Spokane, Wash. (7.17%).
- Florida metros have the highest vacancy rates, and high housing unit approvals may be why. Cape Coral, Fla., has a vacancy rate of 25.72% — the highest by metro. North Port, Fla. (21.23%), and Wilmington (21.16%) follow. Notably, these three are among the six metros with the highest rates of housing unit approvals.
Pacific Northwest metros have poor housing crisis outlook
Bad news for those in the Pacific Northwest: Some of their metros have the worst housing crisis outlook.
We analyzed vacancy rates, housing unit approvals, home value-to-income ratios and the change in value-to-income ratios across the 100 largest U.S. metros. In doing so, we found that three of the five metros with the worst outlook are in the Pacific Northwest.
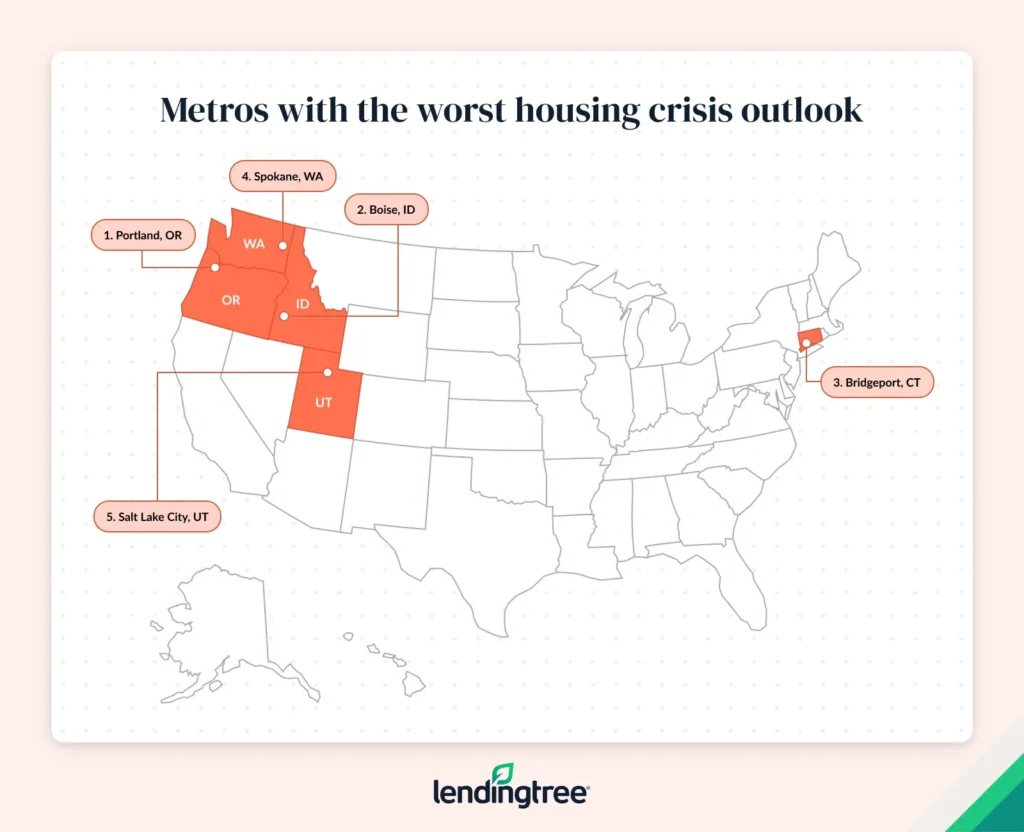
Portland, Ore., ranks as the worst. Most notably, Portland has the fourth-lowest vacancy rate in the nation at just 4.76%. (While low vacancy rates can indicate strong demand, they can lead to a tighter housing market with higher home prices.) It also has the 13th-highest home value-to-income ratio, at 5.57. (This means median home values are 5.57 times more than the median income; the higher the ratio, the higher the unaffordability.) The median home value in Portland is $526,500, while the median household income is $94,573.
Boise, Idaho, follows, with the second-lowest vacancy rate (4.56%). It has also seen the fourth-largest growth in its home value-to-income ratio, jumping 7.12% from 2022 to 2023. (A widening gap speaks to growing unaffordability.) Bridgeport, Conn., rounds out the top three overall.
Matt Schulz — LendingTree chief consumer finance analyst and author of “Ask Questions, Save Money, Make More: How to Take Control of Your Financial Life” — says one of the biggest problems is that there aren’t enough homes available in the Pacific Northwest.
“The vacancy rates in Portland and Boise are less than half of those in many other big metros,” he says. “When that happens, prices rise, making things even more expensive. Unfortunately, this isn’t likely to change in many of the most troubled metros because the data shows that insufficient building is being done. That’s not the case in Boise, where new permits are among the highest in the nation, but it’s the case in Portland, Bridgeport and other metros with similar rankings. That doesn’t bode well for the near future.”
Southern metros have best outlook
Conversely, Southern metros account for all five with the best outlook. McAllen, Texas, leads, with the lowest home value-to-income ratio at just 2.37. The median home value is $124,000, while the median household income is $52,281. It also has the eighth-highest housing unit approvals, at 24.42 per 1,000 units. (A high rate can indicate a strong real estate market — and a healthy outlook.)
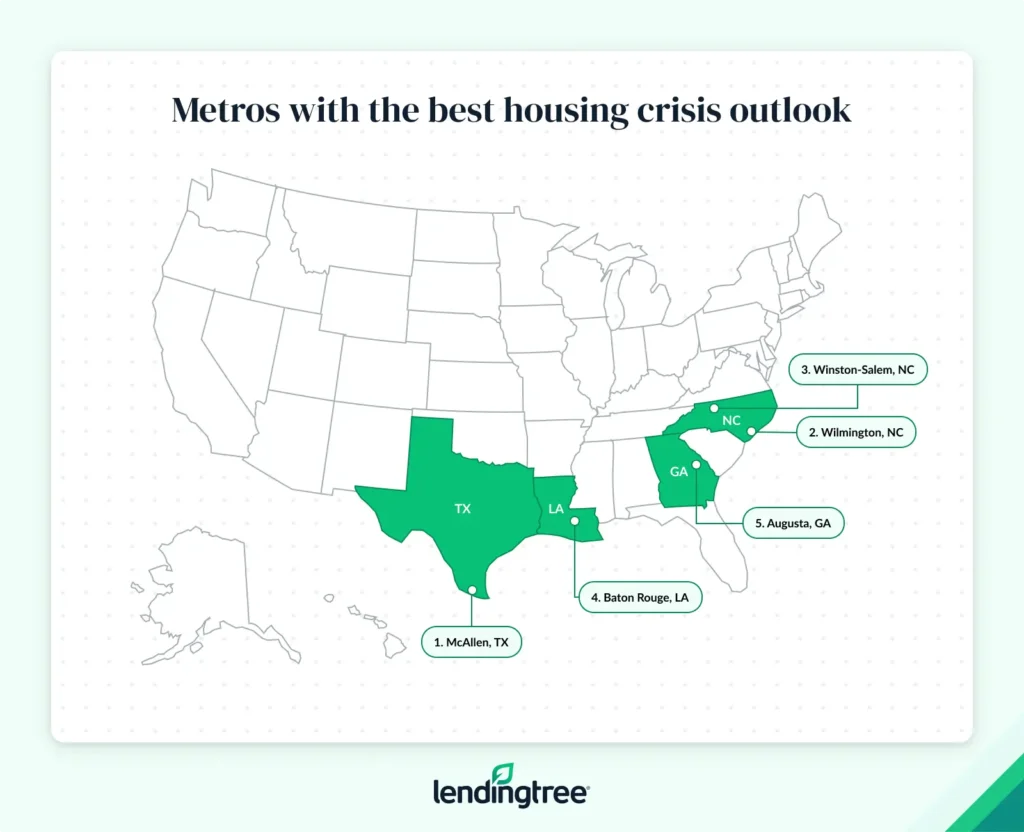
Wilmington, N.C., follows. It has the highest housing unit approvals, at 39.78 per 1,000 units. It also has the third-highest vacancy rate (21.16%). Wilmington home values have also stayed somewhat steady relative to income, as it has the ninth-lowest change in its home value-to-income ratio, growing just 1.51% between 2022 and 2023.
Fellow North Carolina metro Winston-Salem ranks third.
Beyond vacancies and housing unit approvals, Schulz says there are a few reasons Southern metros may have the best outlook.
“Many of these are relatively low-income areas,” he says. “Plus, Southern metros don’t tend to be as densely packed, especially compared to their Northeastern counterparts, meaning there’s more room to build and grow. More available property tends to mean lower costs.”
Full rankings: Metros with the worst/best housing outlooks
| Rank | Metro | Vacancy rate | Housing unit approvals per 1,000 | Home value-to-income ratio | Change in ratio, 2022-23 |
|---|---|---|---|---|---|
| 1 | Portland, OR | 4.76% | 8.69 | 5.57 | 3.87% |
| 2 | Boise, ID | 4.56% | 29.37 | 5.25 | 7.12% |
| 3 | Bridgeport, CT | 6.70% | 5.33 | 4.75 | 3.98% |
| 4 | Spokane, WA | 6.33% | 15.75 | 5.02 | 7.17% |
| 5 | Salt Lake City, UT | 5.31% | 12.57 | 5.03 | 4.58% |
| 6 | Denver, CO | 5.29% | 12.53 | 5.57 | 4.09% |
| 7 | Washington, DC | 5.36% | 8.83 | 4.46 | 4.18% |
| 8 | New Haven, CT | 7.88% | 4.28 | 3.81 | 6.31% |
| 9 | Worcester, MA | 5.70% | 6.49 | 4.18 | 4.23% |
| 10 | Colorado Springs, CO | 5.11% | 13.07 | 4.95 | 4.25% |
| 11 | San Diego, CA | 6.51% | 9.48 | 7.74 | 3.49% |
| 12 | Los Angeles, CA | 6.25% | 5.60 | 8.82 | 1.85% |
| 13 | Oxnard, CA | 5.64% | 5.97 | 7.16 | 1.69% |
| 14 | Boston, MA | 5.90% | 5.55 | 5.43 | 2.06% |
| 15 | San Jose, CA | 5.66% | 5.76 | 8.53 | 0.89% |
| 16 | San Francisco, CA | 7.03% | 3.12 | 8.33 | 0.31% |
| 17 | Austin, TX | 5.26% | 32.26 | 4.45 | 5.99% |
| 18 | Buffalo, NY | 7.42% | 2.61 | 2.97 | 5.23% |
| 19 | Durham, NC | 8.06% | 14.54 | 4.44 | 8.60% |
| 20 | Sacramento, CA | 7.36% | 12.18 | 5.95 | 3.75% |
| 21 | Seattle, WA | 5.69% | 10.55 | 5.98 | 2.03% |
| 22 | Philadelphia, PA | 6.23% | 5.22 | 3.66 | 2.69% |
| 23 | Grand Rapids, MI | 5.87% | 8.69 | 3.26 | 4.43% |
| 24 | Atlanta, GA | 7.37% | 16.53 | 3.88 | 6.97% |
| 25 | Providence, RI | 8.19% | 3.35 | 4.51 | 2.06% |
| 26 | Hartford, CT | 7.09% | 4.31 | 3.33 | 3.12% |
| 27 | Bakersfield, CA | 7.58% | 10.65 | 4.59 | 3.70% |
| 28 | New York, NY | 7.88% | 7.33 | 6.03 | 2.06% |
| 29 | Tucson, AZ | 9.34% | 11.08 | 4.22 | 5.18% |
| 30 | Charlotte, NC | 7.91% | 22.77 | 3.98 | 7.20% |
| 31 | Cincinnati, OH | 6.50% | 7.34 | 3.02 | 4.30% |
| 32 | Virginia Beach, VA | 7.56% | 6.48 | 3.95 | 2.86% |
| 33 | Fresno, CA | 6.55% | 9.61 | 5.05 | 1.23% |
| 34 | Honolulu, HI | 9.47% | 4.40 | 8.37 | 0.43% |
| 35 | Richmond, VA | 6.69% | 15.36 | 3.86 | 4.37% |
| 36 | Minneapolis, MN | 4.68% | 9.69 | 3.61 | 2.26% |
| 37 | Jackson, MS | 12.64% | 4.16 | 3.12 | 6.09% |
| 38 | Dallas, TX | 6.76% | 23.81 | 3.79 | 5.71% |
| 39 | Miami, FL | 13.19% | 6.06 | 5.52 | 3.20% |
| 40 | Nashville, TN | 7.58% | 22.88 | 4.57 | 4.70% |
| 41 | Memphis, TN | 10.21% | 7.29 | 3.52 | 5.57% |
| 42 | Albuquerque, NM | 6.71% | 7.27 | 3.88 | 2.19% |
| 43 | Allentown, PA | 6.43% | 5.95 | 3.36 | 2.45% |
| 44 | Scranton, PA | 11.86% | 2.40 | 2.77 | 5.68% |
| 45 | Columbus, OH | 6.57% | 14.77 | 3.44 | 4.51% |
| 46 | Rochester, NY | 7.44% | 3.82 | 2.55 | 3.94% |
| 47 | Madison, WI | 4.39% | 19.00 | 3.97 | 2.71% |
| 48 | Phoenix, AZ | 8.68% | 22.41 | 4.74 | 5.05% |
| 49 | Stockton, CA | 6.02% | 14.71 | 5.59 | 0.15% |
| 50 | Milwaukee, WI | 6.54% | 5.65 | 3.71 | 1.39% |
| 51 | Dayton, OH | 7.87% | 5.47 | 2.67 | 4.61% |
| 52 | Tampa, FL | 12.65% | 14.07 | 4.30 | 5.74% |
| 53 | Baltimore, MD | 7.34% | 5.23 | 3.84 | 0.97% |
| 54 | New Orleans, LA | 14.35% | 3.51 | 3.98 | 3.01% |
| 55 | Chattanooga, TN | 9.57% | 14.31 | 3.58 | 6.48% |
| 56 | Riverside, CA | 10.53% | 9.17 | 5.74 | 2.78% |
| 57 | Akron, OH | 7.61% | 4.12 | 2.79 | 3.10% |
| 58 | San Antonio, TX | 8.51% | 14.24 | 3.48 | 5.11% |
| 59 | Kansas City, MO | 7.17% | 9.82 | 3.24 | 3.80% |
| 60 | Chicago, IL | 6.97% | 4.51 | 3.40 | 0.25% |
| 61 | Harrisburg, PA | 5.57% | 6.60 | 3.02 | 1.63% |
| 62 | Raleigh, NC | 7.61% | 31.58 | 3.97 | 4.76% |
| 63 | Kiryas Joel, NY | 6.86% | 8.73 | 3.76 | 1.84% |
| 64 | Portland, ME | 16.89% | 10.49 | 4.28 | 4.43% |
| 65 | Knoxville, TN | 10.04% | 16.97 | 3.66 | 5.87% |
| 66 | Detroit, MI | 8.33% | 3.89 | 3.16 | 2.18% |
| 67 | Oklahoma City, OK | 8.54% | 11.20 | 3.05 | 5.17% |
| 68 | Las Vegas, NV | 9.46% | 15.76 | 5.43 | 2.89% |
| 69 | Indianapolis, IN | 7.77% | 13.23 | 3.17 | 4.32% |
| 70 | Louisville, KY | 7.92% | 9.65 | 3.30 | 3.38% |
| 71 | Cleveland, OH | 8.78% | 3.77 | 2.93 | 2.77% |
| 72 | Tulsa, OK | 9.69% | 9.72 | 3.01 | 5.23% |
| 73 | Greenville, SC | 9.20% | 21.54 | 3.52 | 5.33% |
| 74 | Houston, TX | 8.37% | 23.20 | 3.42 | 5.28% |
| 75 | Omaha, NE | 5.65% | 17.71 | 2.99 | 3.69% |
| 76 | Jacksonville, FL | 9.94% | 21.02 | 4.01 | 4.48% |
| 77 | Cape Coral, FL | 25.72% | 35.82 | 4.46 | 6.44% |
| 78 | North Port, FL | 21.23% | 31.46 | 4.70 | 5.27% |
| 79 | Columbia, SC | 10.39% | 15.72 | 3.23 | 6.32% |
| 80 | Deltona, FL | 14.47% | 17.81 | 4.25 | 5.02% |
| 81 | Toledo, OH | 8.19% | 3.38 | 2.64 | 2.11% |
| 82 | Des Moines, IA | 6.24% | 16.38 | 3.00 | 3.09% |
| 83 | Orlando, FL | 12.08% | 21.10 | 4.48 | 3.97% |
| 84 | Wichita, KS | 9.17% | 10.83 | 2.73 | 4.93% |
| 85 | El Paso, TX | 7.69% | 6.82 | 2.84 | 2.47% |
| 86 | Lakeland, FL | 16.11% | 31.49 | 3.77 | 6.47% |
| 87 | Greensboro, NC | 8.85% | 14.55 | 3.29 | 3.83% |
| 88 | Pittsburgh, PA | 9.41% | 4.68 | 2.77 | 2.47% |
| 89 | St. Louis, MO | 8.88% | 5.28 | 2.97 | 2.04% |
| 90 | Albany, NY | 10.12% | 5.72 | 3.12 | 2.30% |
| 91 | Little Rock, AR | 10.07% | 7.42 | 3.05 | 2.98% |
| 92 | Birmingham, AL | 11.87% | 7.17 | 3.25 | 2.67% |
| 93 | Syracuse, NY | 9.90% | 3.11 | 2.38 | 1.61% |
| 94 | Palm Bay, FL | 14.46% | 15.63 | 4.01 | 2.98% |
| 95 | Charleston, SC | 11.57% | 23.06 | 4.20 | 2.49% |
| 96 | Augusta, GA | 15.90% | 17.36 | 3.11 | 4.89% |
| 97 | Baton Rouge, LA | 14.25% | 10.72 | 3.37 | 2.49% |
| 98 | Winston-Salem, NC | 10.13% | 18.07 | 3.32 | 2.98% |
| 99 | Wilmington, NC | 21.16% | 39.78 | 4.45 | 1.51% |
| 100 | McAllen, TX | 12.59% | 24.42 | 2.37 | 3.90% |
Unaffordability climbing in South
While the South may have some hidden gems for homebuyers, unaffordability in some of its metros is climbing.
In fact, three of the five metros with the biggest increases in home value-to-income ratios are in the South. Durham, N.C., leads, with that ratio rising 8.60% between 2022 and 2023, to 4.44. In Durham, the median household income is $81,017 and the median home value is $359,400.
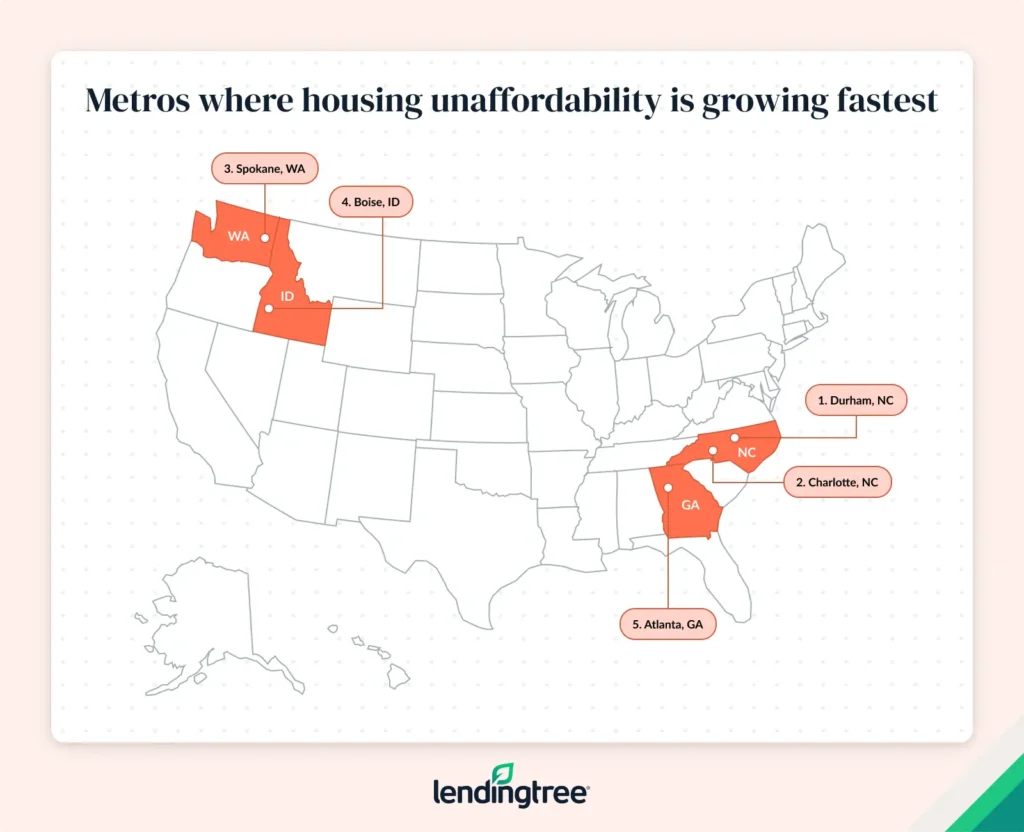
Charlotte, N.C. (7.20%), and Spokane, Wash. (7.17%), saw the next highest increases. Their home value-to-income ratios are 3.98 and 5.02, respectively.
Schulz believes this is a price metros pay for rapid growth.
“Virtually all of the areas with the biggest increases are growing in a big way,” he says. “When people move into an area in droves, they can drive up housing values. They also tend to drive up incomes, though those may not rise quite as rapidly as housing values. I think that gap may continue to widen.”
Vacancy rates highest in Florida
Notably, Florida metros have the highest vacancy rates. Cape Coral, Fla., has the highest vacancy rate, at 25.72%. North Port, Fla. (21.23%), and Wilmington, N.C. (21.16%), rank second and third, respectively.
Metros with highest vacancy rates
| Rank | Metro | Vacancy rate |
|---|---|---|
| 1 | Cape Coral, FL | 25.72% |
| 2 | North Port, FL | 21.23% |
| 3 | Wilmington, NC | 21.16% |
| 4 | Portland, ME | 16.89% |
| 5 | Lakeland, FL | 16.11% |
High housing unit approvals may play a role here. Wilmington (39.78) ranks first, Cape Coral (35.82) ranks second and North Port (31.46) ranks sixth.
That can certainly be a good thing for bargain hunters, Schulz says.
“High vacancy rates and lots of new buildings means lower prices, and those are always welcome,” he says. “However, too much vacancy for too long isn’t great for those looking to build wealth. It can put a ceiling on the growth you can expect, simply because prices tend to stay lower when there’s too much supply. It doesn’t mean they won’t grow at all. It just means those looking for more rapid growth in housing values might end up disappointed.”
Buying a home amid housing difficulties: Top expert tips
Buying a home amid a worsening crisis can be daunting, but it’s not impossible. Schulz offers the following advice:
- Shop around. “Don’t fall in love with the first property you see, or at least don’t stop looking once you do,” he says. “Don’t settle for the first mortgage loan offer you’re given. Don’t restrict yourself to a single area unless you have to. Even in the most challenging housing markets, there are gems to uncover and deals to be made. If you don’t let yourself look for them, you’ll never find them.”
- Get your credit in order. “There’s little in life that’s more expensive than a crummy credit score,” he says. “That’s especially true with mortgages. Lower credit scores mean higher interest rates, and higher interest rates can cost you tens of thousands of dollars or more over the life of a loan.”
- Build a strong emergency fund. Owning a home comes with a lot of unexpected expenses, like repairs, maintenance and rising property taxes. Having a financial cushion can help you handle these surprises without going into debt.
Methodology
To determine where the housing crisis will worsen, LendingTree researchers looked at four metrics across the 100 largest U.S. metros. Specifically, researchers looked at:
- Vacancy rates: The percentage of housing units that are unoccupied. U.S. Census Bureau 2023 American Community Survey with five-year estimates.
- Housing unit approvals per 1,000 housing units: The number of newly approved housing units compared to the number of homes in the metro. U.S. Census Bureau 2023 American Community Survey with five-year estimates and U.S. Census Bureau 2024 Building Permits Survey.
- Home value-to-income ratio: The median home value divided by the median household income. U.S. Census Bureau 2023 American Community Survey with five-year estimates.
- Change in home value-to-income ratio: The percentage by which the gap between median home values and median household incomes has widened or narrowed from 2022 to 2023. U.S. Census Bureau 2023 and 2022 American Community Surveys with five-year estimates.
The metros were ranked in the individual metrics, and their average ranking was used to calculate a final score.
View mortgage loan offers from up to 5 lenders in minutes
Recommended Articles