5.6 Million Homes Are Vacant in Nation’s Largest Metros — Here’s Where Vacancy Rates Are Highest, Lowest
The U.S. is experiencing a housing shortage. Though it’s not present everywhere, a lack of housing supply is one of the main drivers behind today’s high housing costs.
Despite this, many homes across the U.S. sit vacant — at least temporarily. There are just over 5.6 million vacant housing units across the nation’s 50 largest metropolitan areas.
This doesn’t mean millions of abandoned and dilapidated homes are lining metro streets. Vacant homes can be — and usually are — unoccupied for many reasons beyond being uninhabitable. For example, a house can be considered vacant even if it’s only empty for a relatively short time, like if it’s on the market to be sold or rented or a vacation home not being used.
LendingTree analyzed the latest U.S. Census Bureau American Community Survey data to rank the nation’s 50 largest metros by their shares of unoccupied homes. We also looked at the reasons why, because an area’s vacancy rate can be an important part of understanding the overall health and character of its housing market.
While vacancy rates can vary significantly, tens of thousands of housing units are vacant in each metro featured in our study.
Key findings
- Just over 5.6 million housing units are vacant across the nation’s 50 largest metros. The vacancy rate in 2023 across these 50 metros was 7.37%, up slightly from 7.22% in 2022.
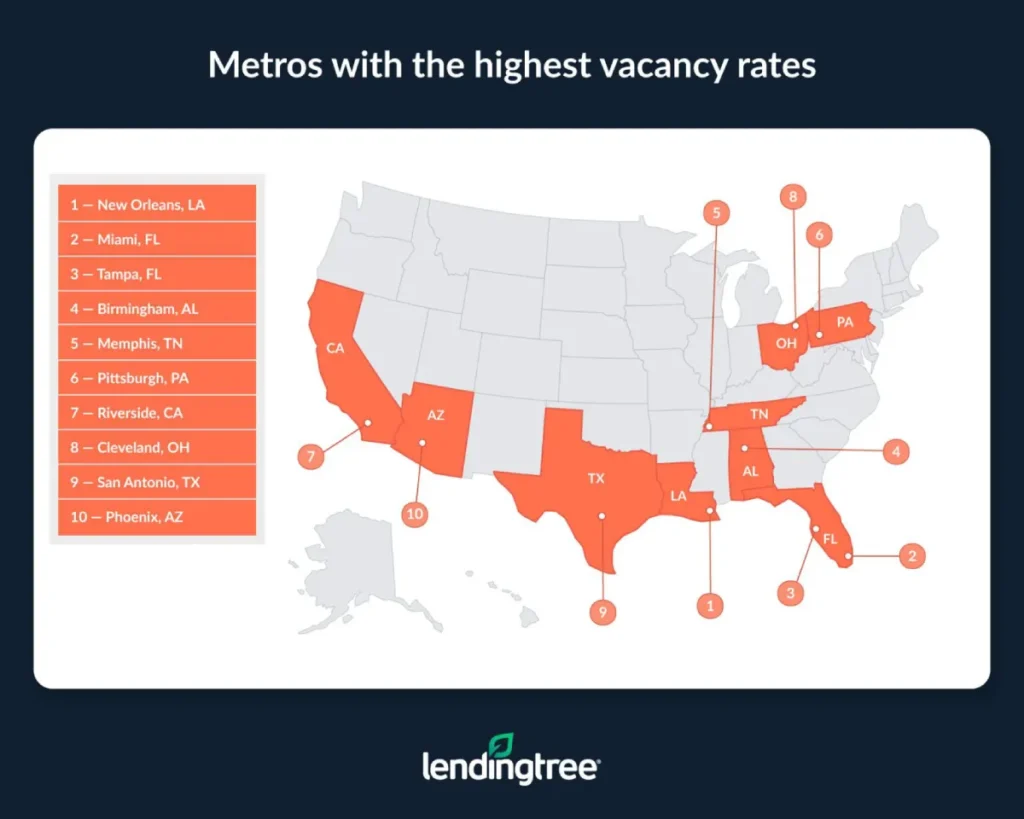
- New Orleans, Miami and Tampa, Fla., have the highest vacancy rates. The vacancy rates in these metros are 14.50%. 12.92% and 11.81%, respectively. In these three metros, just shy of 600,000 housing units were vacant in 2023. Compared to 2022, vacancy rates rose in New Orleans and Miami from 13.88% and 12.65% but fell in Tampa from 12.15%.
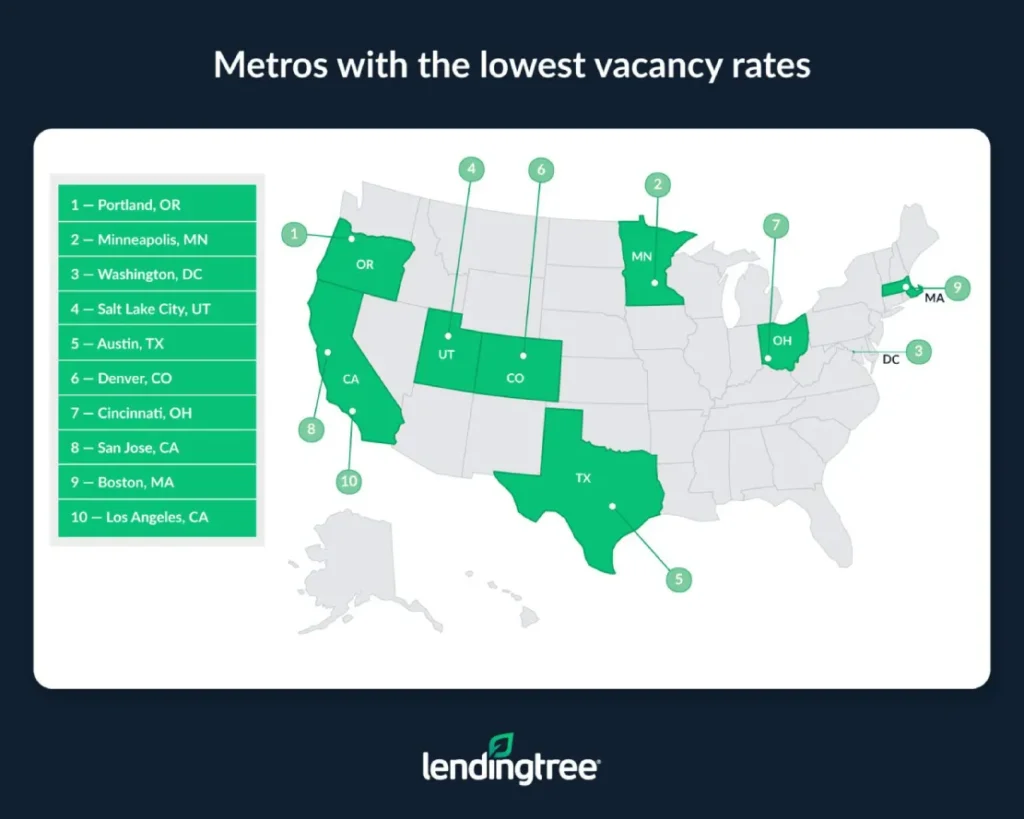
- Vacancy rates are lowest in Portland, Ore. (4.54%), Minneapolis (4.66%) and Washington, D.C. (4.85%). Only two others in our study — Salt Lake City (4.88%) and Austin, Texas (4.96%) — have vacancy rates below 5.00%.
- Nearly half of all vacant units in the nation’s 50 largest metros sit empty because they’re waiting to be rented or they’re only used part of the year. 27.90% of the vacant housing units featured in this study are vacant because they’re for rent, while 20.73% are only occupied part time for seasonal, recreational or occasional uses.
Metros with the highest vacancy rates
No. 1: New Orleans
- Total housing units: 466,902
- Vacant housing units: 67,704
- Vacancy rate: 14.50%
- Most common reason for vacancy: Housing unit is for rent
- Share of vacant housing units empty for most common vacancy reason: 23.49%
- Median home value: $263,500
- Median gross rent: $1,159
No. 2: Miami
- Total housing units: 2,698,630
- Vacant housing units: 348,710
- Vacancy rate: 12.92%
- Most common reason for vacancy: Housing unit is for seasonal, recreational or occasional use
- Share of vacant housing units empty for most common vacancy reason: 50.44%
- Median home value: $474,000
- Median gross rent: $1,914
No. 3: Tampa, Fla.
- Total housing units: 1,540,717
- Vacant housing units: 181,929
- Vacancy rate: 11.81%
- Most common reason for vacancy: Housing unit is for seasonal, recreational or occasional use
- Share of vacant housing units empty for most common vacancy reason: 45.18%
- Median home value: $372,100
- Median gross rent: $1,729
Metros with the lowest vacancy rates
No. 1: Portland, Ore.
- Total housing units: 1,077,557
- Vacant housing units: 48,906
- Vacancy rate: 4.54%
- Most common reason for vacancy: Housing unit is for rent
- Share of vacant housing units empty for most common vacancy reason: 42.38%
- Median home value: $560,900
- Median gross rent: $1,670
No. 2: Minneapolis
- Total housing units: 1,574,923
- Vacant housing units: 73,470
- Vacancy rate: 4.66%
- Most common reason for vacancy: Housing unit is for rent
- Share of vacant housing units empty for most common vacancy reason: 33.91%
- Median home value: $369,500
- Median gross rent: $1,427
No. 3: Washington, D.C.
- Total housing units: 2,532,369
- Vacant housing units: 122,794
- Vacancy rate: 4.85%
- Most common reason for vacancy: Housing unit is for rent
- Share of vacant housing units empty for most common vacancy reason: 32.79%
- Median home value: $574,000
- Median gross rent: $1,945
If so many homes are vacant, why are housing prices still so high?
In a simplified version of the housing market, vacancy rates would likely have a strong inverse relationship to home and rent prices. High vacancy rates should signify a lack of demand from buyers and/or renters, resulting in a larger supply of homes on the market and lower prices. The inverse would also be true and low vacancy rates would signify strong demand, less supply and higher prices.
With home prices as high as they are, it may seem strange that so many homes in the nation’s largest metros are sitting empty.
However, as is often the case when economic theory unfolds, this simplified theoretical framework doesn’t always hold. More nuanced factors are in play that help dictate prices, like location, the kind of mortgage rates offered to borrowers, square footage, the reasons why homes are unoccupied and how long homes sit empty. Why a home is empty is just as important as the fact that it’s empty, if not more. Only by analyzing the reasons behind a vacancy can you understand the relationship between housing prices and vacancy rates.
While an area’s overall vacancy rate isn’t nuanced enough to fully explain why homes are so expensive, that doesn’t mean an area’s vacancy rate can’t help shed light on how an area’s housing market is fairing.
For example, if both vacancy rates and prices are relatively low, it could mean sellers are parting with their homes for less money than they potentially could have received. If vacancy rates are low and housing prices are high, it could signify the market is highly competitive and that lower-income consumers might have a problem finding a house.
Conversely, high vacancy rates and home prices can suggest that an area has unique characteristics, such as being a vacation hot spot or targeted by investors who don’t live year-round in the area. Meanwhile, high vacancy rates and low home prices might mean an area is experiencing socioeconomic hardships.
Tips for dealing with an expensive housing market
Though mortgage rates are falling, persistently steep prices and a limited number of homes available for sale can make it tricky for buyers to navigate today’s housing market. By following these tips, homebuyers may find dealing with the market less daunting than expected.
- Shop around for the best possible rate. By shopping around and making different lenders compete for your business before getting a mortgage, you may be able to secure a lower interest rate than if you chose the first lender. The lower your rate, the less money you’ll need to spend on monthly housing costs and the more expensive a home you’ll be able to afford. Shopping around can be an especially effective strategy in a high-rate market like today’s.
- Consider different loan options. Not all loans have the same mortgage requirements. If you’re worried you won’t qualify for a traditional 30-year, fixed-rate mortgage, you may still find that you can get approved for loans from the Federal Housing Administration (FHA) or the Department of Veterans Affairs (VA).
- Get preapproved for your mortgage. If you’re ready to start house hunting, getting preapproved for a mortgage could help you move quickly through the homebuying process once you’ve found a house. On top of that, a preapproval will give you a more concrete sense of what you can afford.
Methodology
Data for this study comes from the U.S. Census Bureau 2023 American Community Survey with one-year estimates (the latest available).
This study measures the overall vacancy rate in a metro by dividing the number of vacant households by the total number of households.
Occupied households include homes owned or rented by occupants who use the home as their primary residence, while vacant households are broken down into the following subcategories:
- For rent: Vacant units offered “for rent” or either “for rent” or “for sale.”
- Rented, not occupied: Vacant units rented but not yet occupied. Money could have been paid or agreed upon without the unit being occupied yet.
- For sale only: Vacant units offered “for sale only,” including units in cooperatives and condo projects.
- Sold, not occupied: Vacant units sold but not yet occupied. Sale could have been completed without the home being occupied yet.
- For seasonal, recreational or occasional use: Vacant units used or intended for certain seasons, weekends or other occasional uses. Seasonal units can include beach cottages, hunting cabins and quarters for workers as herders and loggers. This also includes interval ownership units, sometimes referenced as shared ownership or timeshares.
- For migrant workers: Vacant units intended for occupancy by migrant workers employed in crop-season farmwork.
- Foreclosure: Vacant units because owners’ payments weren’t being made. Includes units under foreclosure, up for auction, repossessed or similar scenarios.
- Personal/family reasons: Vacant units because of the owners’ preferences and/or personal situations. Includes units where the owner doesn’t want to rent or sell, is still deciding what to do, is keeping for family usage or other similar scenarios.
- Legal proceedings: Vacant units due to legal issues or disputes, such as estate settlements, divorce or eviction proceedings. Could also involve code violations.
- Preparing to rent/sell: Vacant units because the owner is preparing to rent or sell. Owner could be meeting soon with the listing agent to prepare to put the unit on the market.
- Held for household furniture storage: Vacant units because they’re storing excess household furniture or other household items.
- Needs repairs: Vacant units in need of repairs, including renovations or cleaning, that aren’t actively being repaired.
- Currently being repaired/renovated: Vacant units needing repairs that are undergoing work.
- Specific-use housing: Vacant units only used by a specific group of people at one or various times throughout the year, such as military housing, transient quarters or student housing.
- Extended absence: Vacant units intended for year-round occupancy but vacant for six months or more.
- Abandoned/possibly to be demolished/possibly condemned: Vacant units that are abandoned or are to be demolished or condemned.
- Other: Vacant units for reasons that don’t fit the above categories.
Due to data limitations, a full breakdown of vacancy reasons isn’t available for the Salt Lake City metro.
View mortgage loan offers from up to 5 lenders in minutes