Old But Not Forgotten: LendingTree Finds Metros With the Largest Share of Old Homes in America
Old houses can possess a certain charm that’s difficult to replicate with newer construction. Because of this, some homebuyers seek out old homes to make their own, despite the drawbacks associated with owning an aging property.
To determine where old homes are most common, a new study from LendingTree used Census data to analyze the share of old homes (define as housing units built in or before 1939) in each of the nation’s 50 largest metropolitan areas.
What LendingTree’s study found was that not only are old homes much more common in some metros than they are in others, but their values can vary significantly relative to the value of all homes in a given area.
Key findings
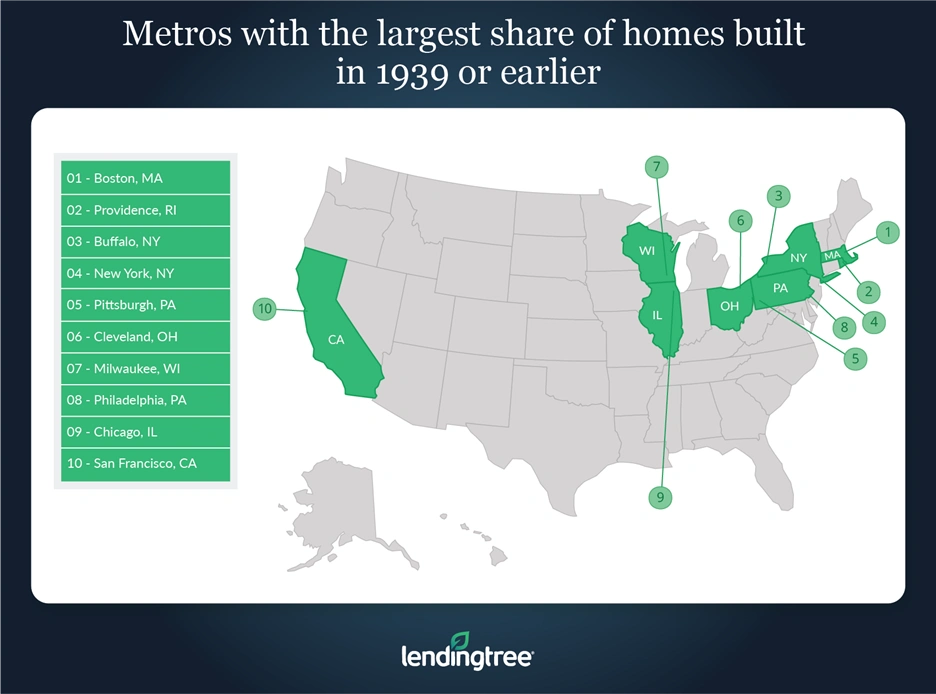
- Boston, Providence, R.I., and Buffalo, N.Y., are the metros with the largest share of homes built in or before 1939. An average of nearly 32% of homes in these areas were built in that time period, compared to an average of 11.3% across the entire country.
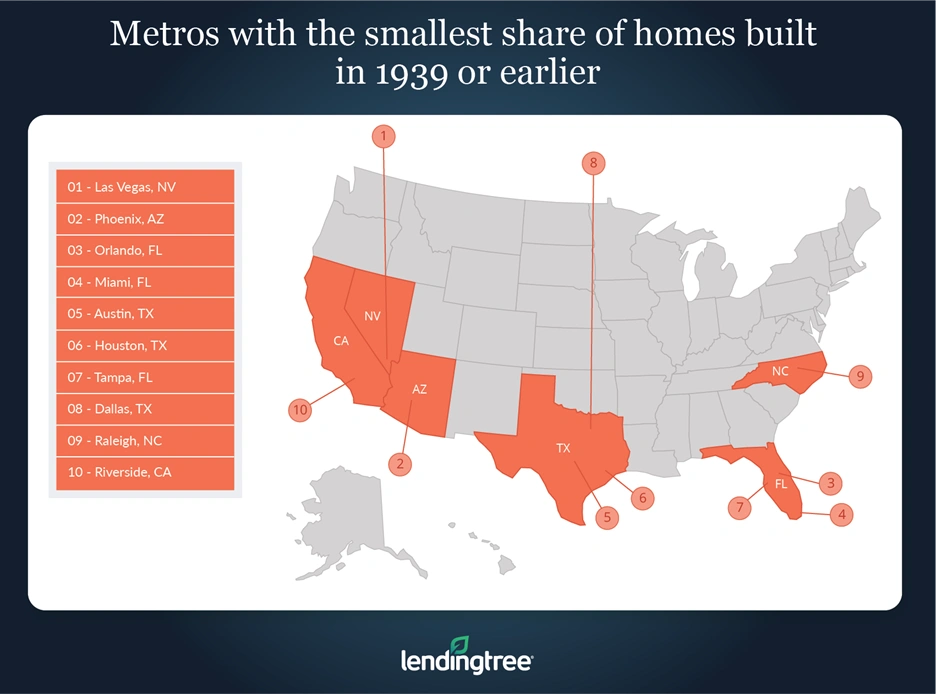
- On the flip side, Las Vegas, Phoenix and Orlando, Fla., are the metros with the smallest share of old housing units. In these metros, an average of only 0.94% of homes were built in or before 1939.
- While there are exceptions like San Francisco, metros with warmer climates usually have fewer old homes. Because they were built in an era before amenities like air conditioners were widespread, older houses tend to fare worse in the heat than newer ones do and, as a result, are less common in hot parts of the country.
- The median value of homes built in 1939 or earlier varies significantly across the country. For example, in Washington, D.C., the median value of homes built in or before 1939 is $630,000, more than $200,000 higher than the median value of all homes in the area. In Kansas City, Mo., however, the median value of homes built in the same time period is only $112,400, which is nearly $71,000 cheaper than the median value of all homes in the area.
Metros with the largest share of homes built in 1939 or earlier
1. Boston
- Total housing units: 1,958,465
- Percentage of housing units built in 1939 or earlier: 33.19%
- Median value – all housing units: $437,500
- Median value – housing units built in 1939 or earlier: $469,000
- Difference between median value of all housing units and of units built in 1939 or earlier: –$31,500
2. Providence, R.I.
- Total housing units: 703,610
- Percentage of housing units built in 1939 or earlier: 31.38%
- Median value – all housing units: $276,900
- Median value – housing units built in 1939 or earlier: $241,700
- Difference between median value of all housing units and of units built in 1939 or earlier: $35,200
3. Buffalo, N.Y.
- Total housing units: 528,735
- Percentage of housing units built in 1939 or earlier: 31.33%
- Median value – all housing units: $148,500
- Median value – housing units built in 1939 or earlier: $115,000
- Difference between median value of all housing units and of units built in 1939 or earlier: $33,500
Metros with the smallest share of homes built in 1939 or earlier
1. Las Vegas
- Total housing units: 899,870
- Percentage of housing units built in 1939 or earlier: 0.39%
- Median value – all housing units: $262,700
- Median value – housing units built in 1939 or earlier: $207,600
- Difference between median value of all housing units and of units built in 1939 or earlier: $55,100
2. Phoenix
- Total housing units: 1,915,023
- Percentage of housing units built in 1939 or earlier: 0.91%
- Median value – all housing units: $250,000
- Median value – housing units built in 1939 or earlier: $213,800
- Difference between median value of all housing units and of units built in 1939 or earlier: $36,200
3. Orlando, Fla.
- Total housing units: 1,032,603
- Percentage of housing units built in 1939 or earlier: 1.53%
- Median value – all housing units: $221,600
- Median value – housing units built 1939 or earlier: $260,000
- Difference between median value of all housing units and of units built in 1939 or earlier: $38,400
What to consider before buying an old home
If you’re thinking about buying an older home, consider the following factors before making a purchase:
- Take into account extra costs associated with a home’s age. Older homes often require more extensive remodeling and maintenance than newer homes. As a result, it’s important to have the funds necessary to keep things like electrical wiring up to date. Once you’ve lived in your house for a while and built some equity in it, you can consider using a home equity loan to pay for major projects like updating your kitchen or bathroom.
- Make sure you have the right insurance. Because old homes can be costly to repair and more prone to damage, you’ll want to make sure your homeowners insurance will cover you in the event that something happens. Keep in mind that you might need to shell out higher premiums than you would if you owned a newer house, depending on what shape your home is in.
- Shop around for a mortgage before buying. Mortgage shopping can increase your chances of finding a lender who will offer you the best rate and terms. Lower rates can result in lower monthly costs, which can free up extra money for things like maintenance and repairs. That extra money is often especially handy in old homes where surprise costs can commonly occur.
Methodology
LendingTree used data from the U.S. Census Bureau’s 2019 American Community Survey with five-year estimates (the latest ACS available at the time of writing) to conduct this study.
“Old” homes were defined as housing units built in or before 1939 because that was the oldest data available from the ACS.
All data is aggregated on the metropolitan statistical area (MSA) level.
LendingTree senior research analyst Jacob Channel contributed to this report.
View mortgage loan offers from up to 5 lenders in minutes