Workers Lose an Average of $9,470 a Year Commuting — Here’s Where Commutes Are Costliest


It’s one thing to give a job your time. It’s another to give it your mornings, your evenings and a chunk of your paycheck when you’ve not clocked in.
Workers across the U.S. lose an estimated $9,470 a year on average to commuting, according to a LendingTree analysis. Here’s a closer look at where those costs are highest and lowest.
Key findings
- U.S. workers lose an estimated $9,470 a year on average to commuting. With the average commute time 26.8 minutes each way (or 53.6 minutes combined), LendingTree used earnings and time worked data to estimate that commutes translate to $37.73 a day in lost time, or $9,470 a year.
- Bridgeport, Conn., has the most expensive commute. On average, commuters in Bridgeport spend 64.4 minutes traveling to and from work each day. That’s equivalent to $73.59 a day or $18,472 a year in lost time — the highest across the 100 largest metros.
- Bay Area metros have similarly expensive commutes. San Francisco commuters lose an average of 63.4 minutes in travel time, which translates to $72.41 a day or $18,175 a year. San Jose, Calif., follows, with commuters spending an average of 55.2 minutes on the road. That’s $71.10 a day or $17,845 a year.
- Commutes are most manageable in McAllen, Texas. The average round-trip commute in McAllen is 44.6 minutes. That’s $20.54 a day or $5,155 a year. Wichita, Kan., follows, with a commute of 40.6 minutes, losing $22.85 a day or $5,735 a year. El Paso, Texas, rounds out the bottom, with a commute of 49.0 minutes, losing $23.26 a day or $5,837 a year.
- Across all commuters in a metro, New York has the highest total commute costs. With an estimated 8.3 million commuters, the total annual cost of lost time due to commuting is an astounding $138.8 billion a year — significantly higher than the next metro, Los Angeles, at $64.0 billion. Chicago ranks third at $47.8 billion.
Using data from the U.S. Census Bureau 2023 American Community Survey (ACS) with one-year estimates — the latest available — researchers first compiled average commute times in the 100 largest metros.
Then, using Census Bureau data on average earnings for full-time, year-round workers, analysts estimated average hourly earnings in these metros by dividing average earnings by the estimated annual hours worked by employees (which doesn’t differentiate by employee status) ages 18 to 64 in that metro.
Finally, researchers multiplied the estimated average hourly earnings by the time spent commuting to calculate the opportunity cost of commuting. Researchers assumed 251 working days in 2024, via Clockify.
Commutes cost $9,470 a year on average
The typical American commute to work is 26.8 minutes each way, or 53.6 minutes combined.
With full-time, year-round working Americans earning an average of $42.24 an hour (after factoring in usual hours worked and total workdays), commuting to work costs an average of $37.73 a day. That equals $9,470 a year.
The cost of commuting
| Avg. commute time in minutes (one-way) | 26.8 |
| Avg. commute time in minutes (combined) | 53.6 |
| Avg. annual earnings for full-time, year-round workers | $81,515 |
| Avg. hourly earnings (based on usual hours worked and total workdays) | $42.24 |
| Avg. usual hours worked per week by employees 18 to 64 | 38.6 |
| Daily commute cost | $37.73 |
| Total workdays | 251 |
| Annual cost of commute | $9,470 |
That’s a significant increase from the $5,725 commuters lost on average when we conducted this study in 2023.
According to LendingTree auto insurance expert and licensed insurance agent Rob Bhatt, those aren’t the only costs commuters have to worry about.
“Car maintenance and insurance are costs that usually fall on workers, with exceptions for employees who drive company cars,” he says. “Some insurance companies factor your mileage into your rate. If you have a long commute, you may pay more than someone with a short commute. Most people commute in stop-and-go traffic, which puts additional wear and tear on a vehicle. This can lead to higher maintenance and repair costs. Obviously, fuel costs are another significant expense for all commuters.”
Costs rise to $18,472 in metro with most expensive commute
By metro, Bridgeport, Conn., has the most expensive commute — largely due to commute times and high earnings. Here, commuters spend an average of 64.4 minutes traveling to and from work each day.
With average hourly earnings of $66.16, workers lose an average of $73.59 a day or $18,472 a year to commuting.
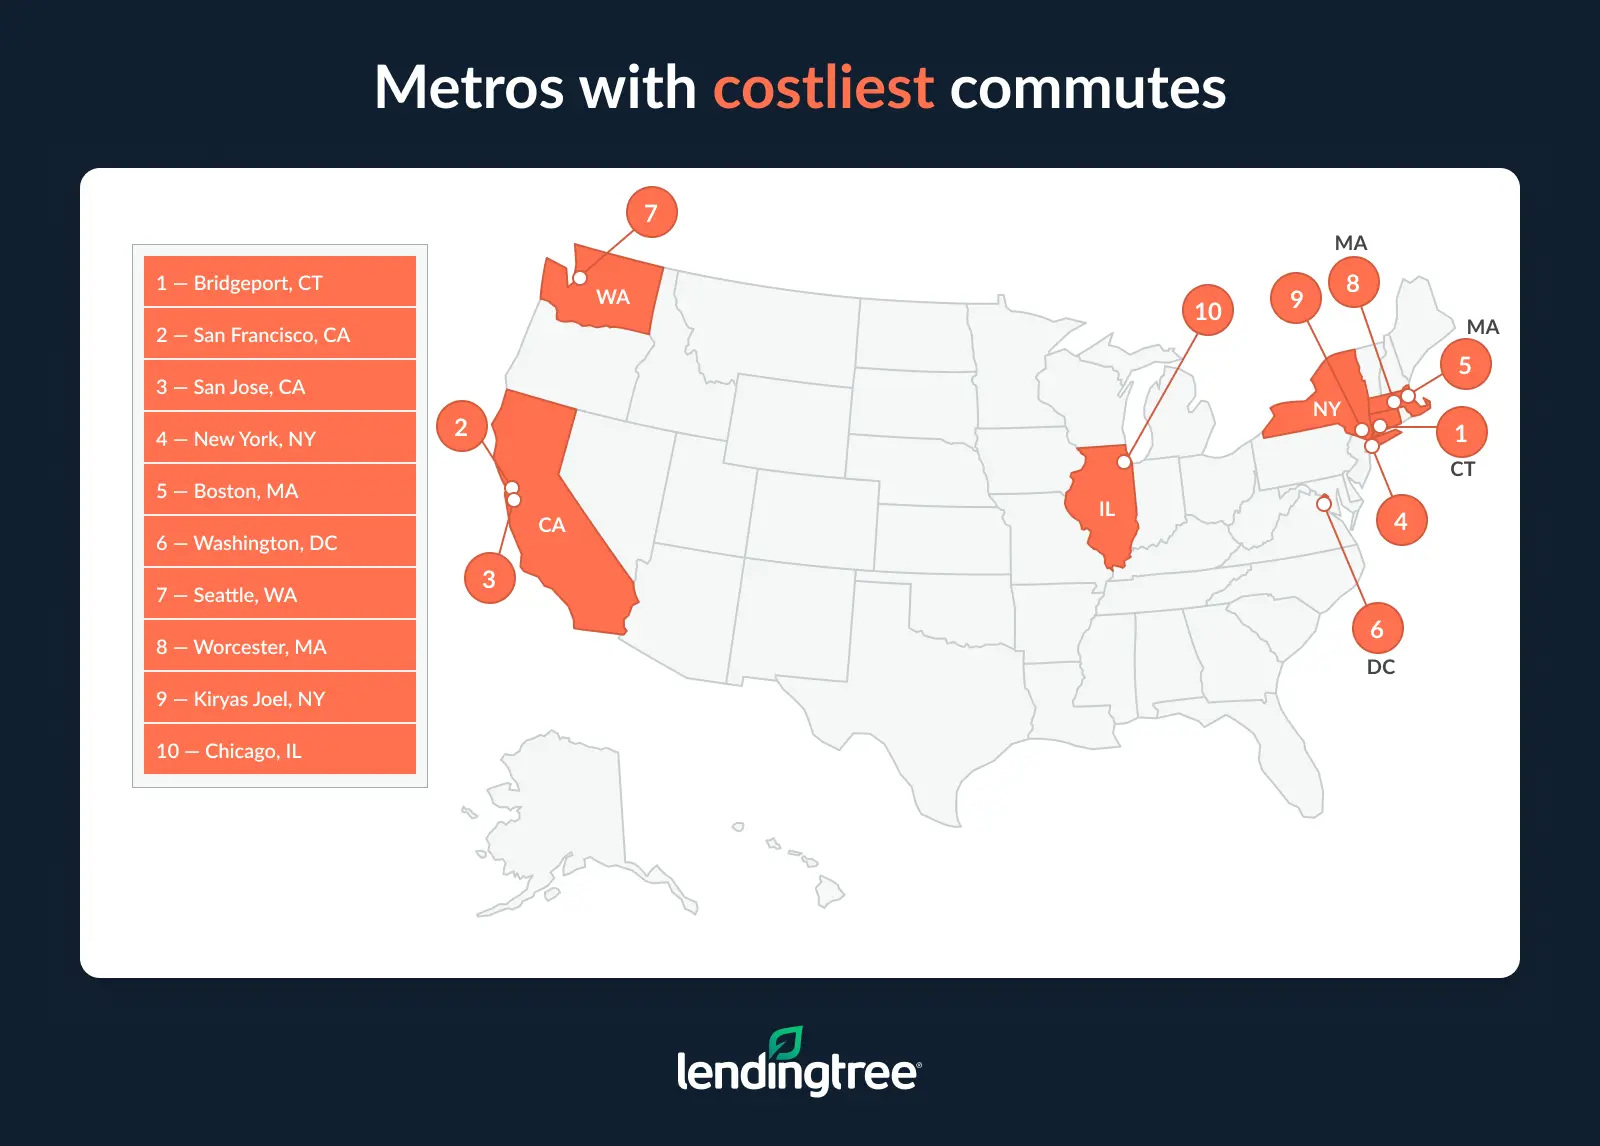
San Francisco ranks second, with commuters losing a similarly high average of 63.4 minutes in travel time each workday. Hourly earnings are similar to those in Bridgeport, averaging $66.13. Workers lose $72.41 a day or $18,175 a year in commute times.
San Jose, Calif., follows. While average hourly earnings are a significant $74.19, workers spend less time on the road than those in the top two metros at 55.2 minutes. That translates to $71.10 a day or $17,845 a year.
Commutes cheapest in Texas
Looking at where commutes are cheapest, McAllen, Texas, leads — largely due to low hourly earnings. Workers in McAllen earn an average of just $26.80 an hour, the lowest across the metros analyzed.
With an average round-trip commute of 44.6 minutes, workers in McAllen lose $20.54 a day or $5,155 a year.
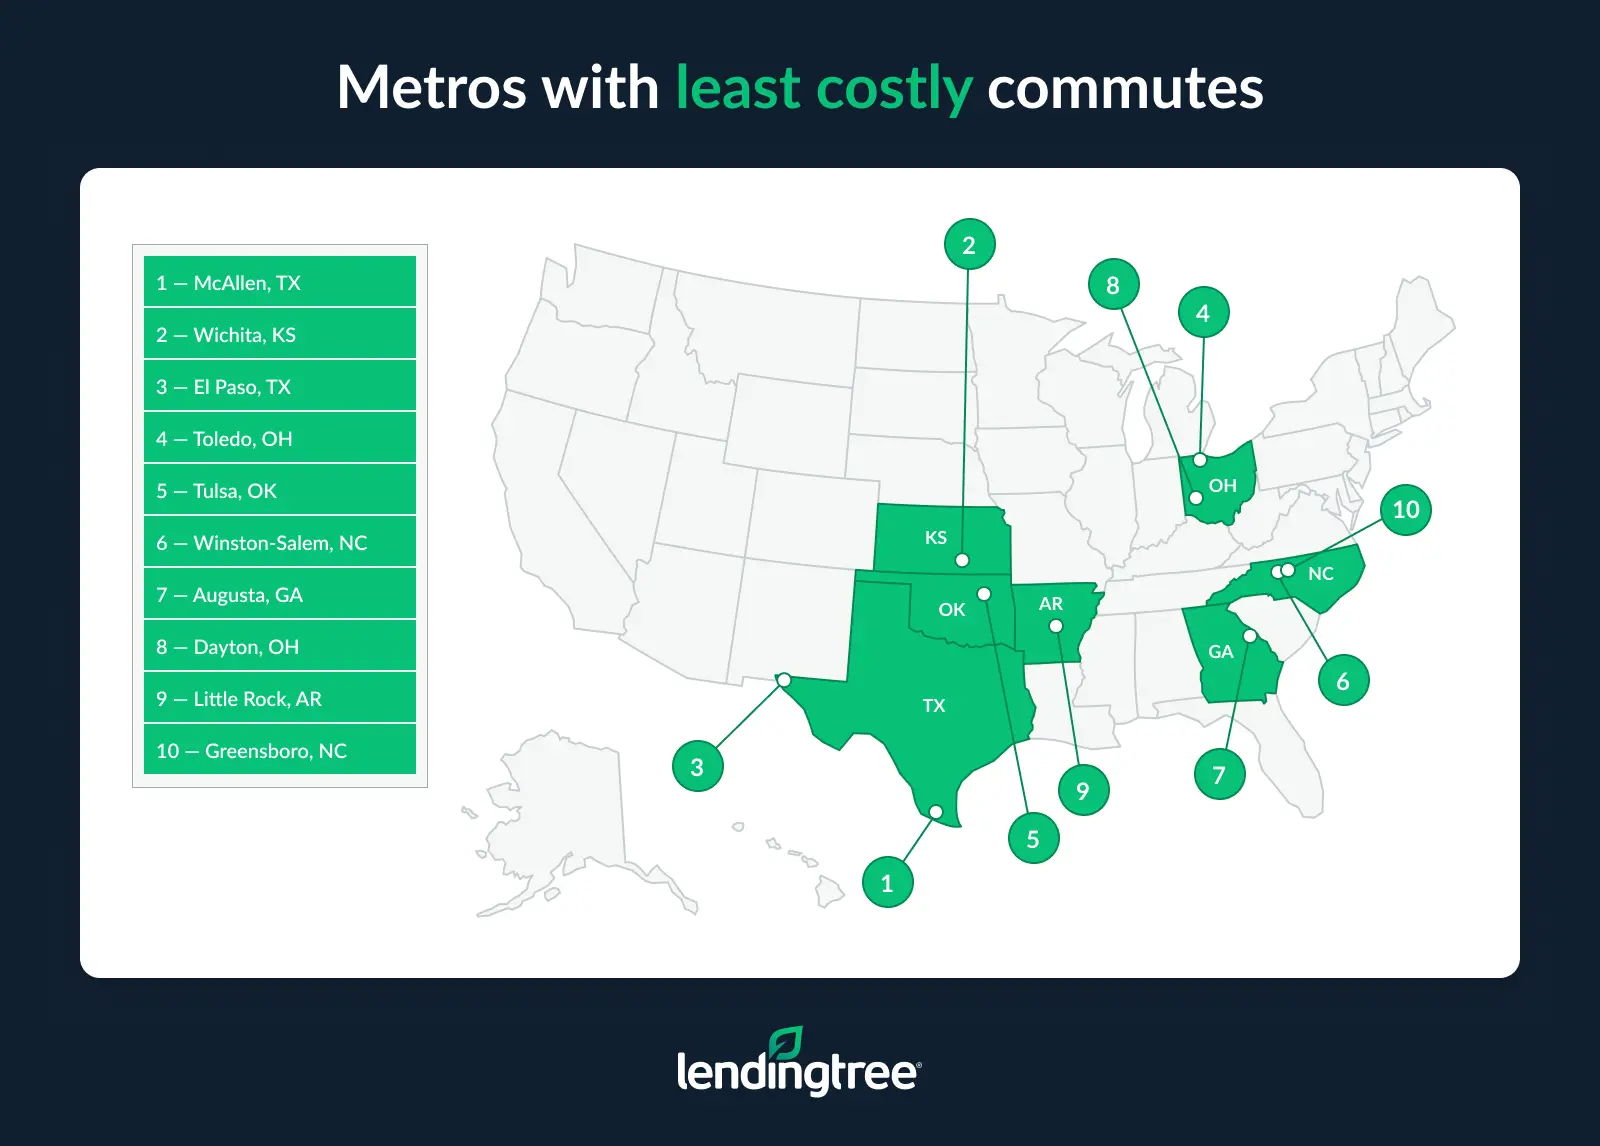
Wichita, Kan., follows, with a short commute time largely at play. The average commute in Wichita is 40.6 minutes — the lowest among the analyzed metros. With average hourly earnings of $32.76, workers lose $22.85 a day or $5,735 a year commuting.
El Paso, Texas, ranks next. The average commute is 49.0 minutes, while average hourly earnings are $27.98. Workers lose $23.26 a day or $5,837 a year.
New York metro has highest total commute costs
Across all commuters in a metro, New York has the highest total commute costs.
Naturally, metros with the most workers have the highest costs. In the New York metro, there are an estimated 8.3 million commuters. That brings the total annual commute costs to $138.8 billion.
Los Angeles ranks next. With 5.4 million commuters, total commute costs are an estimated $64.0 billion.
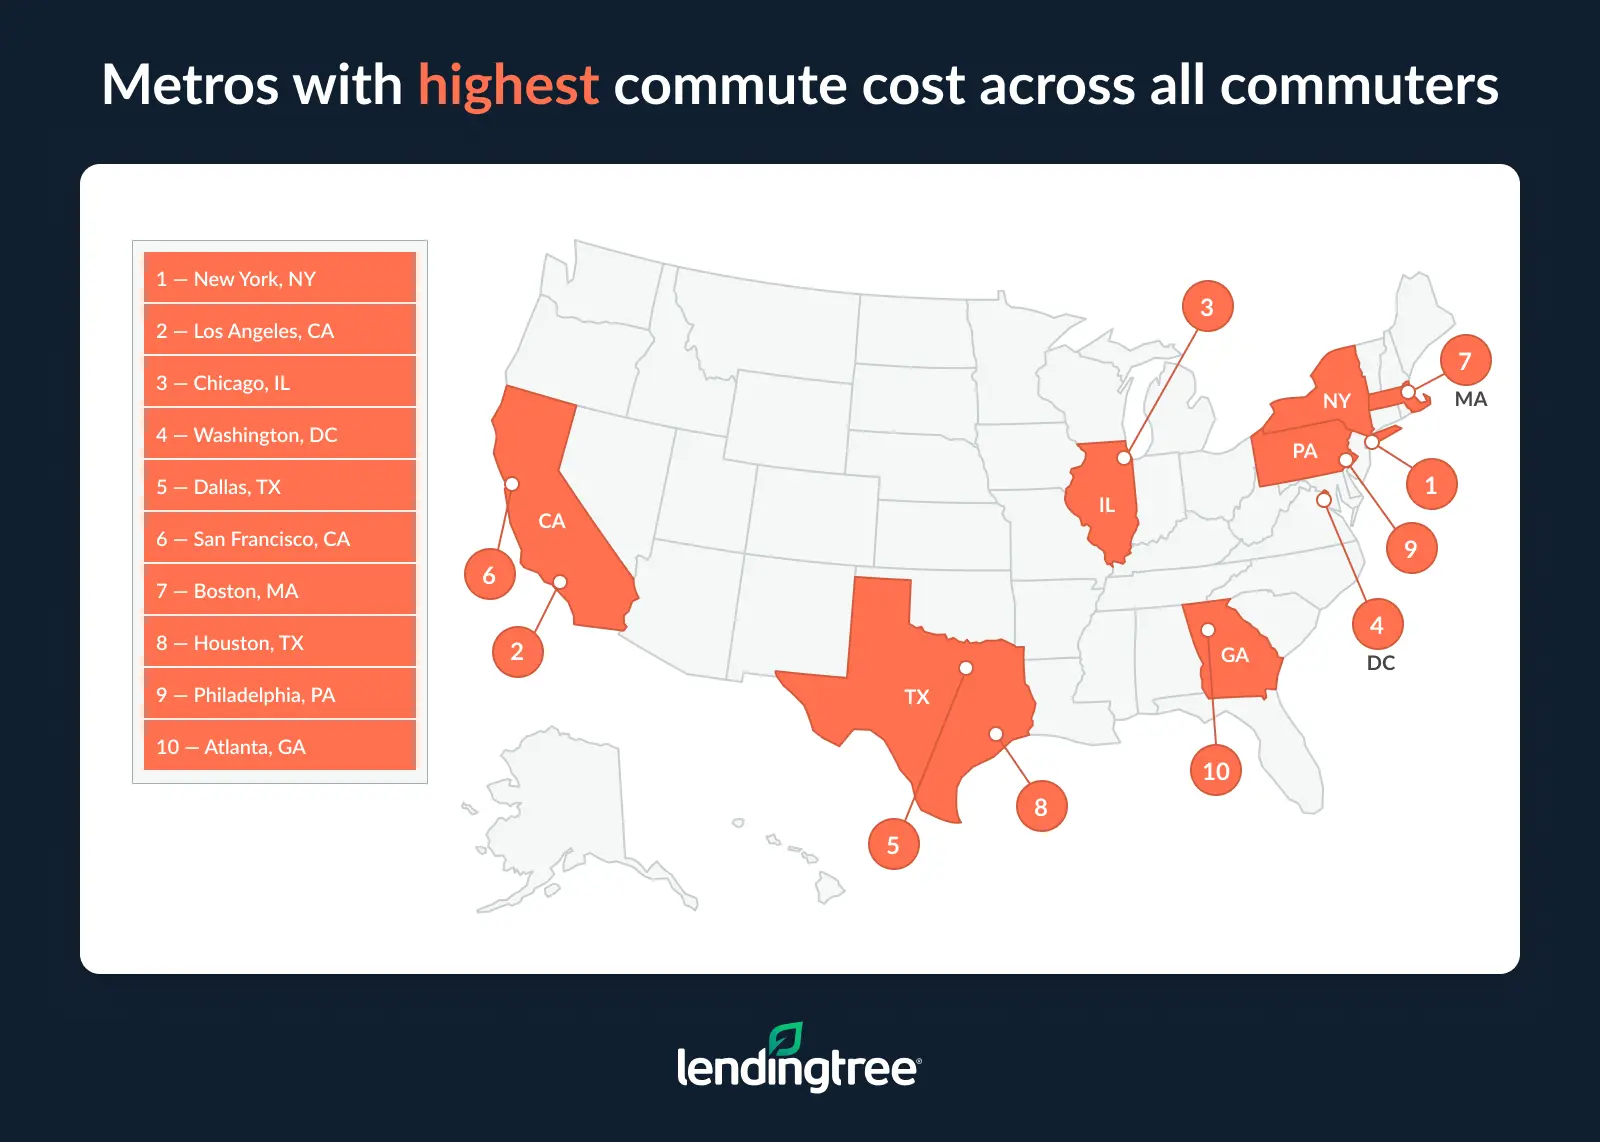
Chicago ranks third, with 4.0 million commuters collectively losing $47.8 billion.
Full rankings: Annual commute costs by metro
| Rank | Metro | Hourly earnings | Daily commute in minutes | Daily cost | Annual cost | Total cost (all commuters) |
|---|---|---|---|---|---|---|
| 1 | Bridgeport, CT | $66.16 | 64.4 | $73.59 | $18,472 | $7.6 billion |
| 2 | San Francisco, CA | $66.13 | 63.4 | $72.41 | $18,175 | $33.9 billion |
| 3 | San Jose, CA | $74.19 | 55.2 | $71.10 | $17,845 | $15.2 billion |
| 4 | New York, NY | $52.77 | 72.0 | $66.49 | $16,688 | $138.8 billion |
| 5 | Boston, MA | $55.99 | 62.2 | $61.10 | $15,335 | $33.7 billion |
| 6 | Washington, DC | $53.95 | 65.4 | $60.16 | $15,100 | $40.1 billion |
| 7 | Seattle, WA | $56.69 | 58.4 | $57.18 | $14,352 | $24.5 billion |
| 8 | Worcester, MA | $45.77 | 61.6 | $49.59 | $12,447 | $4.8 billion |
| 9 | Kiryas Joel, NY | $42.99 | 65.6 | $49.47 | $12,418 | $3.6 billion |
| 10 | Chicago, IL | $45.19 | 61.4 | $47.92 | $12,027 | $47.8 billion |
| 11 | Stockton, CA | $39.46 | 68.8 | $47.50 | $11,923 | $3.9 billion |
| 12 | Los Angeles, CA | $44.41 | 60.6 | $47.34 | $11,882 | $64.0 billion |
| 13 | Baltimore, MD | $45.36 | 59.4 | $46.30 | $11,620 | $14.1 billion |
| 14 | Philadelphia, PA | $45.27 | 58.6 | $46.05 | $11,560 | $30.1 billion |
| 15 | Austin, TX | $49.57 | 54.4 | $45.29 | $11,367 | $11.6 billion |
| 16 | Atlanta, GA | $41.86 | 63.2 | $45.11 | $11,323 | $29.3 billion |
| 17 | Sacramento, CA | $44.78 | 55.0 | $43.90 | $11,019 | $10.2 billion |
| 18 | Raleigh, NC | $46.99 | 53.2 | $42.74 | $10,727 | $6.5 billion |
| 19 | San Diego, CA | $47.14 | 51.4 | $42.40 | $10,641 | $15.0 billion |
| 20 | Riverside, CA | $35.73 | 66.4 | $41.84 | $10,503 | $19.8 billion |
| 21 | Oxnard, CA | $44.89 | 53.2 | $41.46 | $10,406 | $3.6 billion |
| 22 | Houston, TX | $40.40 | 61.0 | $41.07 | $10,310 | $32.8 billion |
| 23 | Portland, OR | $45.82 | 50.4 | $40.41 | $10,142 | $10.5 billion |
| 24 | Dallas, TX | $41.88 | 56.8 | $39.94 | $10,026 | $35.0 billion |
| 25 | Nashville, TN | $41.53 | 56.6 | $39.67 | $9,958 | $9.2 billion |
| 26 | North Port, FL | $42.59 | 53.8 | $39.57 | $9,932 | $3.2 billion |
| 27 | Miami, FL | $38.65 | 59.0 | $39.08 | $9,810 | $25.9 billion |
| 28 | Tampa, FL | $38.93 | 58.8 | $39.03 | $9,797 | $12.7 billion |
| 28 | Charlotte, NC | $42.14 | 54.6 | $39.03 | $9,797 | $11.1 billion |
| 30 | Providence, RI | $41.16 | 53.6 | $38.71 | $9,715 | $7.3 billion |
| 31 | Hartford, CT | $45.14 | 48.6 | $38.69 | $9,711 | $4.9 billion |
| 32 | Charleston, SC | $40.91 | 56.4 | $38.55 | $9,676 | $3.6 billion |
| 33 | Allentown, PA | $39.51 | 55.8 | $38.27 | $9,606 | $3.6 billion |
| 34 | Minneapolis, MN | $45.68 | 47.6 | $38.05 | $9,550 | $15.5 billion |
| 35 | Provo, UT | $41.36 | 47.0 | $37.67 | $9,455 | $2.8 billion |
| 36 | Phoenix, AZ | $40.56 | 53.4 | $37.22 | $9,342 | $18.7 billion |
| 37 | Honolulu, HI | $38.91 | 54.8 | $36.92 | $9,266 | $4.2 billion |
| 38 | Cape Coral, FL | $36.19 | 59.2 | $36.81 | $9,239 | $2.7 billion |
| 39 | Detroit, MI | $40.16 | 52.8 | $36.62 | $9,191 | $16.4 billion |
| 40 | Pittsburgh, PA | $40.70 | 51.8 | $36.60 | $9,187 | $9.4 billion |
| 41 | Portland, ME | $43.06 | 48.2 | $36.51 | $9,164 | $2.3 billion |
| 42 | Orlando, FL | $36.01 | 58.6 | $36.44 | $9,148 | $10.7 billion |
| 43 | Birmingham, AL | $38.58 | 55.2 | $36.03 | $9,043 | $4.4 billion |
| 44 | Durham, NC | $43.06 | 48.4 | $35.99 | $9,035 | $2.3 billion |
| 45 | Richmond, VA | $40.81 | 51.0 | $35.76 | $8,976 | $5.2 billion |
| 46 | New Haven, CT | $41.62 | 47.4 | $35.45 | $8,899 | $2.2 billion |
| 47 | St. Louis, MO | $40.58 | 49.8 | $35.00 | $8,784 | $10.8 billion |
| 48 | Indianapolis, IN | $39.82 | 50.8 | $34.76 | $8,725 | $8.2 billion |
| 49 | Jacksonville, FL | $39.04 | 52.6 | $34.75 | $8,722 | $5.9 billion |
| 50 | Salt Lake City, UT | $41.56 | 47.2 | $34.23 | $8,593 | $4.8 billion |
| 51 | Lakeland, FL | $30.69 | 64.8 | $34.17 | $8,576 | $2.7 billion |
| 52 | Cincinnati, OH | $40.60 | 48.4 | $34.03 | $8,541 | $8.4 billion |
| 53 | Albany, NY | $41.18 | 46.2 | $34.01 | $8,535 | $3.3 billion |
| 54 | Columbus, OH | $40.12 | 47.6 | $33.15 | $8,321 | $7.7 billion |
| 55 | Akron, OH | $39.18 | 48.2 | $33.05 | $8,295 | $2.5 billion |
| 56 | Milwaukee, WI | $41.02 | 45.6 | $32.64 | $8,193 | $5.6 billion |
| 57 | Cleveland, OH | $39.21 | 47.4 | $32.35 | $8,119 | $7.5 billion |
| 58 | Palm Bay, FL | $37.88 | 48.6 | $32.13 | $8,065 | $2.0 billion |
| 59 | Deltona, FL | $33.26 | 56.6 | $32.09 | $8,056 | $2.2 billion |
| 60 | San Antonio, TX | $34.60 | 54.8 | $32.00 | $8,033 | $9.0 billion |
| 61 | Spokane, WA | $38.25 | 47.4 | $31.97 | $8,025 | $1.9 billion |
| 62 | Baton Rouge, LA | $35.84 | 52.2 | $31.90 | $8,007 | $2.9 billion |
| 63 | Las Vegas, NV | $35.27 | 52.0 | $31.51 | $7,910 | $7.9 billion |
| 64 | Madison, WI | $41.35 | 43.2 | $31.51 | $7,908 | $2.5 billion |
| 65 | Kansas City, MO | $39.27 | 46.6 | $31.44 | $7,893 | $7.6 billion |
| 66 | Reno, NV | $38.98 | 46.6 | $31.37 | $7,875 | $2.0 billion |
| 67 | Virginia Beach, VA | $36.61 | 50.2 | $31.33 | $7,865 | $6.2 billion |
| 68 | Knoxville, TN | $35.85 | 50.2 | $31.24 | $7,841 | $3.1 billion |
| 69 | Tucson, AZ | $35.83 | 49.0 | $31.21 | $7,834 | $3.3 billion |
| 70 | Ogden, UT | $37.99 | 46.2 | $31.20 | $7,832 | $2.2 billion |
| 71 | Harrisburg, PA | $38.39 | 46.0 | $31.06 | $7,796 | $2.0 billion |
| 72 | Albuquerque, NM | $35.00 | 50.6 | $30.99 | $7,777 | $3.0 billion |
| 73 | Boise City, ID | $38.17 | 46.2 | $30.94 | $7,765 | $2.7 billion |
| 73 | Lancaster, PA | $37.32 | 47.0 | $30.93 | $7,765 | $1.9 billion |
| 75 | Syracuse, NY | $38.74 | 44.2 | $30.52 | $7,661 | $2.1 billion |
| 76 | Greenville, SC | $35.41 | 49.6 | $30.26 | $7,594 | $3.2 billion |
| 77 | Chattanooga, TN | $37.43 | 46.8 | $30.18 | $7,575 | $1.8 billion |
| 78 | New Orleans, LA | $36.24 | 49.0 | $30.12 | $7,560 | $3.0 billion |
| 79 | Louisville, KY | $35.98 | 49.0 | $29.98 | $7,525 | $4.4 billion |
| 80 | Columbia, SC | $35.04 | 48.8 | $29.84 | $7,489 | $2.7 billion |
| 81 | Bakersfield, CA | $32.97 | 51.0 | $29.50 | $7,404 | $2.6 billion |
| 82 | Oklahoma City, OK | $35.94 | 47.6 | $29.39 | $7,377 | $4.7 billion |
| 83 | Grand Rapids, MI | $38.00 | 43.4 | $29.16 | $7,320 | $3.8 billion |
| 84 | Omaha, NE | $40.40 | 42.2 | $28.99 | $7,277 | $3.3 billion |
| 85 | Fayetteville, AR | $38.69 | 44.0 | $28.88 | $7,249 | $1.9 billion |
| 86 | Buffalo, NY | $36.88 | 43.6 | $28.51 | $7,157 | $3.6 billion |
| 87 | Fresno, CA | $34.06 | 47.0 | $28.38 | $7,124 | $3.1 billion |
| 88 | Memphis, TN | $33.66 | 49.4 | $28.28 | $7,097 | $4.0 billion |
| 89 | Des Moines, IA | $39.73 | 41.4 | $28.26 | $7,094 | $2.4 billion |
| 90 | Rochester, NY | $37.25 | 42.2 | $28.17 | $7,072 | $3.2 billion |
| 91 | Greensboro, NC | $33.91 | 47.2 | $27.93 | $7,011 | $2.4 billion |
| 92 | Little Rock, AR | $34.02 | 47.8 | $27.80 | $6,977 | $2.2 billion |
| 93 | Dayton, OH | $36.02 | 43.4 | $27.64 | $6,938 | $2.4 billion |
| 94 | Augusta, GA | $33.53 | 47.4 | $27.03 | $6,784 | $1.7 billion |
| 95 | Winston-Salem, NC | $33.07 | 47.8 | $26.95 | $6,765 | $2.0 billion |
| 96 | Tulsa, OK | $34.82 | 44.4 | $26.36 | $6,616 | $2.9 billion |
| 97 | Toledo, OH | $34.79 | 41.4 | $25.07 | $6,292 | $1.6 billion |
| 98 | El Paso, TX | $27.98 | 49.0 | $23.26 | $5,837 | $2.1 billion |
| 99 | Wichita, KS | $32.76 | 40.6 | $22.85 | $5,735 | $1.7 billion |
| 100 | McAllen, TX | $26.80 | 44.6 | $20.54 | $5,155 | $1.7 billion |
Mitigating commute costs: Top expert tips
For many workers, commuting is a necessary evil. But there are a few things you can do to reduce your commute costs. Bhatt recommends the following:
- Consider using transit once or twice a week if available. “There may be days when transit isn’t an option, but there also may be one or two days a week it is,” he says. “This can reduce the wear and tear on your car and save you a little money on fuel.”
- Try to negotiate a hybrid schedule. If possible, ask your employer if you can work from home one or two days a week.
- Take care of your vehicle. A long drive to work is rough on your car, but proper maintenance can help reduce the likelihood of it breaking down. You can also consider taking out an auto loan if you have the financial wiggle room to upgrade your vehicle.
Methodology
To estimate the cost of commuting in the 100 largest U.S. metros with available data, researchers analyzed average hourly earnings for full-time, year-round workers and typical commute times. We multiplied these figures by the number of working days in 2024 (251 days) to calculate the annual opportunity cost of commuting.
Data is via the U.S. Census Bureau 2023 American Community Survey (ACS) with one-year estimates.
Get auto loan offers from up to 5 lenders in minutes
Read more
Amtrak Ridership Surging but Still Lags Behind Pre-COVID-19 Figures Updated February 12, 2024 This LendingTree study analyzed Amtrak data to show how ridership has changed nationally and by…Read more