Black Homebuyers 1.7 Times More Likely to Be Denied for Mortgages Than All Homebuyers
The path to homeownership typically begins with applying for a mortgage — but for many aspiring Black homeowners, the journey ends there. A LendingTree study reveals that Black applicants nationwide are 1.7 times more likely to be denied a mortgage than homebuyers of all races.
High mortgage denial rates — along with limited generational wealth, income disparities and discriminatory practices — are just one of the persistent challenges that keep the Black homeownership rate lower than that of other racial groups.
But these disparities aren’t uniform. Denial rates — and the gaps between Black and overall applicants — vary widely across the country.
Key findings
- Black homebuyers are 1.7 times more likely to be denied a mortgage than all homebuyers. The denial rate for Black applicants across the U.S. was 19.00% in 2024, compared with 11.27% for all applicants — a gap of 7.73 percentage points.
- Grand Rapids, Mich., Detroit, and Raleigh, N.C., have the widest denial rate gaps among the 50 largest metros. In the two Michigan metros, Black borrowers experience denial rates exceeding 20.00% — 9.75 and 8.54 points higher than each metro’s rate among all homeowners. In Raleigh, N.C., the gap is 8.44 points.
- Salt Lake City’s Black denial rate is only 0.24 points higher than its overall rate. San Antonio (1.54 points) and Fresno, Calif. (2.02 points), are the next closest. Three metros each in California and Texas rank among the bottom 10 for the lowest gaps.
- Black homebuyer denial rates are highest in Grand Rapids, Detroit and Miami, and lowest in Salt Lake City, Seattle and Portland, Ore. Although denial rates can vary across the 50 metros, they exceed 10.00% everywhere but Salt Lake City, at 8.94%.
- Debt-to-income (DTI) ratio is the leading reason for mortgage denials for Black or all borrowers, but credit history is a prominent obstacle for Black applicants. In 2024, DTI ratios accounted for 34.02% of all denials, compared with 34.08% among Black applicants. However, credit history was the main reason in 24.85% of all denials, compared with 33.16% among Black borrowers, an 8.31-point gap.
Black homebuyer denial rate is 19.00% nationally; disparity decreases across largest metros
Black mortgage applicants are 1.7 times more likely to be denied a home loan than all homebuyers. In 2024, the mortgage denial rate for Black Americans across the U.S. was 19.00%, 7.73 percentage points higher than the denial rate for all applicants, 11.27%.
In what is perhaps a sign of progress, the denial rate disparity between Black and all mortgage applicants in the 50 largest metros decreased from 5.30 percentage points in 2022 to 4.80 percentage points in 2024.
Mortgage denial rates across 50 largest metros: All buyers vs. Black buyers
| Year | Denial rate, all borrowers | Denial rate, Black borrowers | Spread |
|---|---|---|---|
| 2024 | 9.47% | 14.27% | 4.80 |
| 2022 | 9.14% | 14.44% | 5.30 |
While the difference in denial rates between Black homebuyers and all buyers has narrowed slightly, the homeownership gap remains wide. The national homeownership rate in 2023 was 65.2%, yet it was 44.7% among Black consumers — significantly lower than the rate among white (72.4%), Asian (63.4%) and Hispanic (51.0%) households.
The homeownership rate among U.S. Black households has increased over the past decade, as it has for all racial groups. In fact, between 2022 and 2023, the homeownership rate among Black households saw a significant gain. Despite the increase, data shows that the gap between Black and white homeownership rates has grown over the past 10 years, from 27% in 2013 to 28% in 2023.
LendingTree chief consumer finance analyst Matt Schulz says a higher denial rate for Black consumers means limited access to the benefits of owning a home.
“For generations, homeownership has been one of the most powerful tools for building wealth that Americans have. Homeownership isn’t cheap, and there are ongoing costs; however, the equity that you can build over the years can be incredibly helpful. Not only can it provide you funding when you’re in a financial pinch, but it can also be used in working toward other financial goals,” Schulz says.
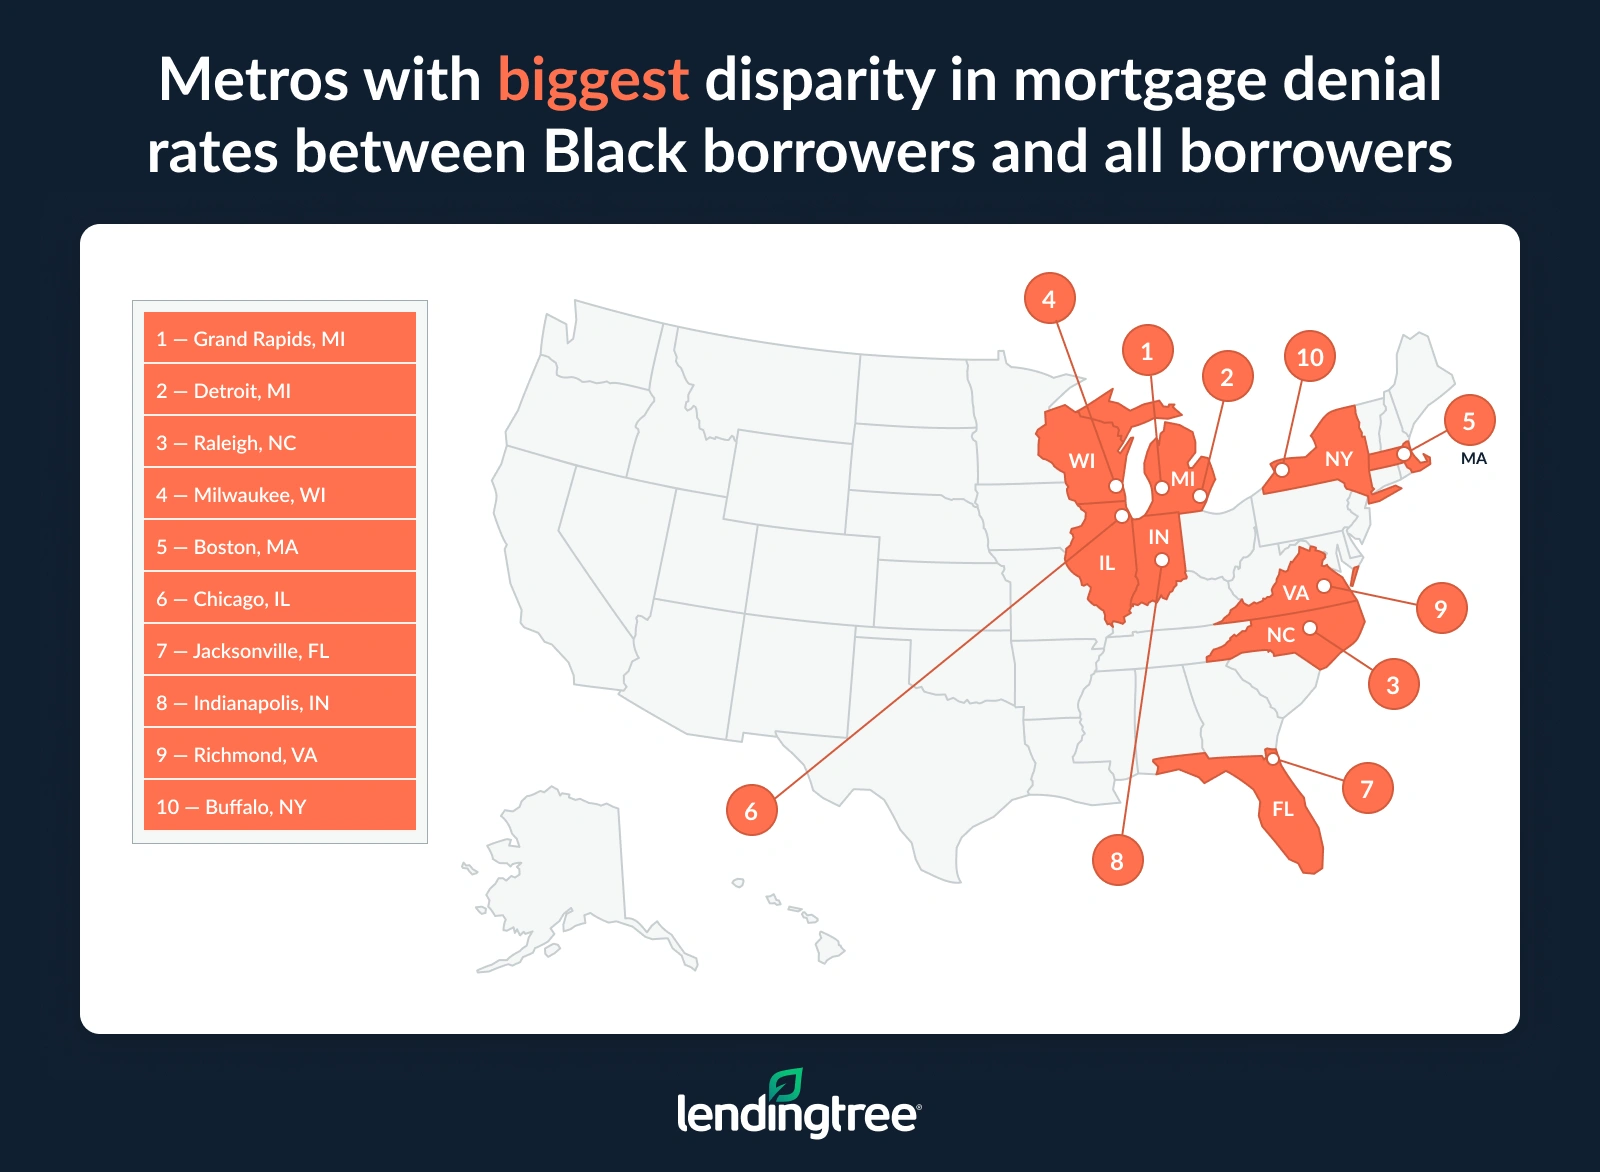
Black homebuyers face biggest discrepancies in Michigan metros
Two Michigan metros — Grand Rapids and Detroit — have the country’s largest gaps in mortgage denial rates between Black homebuyers and all applicants.
In Grand Rapids, the denial rate for Black borrowers is 23.90%, compared with 14.15% among applicants of all races — a 9.75 percentage point difference. Detroit follows closely with an 8.54-point gap, where 21.25% of Black applicants are denied, compared with 12.71% of all applicants.
Several factors may contribute to the higher denial rates in Grand Rapids and Detroit, including the effects of historically discriminatory practices, affordability challenges and disparities in credit access and income levels. In Grand Rapids, the median household income for Black residents in 2023 was only $40,977, compared with the citywide median of $65,526, which limits down payment savings and diminishes affordability.
Detroit has a long history of redlining, with its impacts (and modern forms of redlining) continuing to affect the area’s majority-Black population. Additionally, the city has seen a dramatic increase in home prices, likely pricing many prospective buyers out. A report from Mortgage Calculator shows the average Detroit home price increased 72% from $46,586 in 2020 to $80,127 in 2024.
Raleigh, N.C., has the third-highest gap with an 8.44 percentage point difference. The denial rate in the Southern metro is 16.41% among Black borrowers, compared with 7.97% among all homebuyers.
The mortgage denial rate for Black borrowers in these three metros has increased in recent years.
% change in denial rates for Black borrowers among metros with biggest spreads
| Metro | Denial rate, Black borrowers, 2022 | Denial rate, Black borrowers, 2024 | % change |
|---|---|---|---|
| Grand Rapids, MI | 21.58% | 23.90% | 10.75% |
| Detroit, MI | 19.45% | 21.25% | 9.25% |
| Raleigh, NC | 15.47% | 16.41% | 6.08% |
Memphis, Tenn., and Atlanta have highest proportion of Black applicants
The proportion of Black mortgage applicants compared to all applicants varies significantly across the country’s largest metros. Memphis, Tenn., has the highest share at 27.92%, followed by Atlanta at 25.35%. The denial gaps in those metros are 4.90 and 4.01 percentage points, respectively, closely reflecting the 50-metro average of 4.80 percentage points.
Conversely, San Jose, Calif., has the smallest percentage of Black applicants (0.71%) and is the only metro where less than 1.00% of all mortgage applicants are Black. The denial rate gap there is 5.64 percentage points. Salt Lake City has the next smallest percentage of Black applicants at 1.50%.
Black homebuyers face smallest discrepancy in Salt Lake City
Salt Lake City boasts the lowest mortgage denial gap of the country’s largest metros. The denial rate for Black applicants in the Utah capital is 8.94%, just 0.24 percentage points above the overall denial rate of 8.70%. While Salt Lake City’s denial rate difference is much lower than the average discrepancy of 4.80, the narrow gap may be a matter of numbers rather than policy.
Black residents make up only 2.7% of the city’s population and 1.50% of 2023 mortgage applications, representing just over 300 applicants and 27 denials. With such a small quantity, a handful of approvals or denials could alter the rate. Even so, the economic disparities are evident in Salt Lake City — the median Black household income in 2023 was $37,821, versus $79,485 for white households.
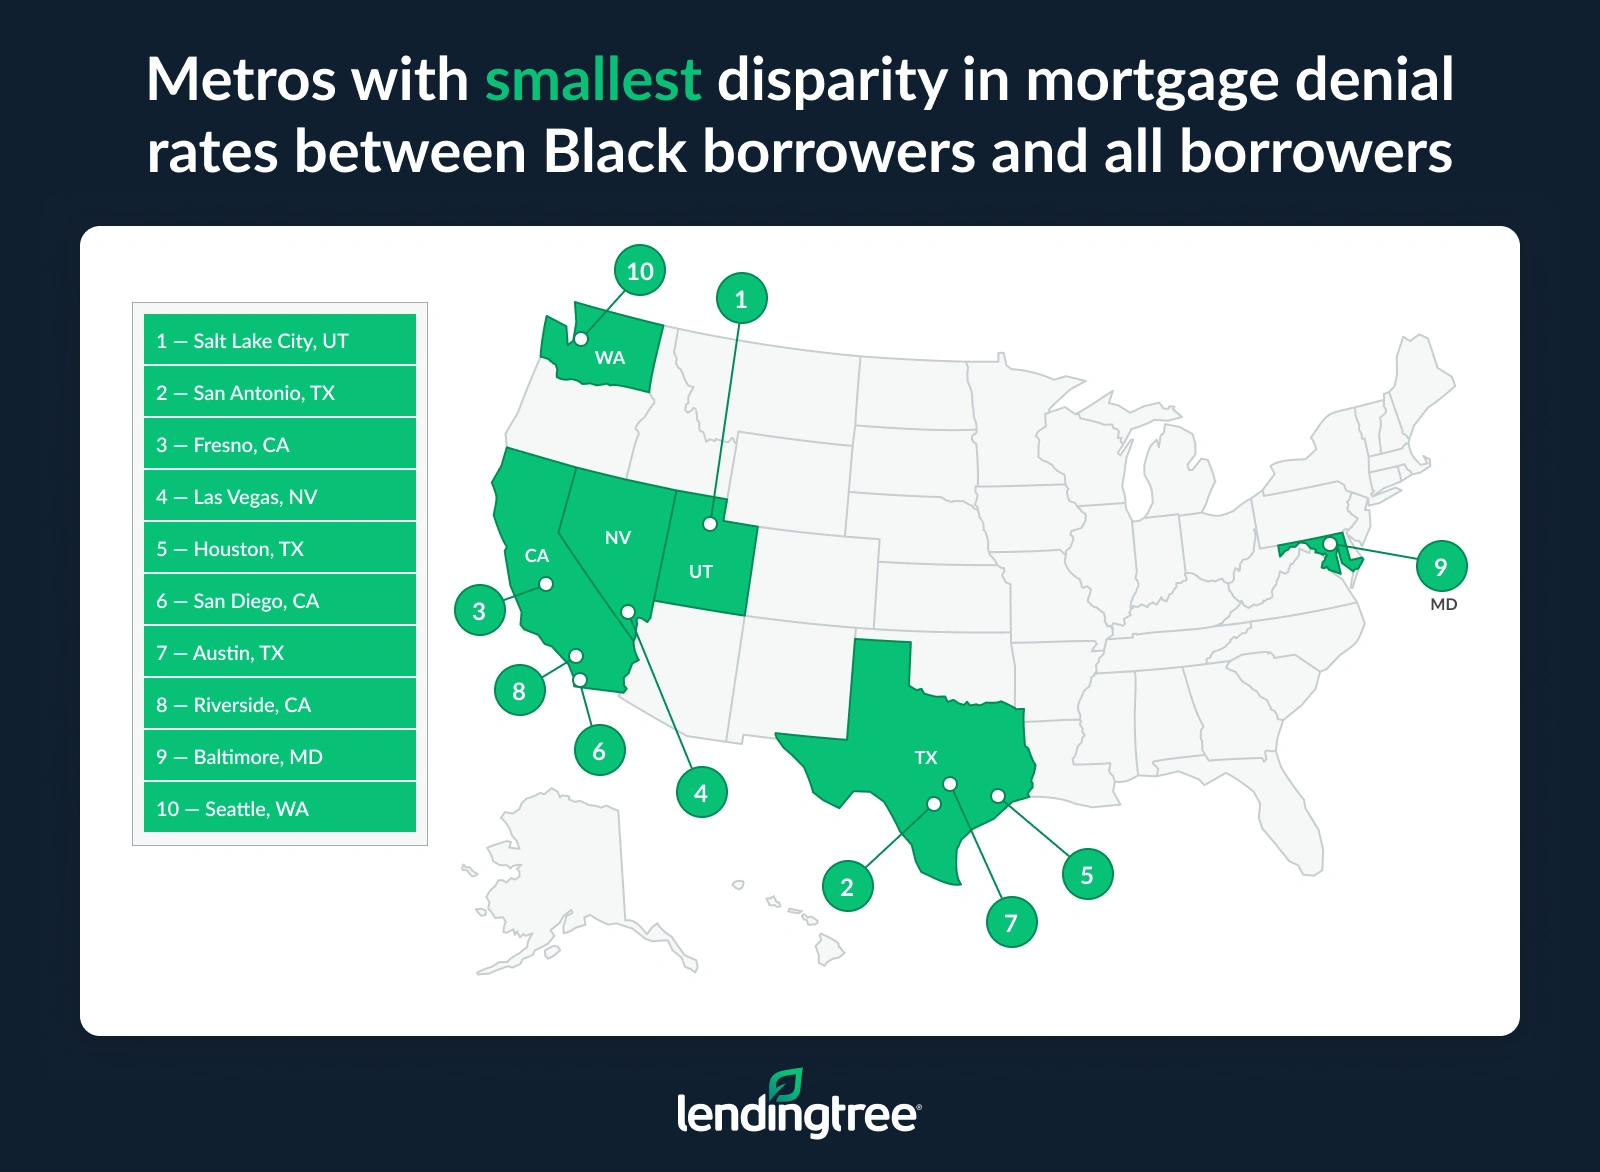
San Antonio has the second-lowest discrepancy (1.54 percentage points) with a 15.36% mortgage denial rate for Black households, compared with 13.82% for all households. One factor contributing to the narrow difference could be the area’s significant military and veteran population, which can lead to a higher Black homeownership rate. Additionally, the prevalence of VA loans among military borrowers may result in better approval rates, as such loans have more flexible qualification requirements.
Fresno, Calif., has the third-lowest gap with a 2.02 percentage point difference. The denial rate there is 12.27% among Black borrowers and 10.25% among all borrowers.
Between 2022 and 2024, the mortgage denial rate among Black homebuyers decreased in Salt Lake City and Fresno, Calif., while increasing in San Antonio.
% change in denial rates for Black borrowers among metros with smallest spreads
| Metro | Denial rate, Black borrowers, 2022 | Denial rate, Black borrowers, 2024 | % change |
|---|---|---|---|
| Salt Lake City, UT | 9.29% | 8.94% | -3.77% |
| San Antonio, TX | 13.65% | 15.36% | 12.53% |
| Fresno, CA | 13.02% | 12.27% | -5.76% |
Notably, six of the 10 metros with the smallest denial rate gaps are in just two states — California and Texas, with three metros in each.
Full rankings: Metros with biggest/smallest disparity in mortgage denial rates between Black borrowers and all borrowers
| Rank | Metro | Denial rate, all borrowers | Denial rate, Black borrowers | Spread in rates |
|---|---|---|---|---|
| 1 | Grand Rapids, MI | 14.15% | 23.90% | 9.75 |
| 2 | Detroit, MI | 12.71% | 21.25% | 8.54 |
| 3 | Raleigh, NC | 7.97% | 16.41% | 8.44 |
| 4 | Milwaukee, WI | 7.49% | 15.81% | 8.32 |
| 5 | Boston, MA | 7.73% | 15.79% | 8.06 |
| 6 | Chicago, IL | 8.69% | 16.09% | 7.40 |
| 7 | Jacksonville, FL | 11.35% | 18.69% | 7.34 |
| 8 | Indianapolis, IN | 9.95% | 17.20% | 7.25 |
| 9 | Richmond, VA | 7.75% | 14.09% | 6.34 |
| 10 | Buffalo, NY | 9.22% | 15.29% | 6.07 |
| 11 | Charlotte, NC | 9.28% | 15.31% | 6.03 |
| 12 | St. Louis, MO | 7.68% | 13.66% | 5.98 |
| 13 | Los Angeles, CA | 9.90% | 15.79% | 5.89 |
| 14 | New York, NY | 10.09% | 15.96% | 5.87 |
| 15 | Cleveland, OH | 8.21% | 14.06% | 5.85 |
| 16 | Nashville, TN | 7.87% | 13.52% | 5.65 |
| 17 | San Jose, CA | 7.26% | 12.90% | 5.64 |
| 18 | Sacramento, CA | 8.00% | 13.33% | 5.33 |
| 19 | Kansas City, MO | 6.42% | 11.47% | 5.05 |
| 20 | Phoenix, AZ | 8.46% | 13.47% | 5.01 |
| 21 | Providence, RI | 8.17% | 13.14% | 4.97 |
| 22 | Memphis, TN | 9.80% | 14.70% | 4.90 |
| 23 | Columbus, OH | 7.71% | 12.50% | 4.79 |
| 24 | Oklahoma City, OK | 10.45% | 15.19% | 4.74 |
| 25 | Philadelphia, PA | 8.05% | 12.59% | 4.54 |
| 26 | Denver, CO | 8.08% | 12.45% | 4.37 |
| 27 | Washington, DC | 7.73% | 12.08% | 4.35 |
| 28 | Minneapolis, MN | 6.75% | 11.08% | 4.33 |
| 29 | Dallas, TX | 10.47% | 14.64% | 4.17 |
| 30 | Birmingham, AL | 12.99% | 17.09% | 4.10 |
| 31 | Virginia Beach, VA | 7.08% | 11.11% | 4.03 |
| 32 | Cincinnati, OH | 8.70% | 12.71% | 4.01 |
| 32 | Atlanta, GA | 10.03% | 14.04% | 4.01 |
| 34 | Miami, FL | 16.18% | 20.11% | 3.93 |
| 35 | Orlando, FL | 13.07% | 16.90% | 3.83 |
| 36 | Pittsburgh, PA | 8.09% | 11.82% | 3.73 |
| 37 | Louisville, KY | 10.17% | 13.89% | 3.72 |
| 38 | Portland, OR | 6.93% | 10.57% | 3.64 |
| 39 | Tampa, FL | 11.80% | 15.33% | 3.53 |
| 39 | San Francisco, CA | 7.23% | 10.76% | 3.53 |
| 41 | Seattle, WA | 6.72% | 10.22% | 3.50 |
| 42 | Baltimore, MD | 8.15% | 11.45% | 3.30 |
| 43 | Riverside, CA | 10.66% | 13.72% | 3.06 |
| 44 | Austin, TX | 10.30% | 12.99% | 2.69 |
| 45 | San Diego, CA | 9.75% | 12.16% | 2.41 |
| 46 | Houston, TX | 15.21% | 17.52% | 2.31 |
| 47 | Las Vegas, NV | 10.09% | 12.15% | 2.06 |
| 48 | Fresno, CA | 10.25% | 12.27% | 2.02 |
| 49 | San Antonio, TX | 13.82% | 15.36% | 1.54 |
| 50 | Salt Lake City, UT | 8.70% | 8.94% | 0.24 |
Where Black homebuyer denial rates are highest and lowest
Black homebuyers face the highest rejection rates in Grand Rapids, Detroit and Miami, with denial rates reaching above 20.00%. Grand Rapids, which also has the largest denial discrepancy, has a denial rate of 23.90% among Black borrowers. Detroit (21.25%) and Miami (20.11%) follow.
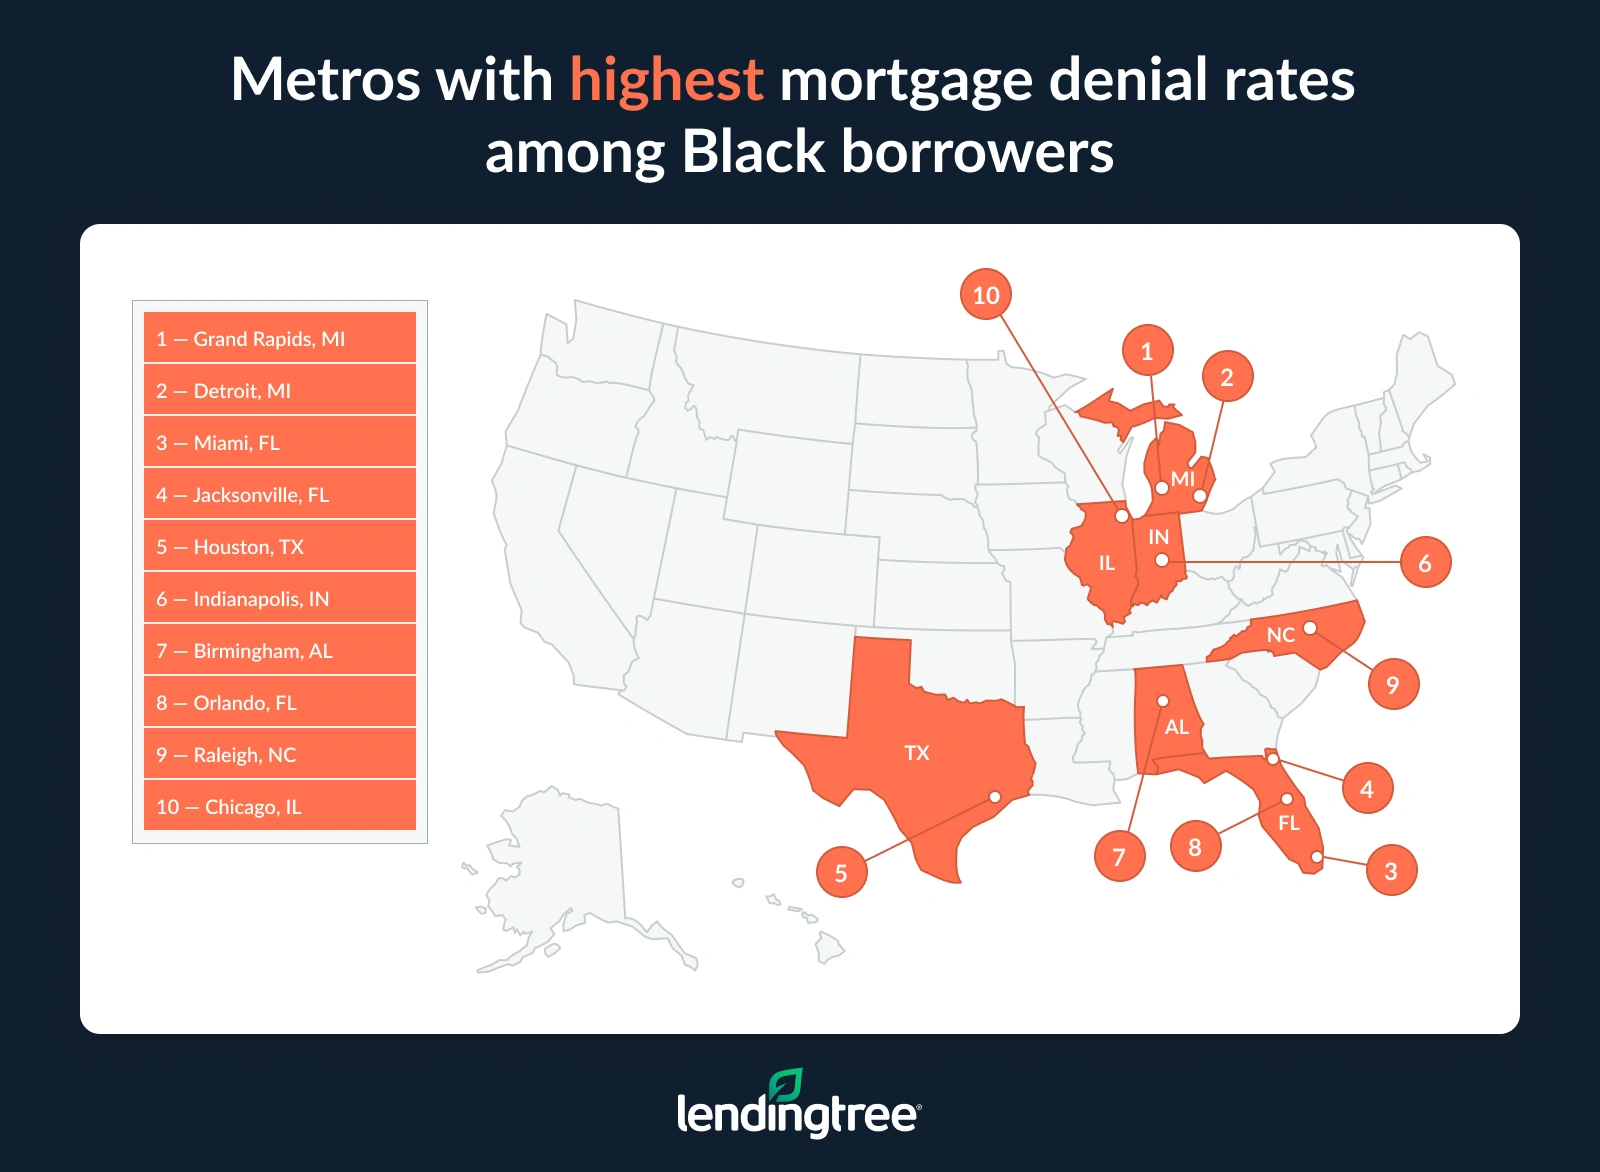
By contrast, the metros with the lowest Black denial rates have rejection rates roughly half those of the highest metros. Salt Lake City, which also boasts the slimmest denial rate gap, has a rejection rate of 8.94% among Black applicants. Seattle (10.22%) and Portland, Ore. (10.57%), follow.
While denial rates among Black homebuyers vary across the 50 metros, Salt Lake City is the only metro with a denial rate below 10.00%.
Full rankings: Metros with highest/lowest mortgage denial rates among Black homebuyers
| Rank | Metro | Denial rate |
|---|---|---|
| 1 | Grand Rapids, MI | 23.90% |
| 2 | Detroit, MI | 21.25% |
| 3 | Miami, FL | 20.11% |
| 4 | Jacksonville, FL | 18.69% |
| 5 | Houston, TX | 17.52% |
| 6 | Indianapolis, IN | 17.20% |
| 7 | Birmingham, AL | 17.09% |
| 8 | Orlando, FL | 16.90% |
| 9 | Raleigh, NC | 16.41% |
| 10 | Chicago, IL | 16.09% |
| 11 | New York, NY | 15.96% |
| 12 | Milwaukee, WI | 15.81% |
| 13 | Boston, MA | 15.79% |
| 13 | Los Angeles, CA | 15.79% |
| 15 | San Antonio, TX | 15.36% |
| 16 | Tampa, FL | 15.33% |
| 17 | Charlotte, NC | 15.31% |
| 18 | Buffalo, NY | 15.29% |
| 19 | Oklahoma City, OK | 15.19% |
| 20 | Memphis, TN | 14.70% |
| 21 | Dallas, TX | 14.64% |
| 22 | Richmond, VA | 14.09% |
| 23 | Cleveland, OH | 14.06% |
| 24 | Atlanta, GA | 14.04% |
| 25 | Louisville, KY | 13.89% |
| 26 | Riverside, CA | 13.72% |
| 27 | St. Louis, MO | 13.66% |
| 28 | Nashville, TN | 13.52% |
| 29 | Phoenix, AZ | 13.47% |
| 30 | Sacramento, CA | 13.33% |
| 31 | Providence, RI | 13.14% |
| 32 | Austin, TX | 12.99% |
| 33 | San Jose, CA | 12.90% |
| 34 | Cincinnati, OH | 12.71% |
| 35 | Philadelphia, PA | 12.59% |
| 36 | Columbus, OH | 12.50% |
| 37 | Denver, CO | 12.45% |
| 38 | Fresno, CA | 12.27% |
| 39 | San Diego, CA | 12.16% |
| 40 | Las Vegas, NV | 12.15% |
| 41 | Washington, DC | 12.08% |
| 42 | Pittsburgh, PA | 11.82% |
| 43 | Kansas City, MO | 11.47% |
| 44 | Baltimore, MD | 11.45% |
| 45 | Virginia Beach, VA | 11.11% |
| 46 | Minneapolis, MN | 11.08% |
| 47 | San Francisco, CA | 10.76% |
| 48 | Portland, OR | 10.57% |
| 49 | Seattle, WA | 10.22% |
| 50 | Salt Lake City, UT | 8.94% |
Credit history is significant obstacle for Black applicants
Multiple factors can lead to a mortgage denial. However, the most common obstacle tripping up applicants is the debt-to-income (DTI) ratio requirement. This metric compares a borrower’s monthly debt payments to their monthly income, signaling their ability to afford the mortgage. In 2024, failing to meet the required DTI ratio accounted for 34.02% of denials for all applicants and 34.08% among Black borrowers.
Primary mortgage denial reasons
| Reason for denial | All applicants | Black applicants | Gap |
|---|---|---|---|
| Debt-to-income ratio | 34.02% | 34.08% | 0.06 |
| Credit history | 24.85% | 33.16% | 8.31 |
| Collateral | 12.12% | 8.11% | -4.01 |
| Unverifiable information | 7.21% | 6.70% | -0.50 |
| Other | 6.80% | 5.50% | -1.30 |
| Insufficient cash (down payment closing costs) | 6.17% | 5.47% | -0.70 |
| Credit application incomplete | 5.38% | 4.46% | -0.92 |
| Employment history | 1.92% | 1.76% | -0.16 |
| Missing | 1.49% | 0.72% | -0.77 |
| Mortgage insurance denied | 0.04% | 0.04% | 0.00 |
Notably, another obstacle impacts Black mortgage applicants at a much higher rate compared to all applicants and almost as often as DTI requirements: credit history. It’s the second-highest denial reason for both Black borrowers and all mortgage applicants. However, 33.16% of Black borrowers are denied for this reason, compared with 24.85% of all applicants, an 8.31 percentage point difference.
“There’s very little in life that is more expensive than crummy credit,” says Schulz, who is also the author of “Ask Questions, Save Money, Make More: How to Take Control of Your Financial Life.”
“It can cost you tens of thousands of dollars or more over the course of your life in the form of higher interest rates and more fees. It can even keep you from getting a loan altogether.
“Black Americans typically have significantly lower credit scores than other Americans. That gap is a really big deal and means that Black Americans, as a group, are going to have a far harder time getting a mortgage than white or Latino Americans.”
In 2021, the median VantageScore for Black consumers was 639, just slightly higher than the 620 minimum credit score required for nongovernment mortgages. By contrast, the median score for white consumers was almost 100 points higher, at 730. Additionally, Black and Latino consumers are more likely to be credit invisible (having little to no credit history) than those in other racial groups.
Homebuying as a Black American: Top expert tips
As this study highlights, the path to homeownership is often paved with additional hurdles for Black homebuyers. Despite — or because of — these obstacles, Black homebuyers can take proactive steps to navigate the homebuying process successfully.
- Improve your credit. Your credit history and score significantly impact your chances of mortgage approval and loan terms, so Schulz suggests focusing here. “While credit is a marathon rather than a sprint and dramatic improvement shouldn’t be expected overnight, there are things you can do to improve your score.” He suggests checking your credit reports at AnnualCreditReport.com to make sure no inaccuracies are holding down your score. Additionally, make all debt and loan payments on time, making bigger payments to bring down balances if possible — and avoid taking on new debt while applying for a mortgage. (One exception may be becoming an authorized user on the credit card account of someone with strong credit; Schulz says that move can give your score a significant boost.)
- Research available resources. Numerous resources can help homebuyers, including homeowner education courses, down payment assistance programs, first-time homebuyer loans and community and state initiatives. Your local HUD office is an excellent starting point to find available help. Additionally, nonprofits like the Black Homeownership Collaborative connect prospective Black homebuyers to assistance. Familiarizing yourself with the various programs available in your area can help bring homeownership within reach.
- Compare lenders. “One of the most important things you can do is shop around,” Schulz says. “Different lenders can make very different offers, including loan amounts, rates, fees and more, but you won’t know unless you take the time to comparison shop.” Getting quotes from at least three lenders (including a mix of lender types) can result in a lower interest rate and better mortgage terms — and you’ll have more chances to identify a mortgage company or bank with the level of customer service and product offerings you need.
- Explore loan types. Many borrowers are not familiar with all the mortgage options available. While your lender or broker will provide some information on loan types, learning about the various mortgages before applying will help you find the best one for your situation, whether it’s a first-time homebuyer loan or a mortgage refinance.
- Know your rights. Racial discrimination in mortgage lending is prohibited by law in the U.S. If you suspect a lender is treating you unfairly due to your race, you can contact your state attorney general’s office, the Consumer Financial Protection Bureau or the Federal Trade Commission.
Methodology
LendingTree analyzed purchase mortgage application records from the Federal Financial Institutions Examination Council’s Home Mortgage Disclosure Act (HMDA) 2024 datasets, retrieved on May 27, 2025.
Denial rates were calculated by dividing the number of denied mortgage applications by the total number of mortgage applications. The following application types were included in our count:
- Applications that led to a loan origination
- Applications that were approved but not accepted by a borrower
- Applications that were denied
- Applications withdrawn by applicants
- Applications closed due to being incomplete
Preapproval requests — approved or otherwise — weren’t included in our applications count.
Researchers used the U.S. Census Bureau 2023 American Community Survey with five-year estimates to identify the 50 largest metros.
View mortgage loan offers from up to 5 lenders in minutes