New Homes Are 37.5% More Expensive on Average Than Existing Homes


When given a choice, most buyers prefer brand new — whether it’s clothing, cars or houses. That fresh, never-lived-in feeling is hard to beat. But when it comes to homes, new often comes with a hefty price tag.
On average, new homes in the U.S. cost 37.5% more than existing homes — and require an additional $46,114 in annual income to cover the mortgage. However, the gap between new and existing home prices varies widely by state.
This LendingTree study breaks down new and existing property values across the country and highlights how much more income buyers need to afford a new home in each state. Read on for our full findings.
Key findings
- On average, new homes across the U.S. are 37.5% more expensive than existing homes. The average price difference is $146,581, with new homes costing a median of $537,791 and existing homes $391,210.
- Connecticut and Pennsylvania are the only states where new homes are more than double the cost of existing ones. New homes in Connecticut cost 125.9% (or $555,660) more on average than existing homes, with Pennsylvania close at 121.4% (or $361,637).
- California, Vermont and Delaware are the only states where existing homes are significantly more expensive on average than new homes. Existing homes in California cost 24.7% (or $193,682) more, ahead of Vermont at 8.8% (or $34,018) and Delaware at 8.0% (or $32,600).
- Households need an average of $46,114 more in annual income across the U.S. to afford new homes compared to existing ones. On average, households need annual incomes of $166,273 for new homes and $120,159 for existing homes.
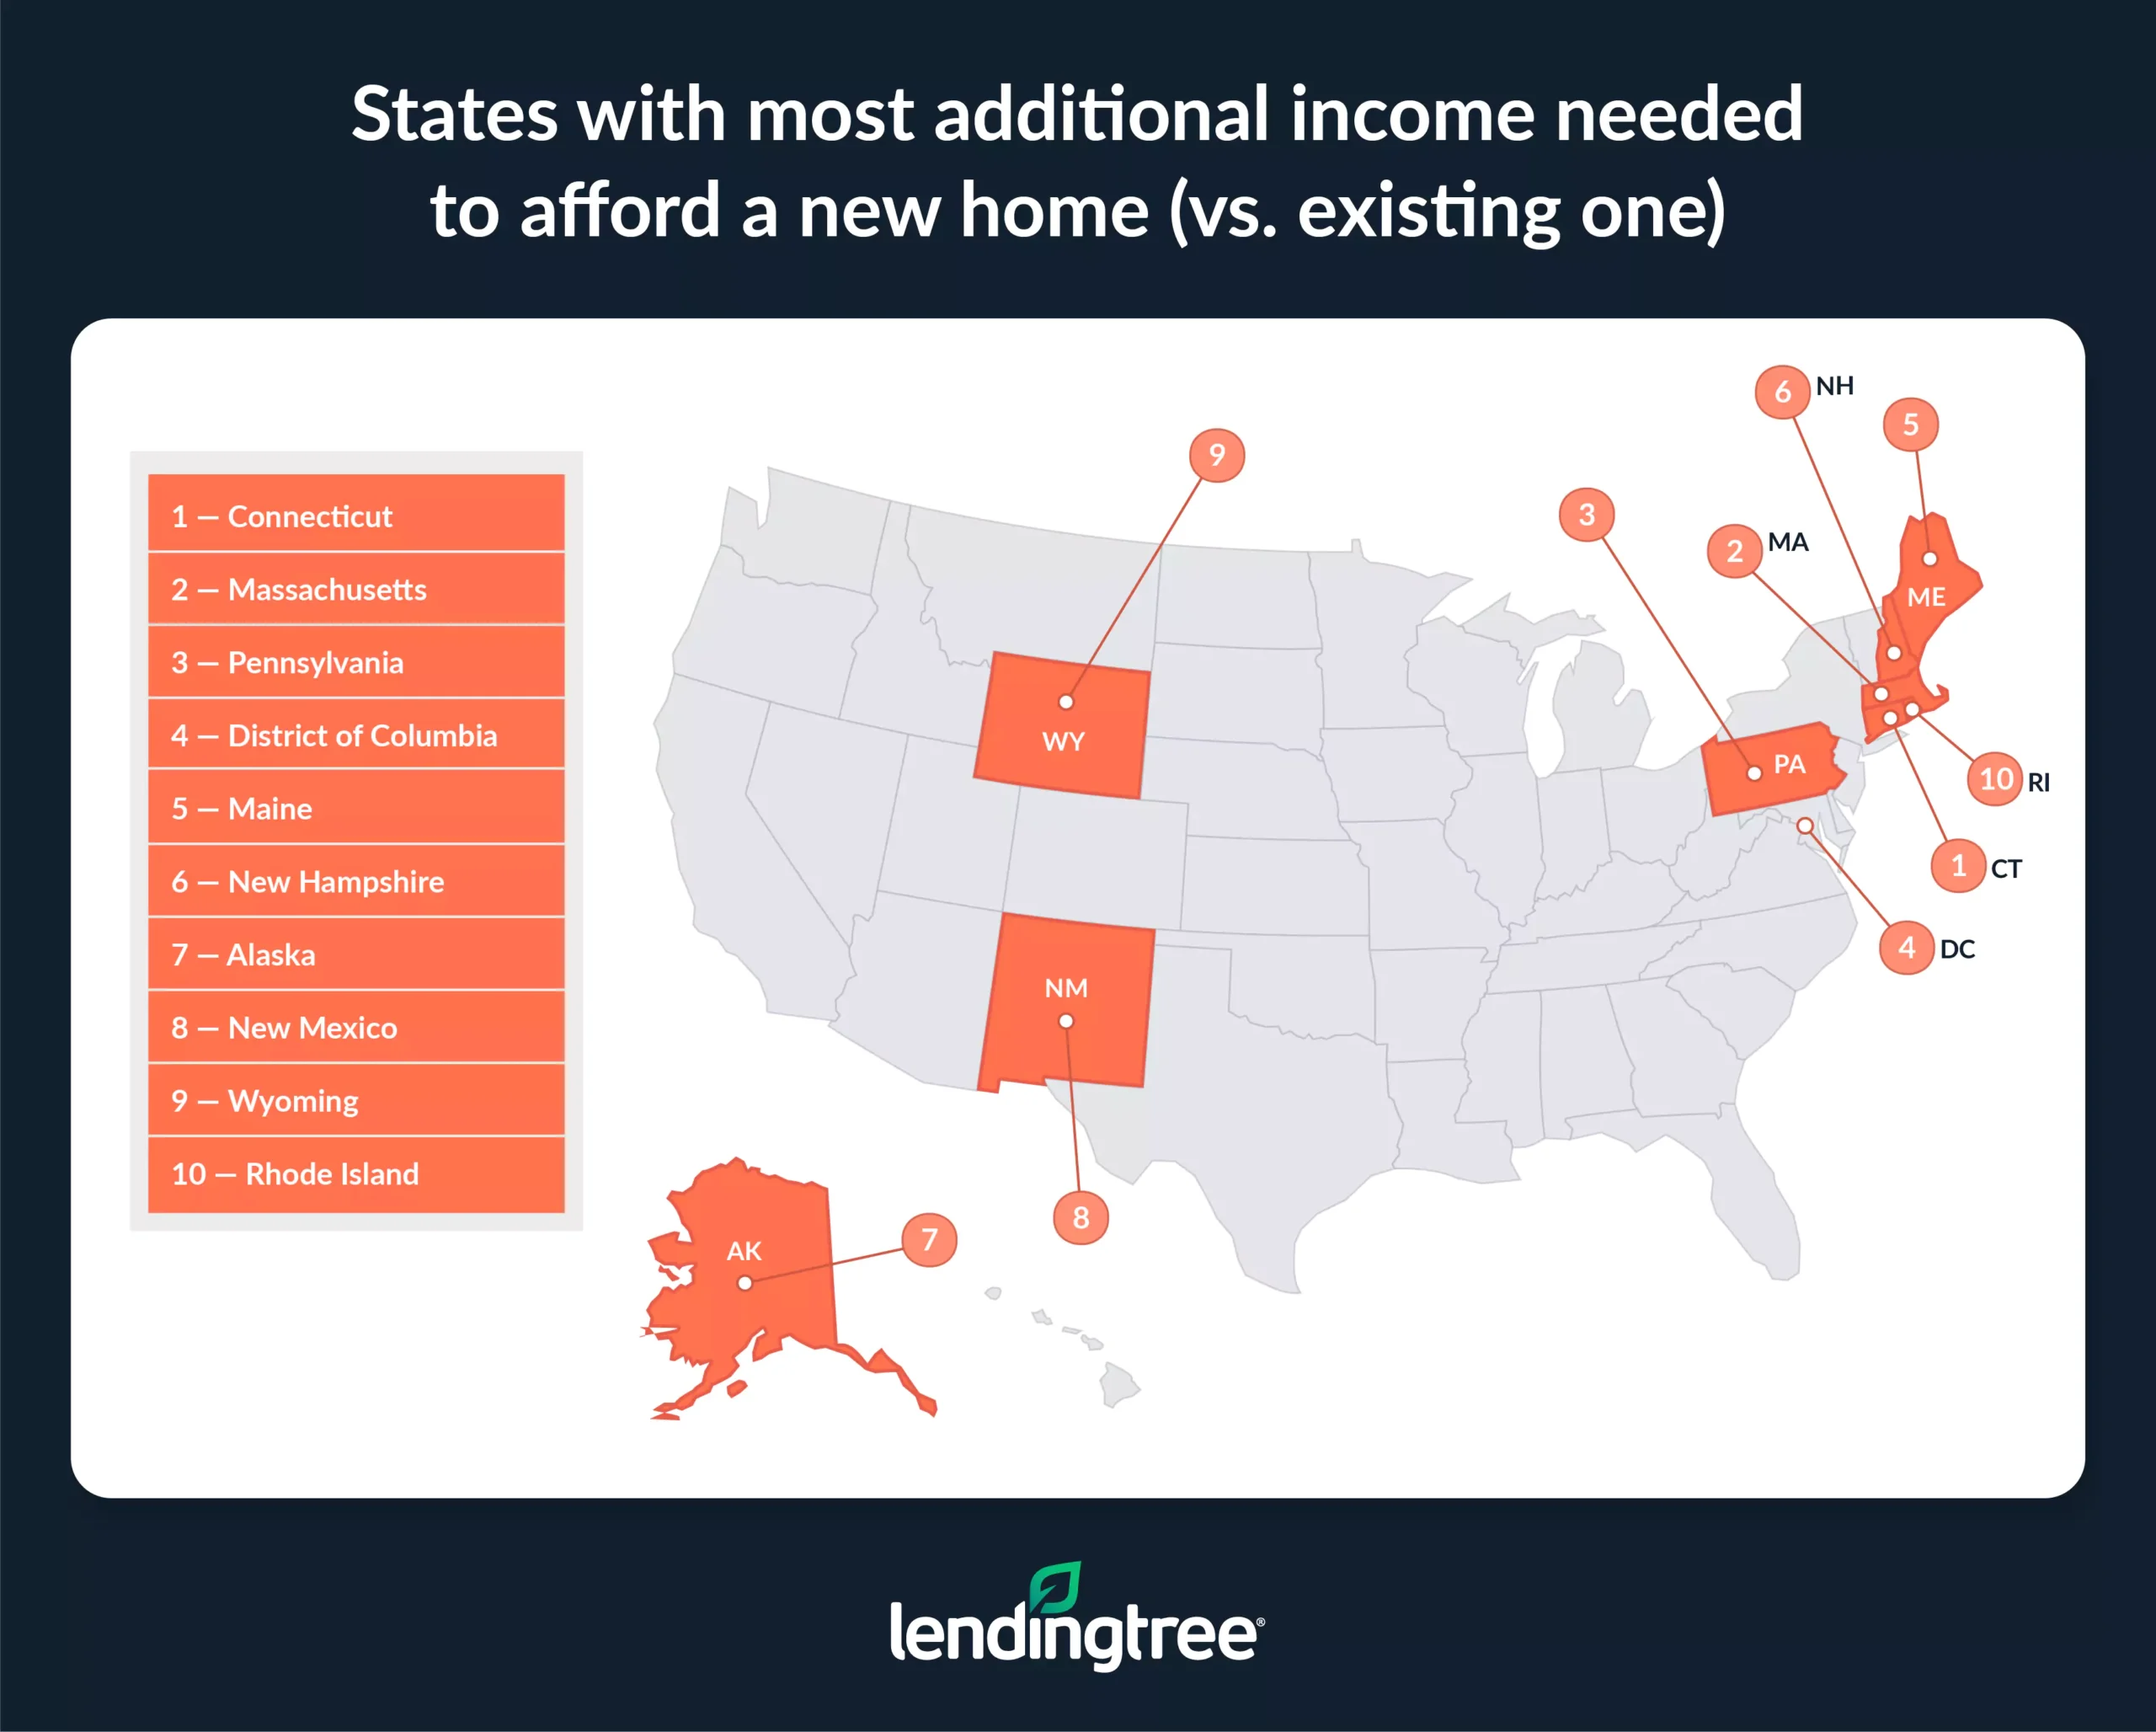
- Households in four states need $100,000-plus in additional income to afford new homes compared to existing ones. Connecticut households require an average of $188,080 more, needing incomes of $149,341 for existing homes and $337,421 for new homes. Massachusetts ($122,357 difference), Pennsylvania ($115,512) and the District of Columbia ($104,938) follow.
New homes are 37.5% more expensive on average
A newly constructed home in the U.S. costs about 37.5% more than an existing property on average. The median home value of a brand-new home is $537,791, compared with $391,210 for an existing home — a $146,581 difference.
The gap between new home prices and existing home prices is ever-shifting along with market fluctuations, although newly constructed properties are typically valued higher than existing homes. The average difference between new and existing home prices over the last five years was $26,700, according to the National Association of Home Builders (NAHB). Notably, during the decade prior (2010 to 2019), the gap was significantly wider at $66,000.
New-home values vs. existing-home values
| Median new-home value | $537,791 |
| Median existing-home value | $391,210 |
| % difference | 37.5% |
| $ difference | $146,581 |
Multiple factors contribute to the higher prices of new homes. “One of the big reasons is simple demand,” says Matt Schulz, LendingTree chief consumer finance analyst and author of “Ask Questions, Save Money, Make More: How to Take Control of Your Financial Life.”
“People are frequently willing to pay more for new homes, so prices go higher.”
Other factors contributing to the higher prices of new homes include high construction costs, limited supply, land prices and local policy. “It can be super-expensive to build a new house from scratch, thanks to high costs for labor, materials, permits, land and other aspects of the homebuilding process,” Schulz says.
In 2 states, new homes cost more than double on average
While the average price gap between an existing home and a new one is 37.5% nationally, the disparity is much more pronounced in some states, exacerbating affordability challenges. In Connecticut, homebuyers purchasing an existing property can expect to pay a median price of $441,210; however, shoppers in the market for a newly constructed home would have to shell out an additional $555,660, or $996,870 total — a 125.9% increase.
Pennsylvania is close behind, with a 121.4% price difference. Borrowers in the Keystone State pay a median price of $297,831 for an existing home and $659,468 for a new one.
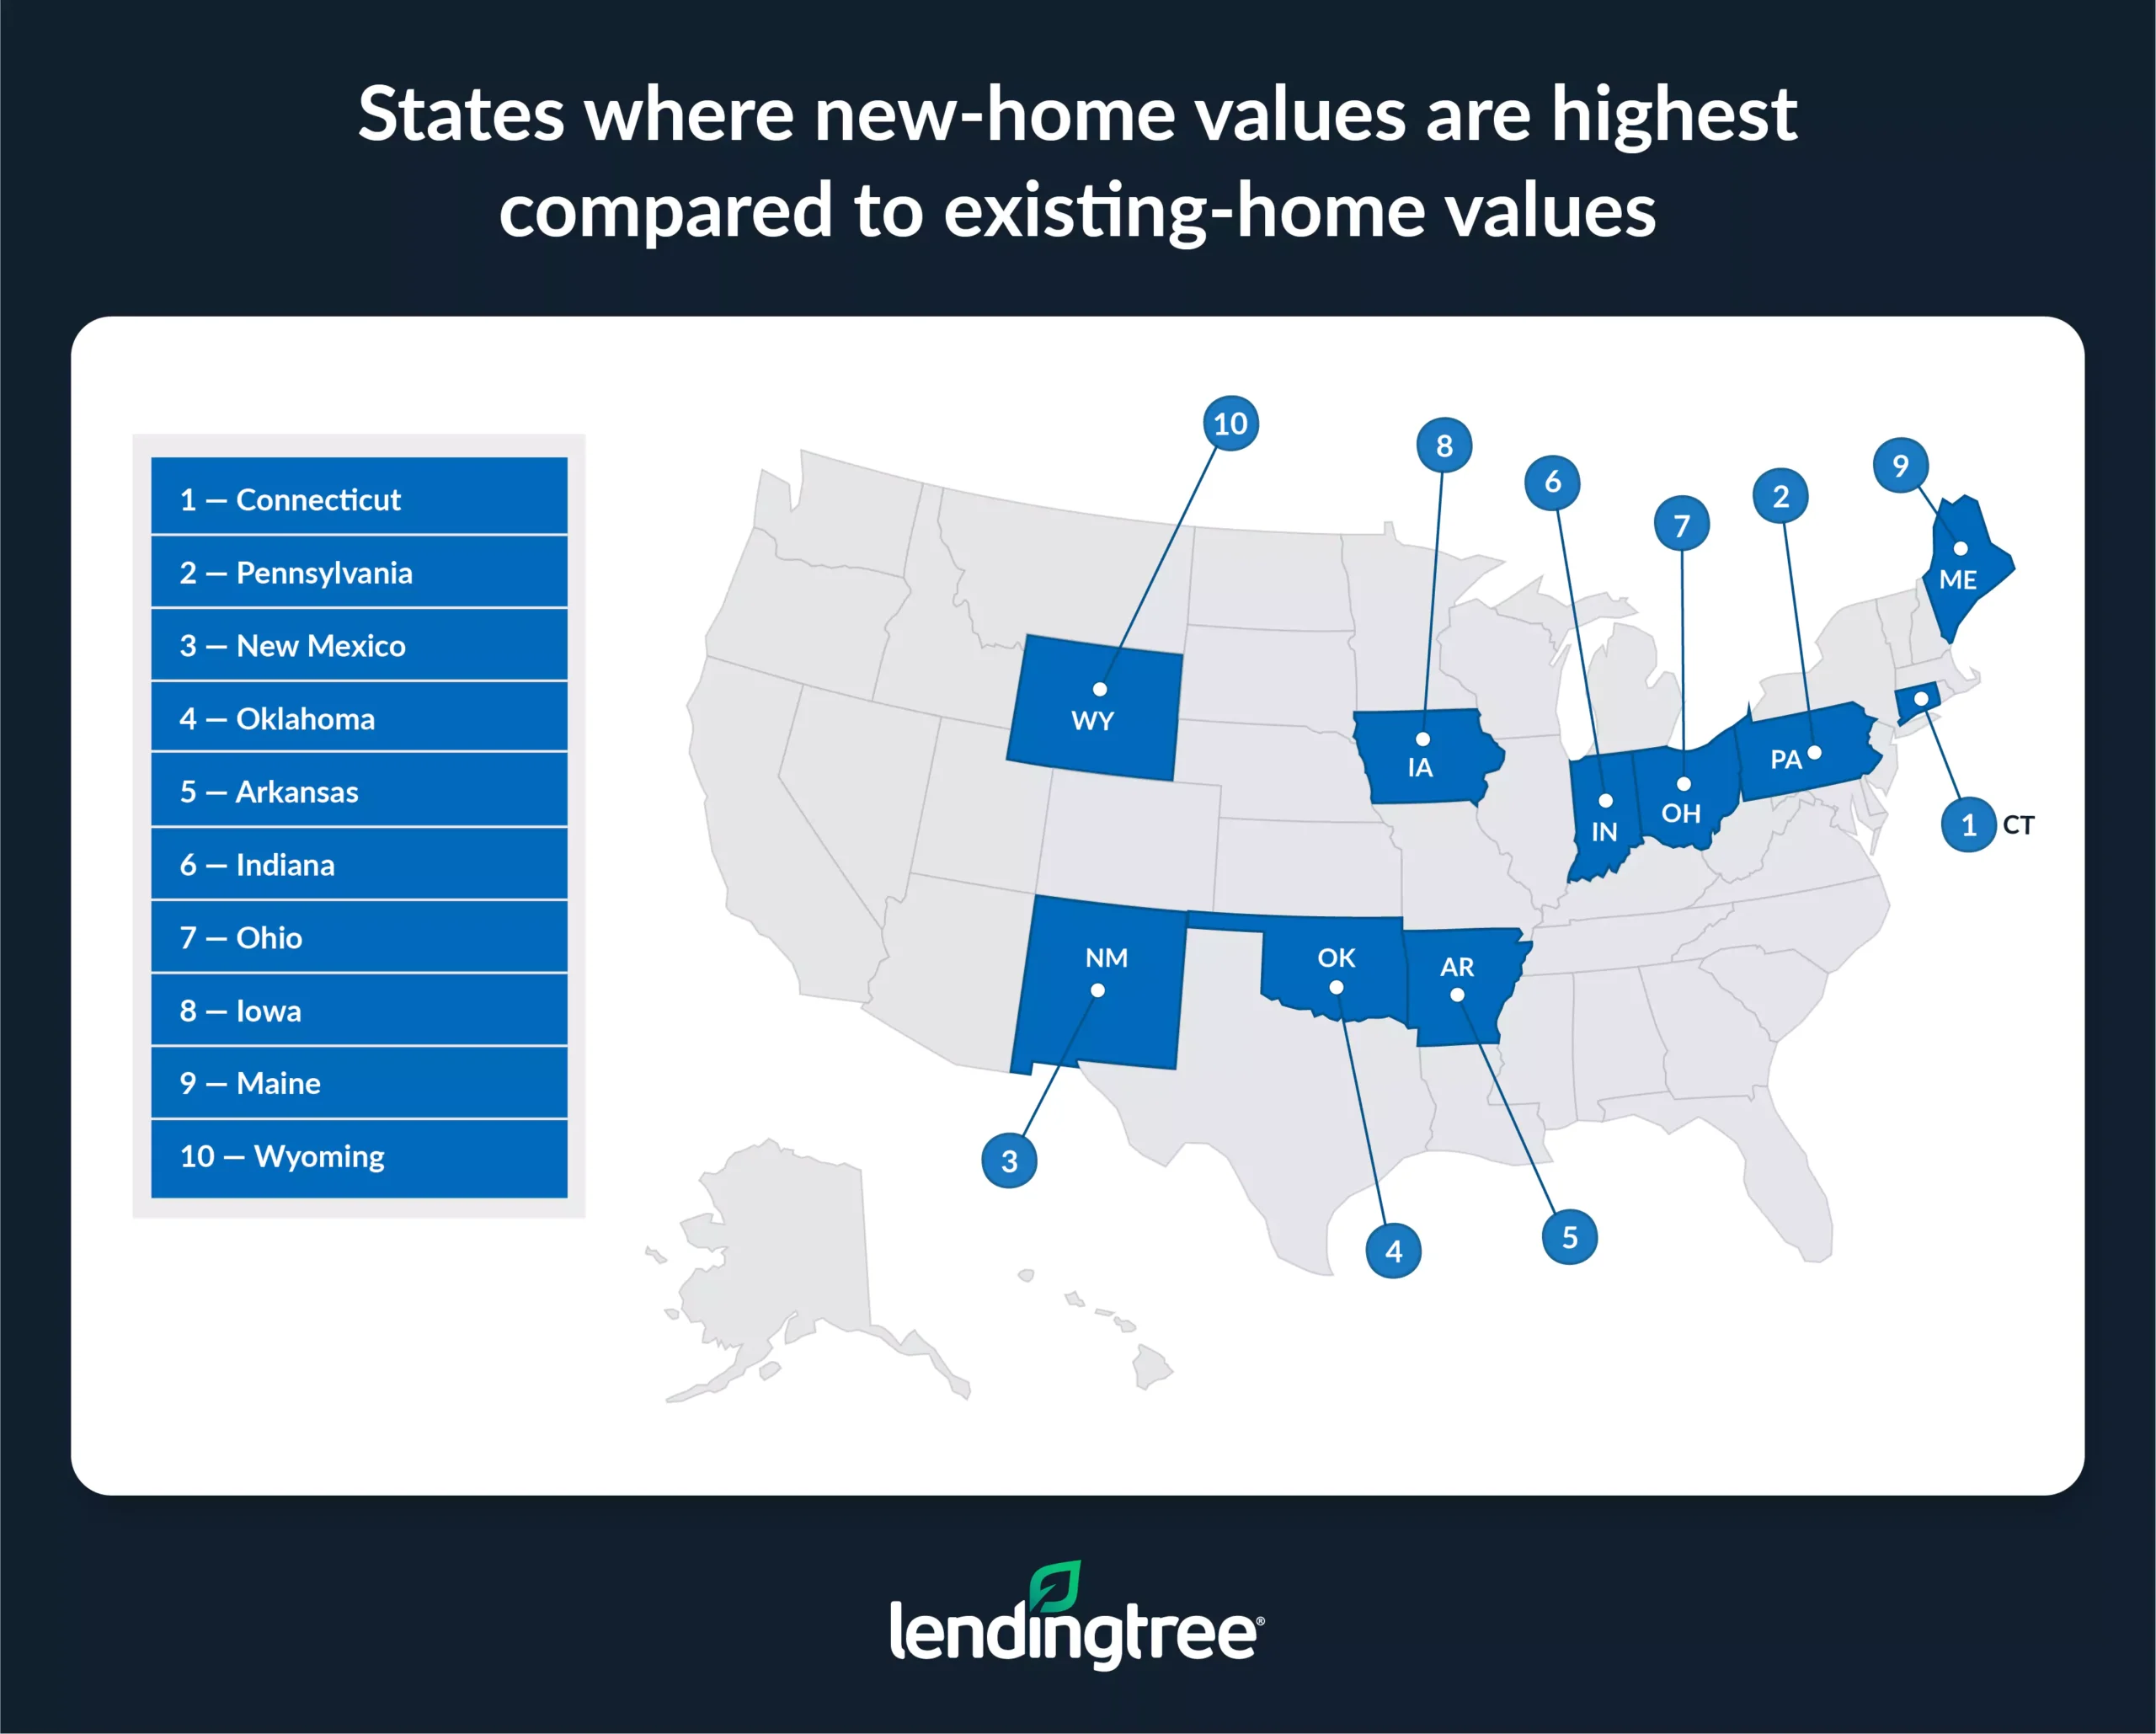
Connecticut and Pennsylvania are the only states where new-home prices are more than double those of existing properties on average. One factor is likely geography, as well as a higher cost of living in those states compared to the rest of the country. New-construction homes tend to be more expensive in the Northeast, with a median price of $784,900, according to NAHB.
Additionally, in Connecticut, pressures on the home construction industry — including strict building requirements, lengthy local approvals, limited land availability and a shortage of skilled trade workers — have led to a steady decline of newly constructed single-family homes in recent years.
Restrictive local and state regulations contribute to the high cost of building in Pennsylvania as well, resulting in low inventory and high prices for new homes.
Existing homes significantly more expensive in California
Six states buck the national trend of higher-priced new homes, with existing properties priced above new builds. In California, newly constructed homes have a median price of $591,116, while existing homes cost $784,798 — 24.7%, or $193,682, more.
California’s double-digit gap between new and existing home values is the largest discrepancy in the country. The Golden State has struggled to keep up with housing demands for decades, although the disparity between supply and demand has started to slowly close thanks to a slight building boom as a result of the COVID-19 pandemic.
Still, the roadblocks to building new homes keep inventory low. Expensive land, permit delays, local fees, high material costs and labor shortages have limited new construction and increased the competition for existing homes.
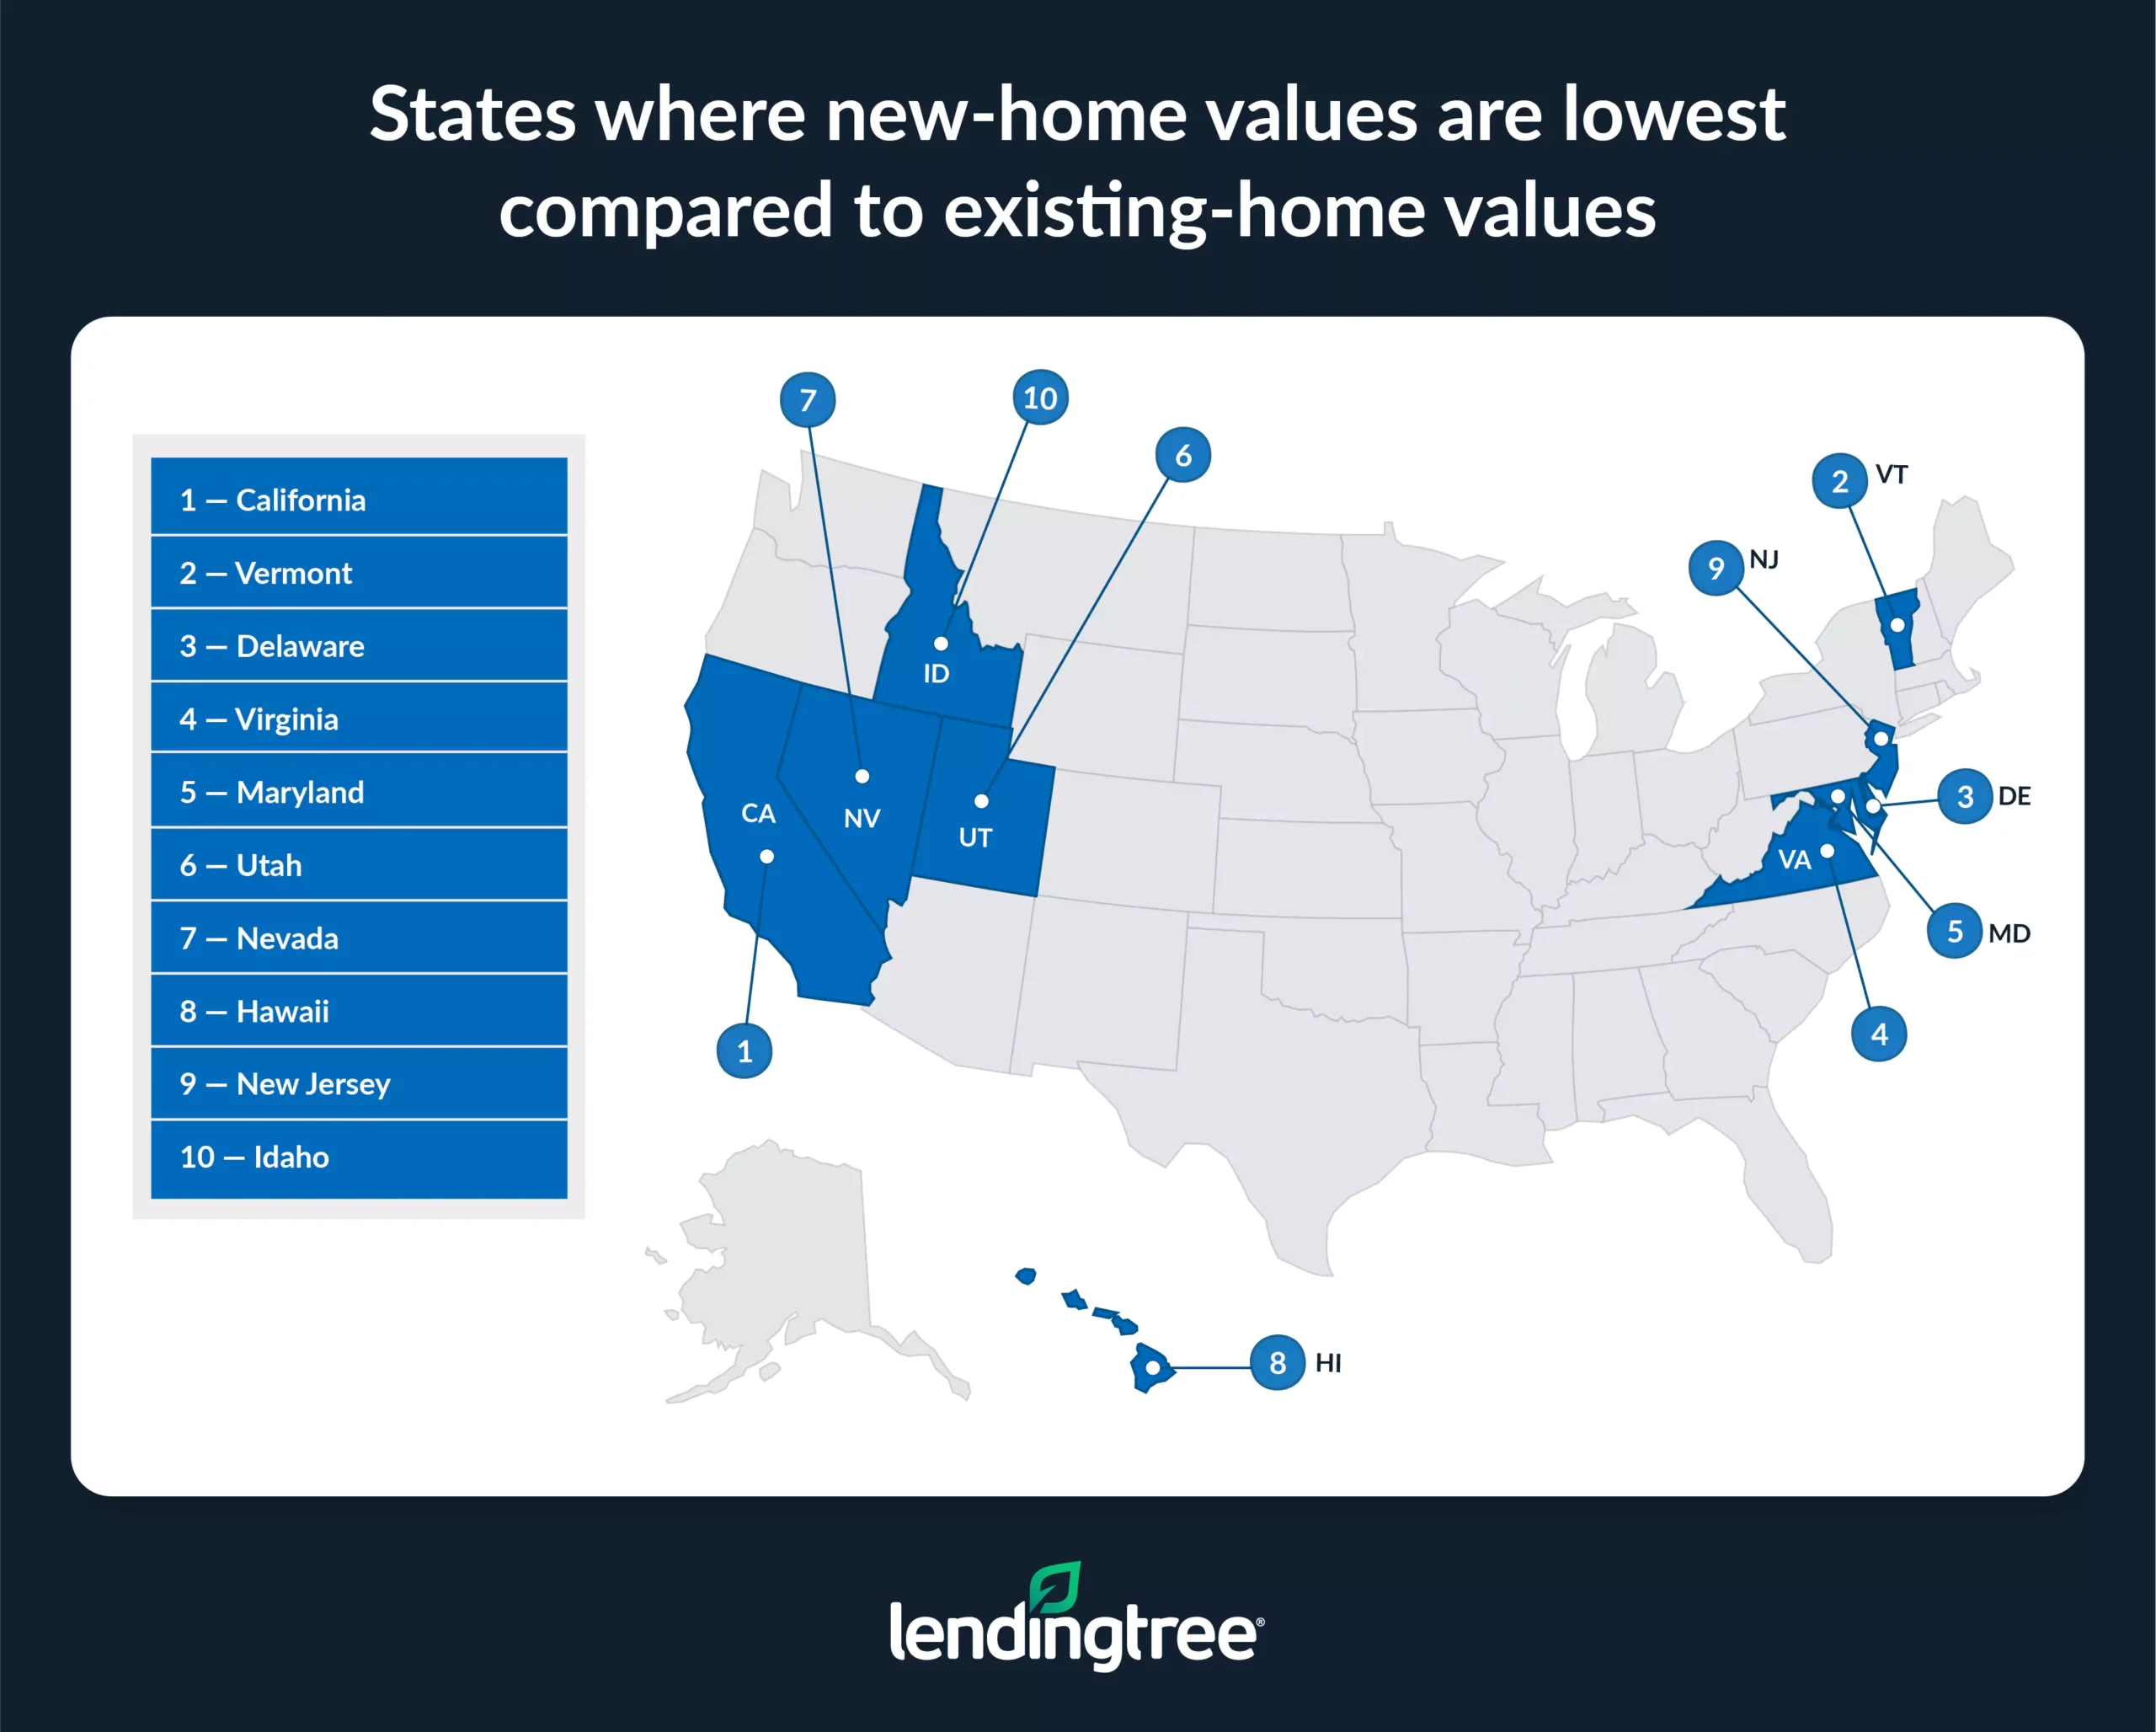
Vermont is a distant second behind California. Households in this New England state can expect to pay a median price of $352,739 for a new home but would have to come up with $386,757 for an existing property — 8.8%, or $34,018, more.
Delaware follows with the third-highest discrepancy between new and existing home values: $373,666 versus $406,266, an 8.0%, or $32,600, difference. Virginia, Maryland and Utah households also pay more for existing homes than new-construction properties.
Full rankings: States where new homes are most/least expensive compared to existing homes
| Rank | State | New-home value | Existing-home value | % difference | $ difference |
|---|---|---|---|---|---|
| 1 | Connecticut | $996,870 | $441,210 | 125.9% | $555,660 |
| 2 | Pennsylvania | $659,468 | $297,831 | 121.4% | $361,637 |
| 3 | New Mexico | $565,030 | $283,502 | 99.3% | $281,528 |
| 4 | Oklahoma | $453,724 | $227,885 | 99.1% | $225,839 |
| 5 | Arkansas | $418,068 | $213,318 | 96.0% | $204,750 |
| 6 | Indiana | $483,996 | $256,449 | 88.7% | $227,547 |
| 7 | Ohio | $480,808 | $256,057 | 87.8% | $224,751 |
| 8 | Iowa | $437,430 | $233,707 | 87.2% | $203,723 |
| 9 | Maine | $682,223 | $366,234 | 86.3% | $315,989 |
| 10 | Wyoming | $613,459 | $334,595 | 83.3% | $278,864 |
| 11 | West Virginia | $336,254 | $183,971 | 82.8% | $152,283 |
| 12 | Louisiana | $407,316 | $224,921 | 81.1% | $182,395 |
| 13 | Kansas | $457,073 | $256,430 | 78.2% | $200,643 |
| 14 | Alaska | $691,025 | $390,146 | 77.1% | $300,879 |
| 15 | Wisconsin | $520,401 | $316,242 | 64.6% | $204,159 |
| 16 | North Dakota | $437,781 | $268,629 | 63.0% | $169,152 |
| 17 | Alabama | $378,732 | $234,683 | 61.4% | $144,049 |
| 18 | New Hampshire | $772,191 | $480,566 | 60.7% | $291,625 |
| 18 | Massachusetts | $1,051,359 | $654,389 | 60.7% | $396,970 |
| 20 | Kentucky | $371,309 | $233,985 | 58.7% | $137,324 |
| 21 | Michigan | $430,566 | $272,481 | 58.0% | $158,085 |
| 22 | Missouri | $415,171 | $262,861 | 57.9% | $152,310 |
| 23 | Illinois | $469,154 | $305,208 | 53.7% | $163,946 |
| 24 | District of Columbia | $1,072,855 | $712,034 | 50.7% | $360,821 |
| 25 | Mississippi | $275,333 | $184,056 | 49.6% | $91,277 |
| 26 | Rhode Island | $727,933 | $494,799 | 47.1% | $233,134 |
| 27 | South Carolina | $443,364 | $308,294 | 43.8% | $135,070 |
| 28 | New York | $690,141 | $498,059 | 38.6% | $192,082 |
| 29 | Texas | $445,713 | $327,513 | 36.1% | $118,200 |
| 30 | South Dakota | $385,538 | $290,425 | 32.7% | $95,113 |
| 31 | Nebraska | $354,000 | $271,031 | 30.6% | $82,969 |
| 32 | Montana | $557,796 | $428,006 | 30.3% | $129,790 |
| 33 | Oregon | $659,636 | $508,988 | 29.6% | $150,648 |
| 34 | North Carolina | $429,482 | $342,464 | 25.4% | $87,018 |
| 35 | Minnesota | $442,900 | $356,368 | 24.3% | $86,532 |
| 36 | Tennessee | $406,090 | $333,633 | 21.7% | $72,457 |
| 37 | Florida | $474,454 | $404,465 | 17.3% | $69,989 |
| 38 | Georgia | $415,921 | $361,867 | 14.9% | $54,054 |
| 39 | Washington | $700,683 | $625,313 | 12.1% | $75,370 |
| 40 | Colorado | $639,673 | $581,408 | 10.0% | $58,265 |
| 41 | Arizona | $487,251 | $444,009 | 9.7% | $43,242 |
| 42 | Idaho | $487,638 | $459,760 | 6.1% | $27,878 |
| 43 | New Jersey | $583,231 | $556,919 | 4.7% | $26,312 |
| 44 | Hawaii | $942,345 | $921,790 | 2.2% | $20,555 |
| 45 | Nevada | $501,055 | $498,111 | 0.6% | $2,944 |
| 46 | Utah | $568,425 | $570,084 | -0.3% | -$1,659 |
| 47 | Maryland | $460,200 | $461,911 | -0.4% | -$1,711 |
| 48 | Virginia | $428,733 | $437,263 | -2.0% | -$8,530 |
| 49 | Delaware | $373,666 | $406,266 | -8.0% | -$32,600 |
| 50 | Vermont | $352,739 | $386,757 | -8.8% | -$34,018 |
| 51 | California | $591,116 | $784,798 | -24.7% | -$193,682 |
Households need significantly more income to afford new homes
LendingTree researchers utilized data from the NAHB “Households Being Priced Out of the Housing Market” report to show the difference in how much annual income a household needs to qualify for mortgages on median-priced new and existing homes.
U.S. homebuyers need an average annual income of $166,273 to purchase a median-priced newly constructed home, $46,114 more than the $120,159 required for an existing property. “That’s a huge difference,” Schulz says. “You’re not likely to make that amount up in a hurry by asking for a raise or starting a side hustle.” Unfortunately, “It means that new homes are simply out of reach for many Americans.”
You’re not likely to make that amount up in a hurry by asking for a raise or starting a side hustle. It means that new homes are simply out of reach for many Americans.

Average annual income needed to afford new homes vs. existing homes
| Income needed to buy a new home | $166,273 |
| Income needed to buy an existing home | $120,159 |
| $ difference | $46,114 |
Households in 4 states need additional six figures to afford new homes
In four states, homebuyers looking to purchase a newly constructed home rather than an existing property would have to earn at least an additional $100,000 in annual income to afford the mortgage. Connecticut buyers would need nearly $200,000 more. Households in the Nutmeg State need an average yearly income of $149,341 for an existing home and $337,421 for a new one — a difference of $188,080.
Homebuyers in neighboring Massachusetts need $122,357 more in annual income for a new home there, requiring $324,058, versus $201,701 for an existing property.
Pennsylvania, with a difference of $115,512, and the District of Columbia ($104,938) follow. The average annual income needed in the nation’s capital for a new home is $312,021, versus $207,083 for an existing property.
In Massachusetts, newly implemented building codes meant to combat climate change could be a factor in high construction costs and increased new home prices, according to a report from the Home Builders & Remodelers Association of Massachusetts. In the District of Columbia, limited land availability drives up the cost of new construction and the income required to obtain it.
By contrast, homebuyers in six states can purchase a new home with a lower annual income than that needed for an existing property. California residents can qualify for a new home with $173,786 in annual income, $56,942 less than the $230,728 required for an existing one.
Other states where borrowers need less money to qualify for a new home than an existing property are:
- Vermont: $11,093
- Delaware: $9,457
- Virginia: $2,548
- Maryland: $526
- Utah: $477
Full rankings: States where households require more/less in income to afford new home
| Rank | State | Income required for new home | Income required for existing home | $ difference |
|---|---|---|---|---|
| 1 | Connecticut | $337,421 | $149,341 | $188,080 |
| 2 | Massachusetts | $324,058 | $201,701 | $122,357 |
| 3 | Pennsylvania | $210,643 | $95,131 | $115,512 |
| 4 | District of Columbia | $312,021 | $207,083 | $104,938 |
| 5 | Maine | $209,246 | $112,328 | $96,918 |
| 6 | New Hampshire | $251,814 | $156,714 | $95,100 |
| 7 | Alaska | $216,335 | $122,141 | $94,194 |
| 8 | New Mexico | $170,000 | $85,297 | $84,703 |
| 9 | Wyoming | $182,836 | $99,723 | $83,113 |
| 10 | Rhode Island | $230,293 | $156,537 | $73,756 |
| 11 | Ohio | $155,479 | $82,801 | $72,678 |
| 12 | Oklahoma | $145,151 | $72,903 | $72,248 |
| 13 | Indiana | $148,438 | $78,651 | $69,787 |
| 14 | Iowa | $144,287 | $77,089 | $67,198 |
| 15 | Kansas | $152,145 | $85,357 | $66,788 |
| 16 | Wisconsin | $167,775 | $101,955 | $65,820 |
| 17 | New York | $224,937 | $162,332 | $62,605 |
| 18 | Arkansas | $126,524 | $64,559 | $61,965 |
| 19 | Louisiana | $127,919 | $70,637 | $57,282 |
| 20 | Illinois | $163,127 | $106,122 | $57,005 |
| 21 | North Dakota | $139,577 | $85,647 | $53,930 |
| 22 | Michigan | $137,934 | $87,291 | $50,643 |
| 23 | Missouri | $130,113 | $82,380 | $47,733 |
| 24 | West Virginia | $100,302 | $54,877 | $45,425 |
| 25 | Oregon | $196,744 | $151,812 | $44,932 |
| 26 | Alabama | $112,026 | $69,417 | $42,609 |
| 27 | Kentucky | $114,137 | $71,925 | $42,212 |
| 28 | South Carolina | $130,269 | $90,583 | $39,686 |
| 29 | Texas | $148,980 | $109,472 | $39,508 |
| 30 | Montana | $166,766 | $127,962 | $38,804 |
| 31 | South Dakota | $123,002 | $92,657 | $30,345 |
| 32 | Mississippi | $86,668 | $57,936 | $28,732 |
| 33 | Nebraska | $120,460 | $92,227 | $28,233 |
| 34 | Minnesota | $140,018 | $112,662 | $27,356 |
| 35 | North Carolina | $127,842 | $101,940 | $25,902 |
| 36 | Washington | $208,583 | $186,146 | $22,437 |
| 37 | Florida | $146,183 | $124,619 | $21,564 |
| 38 | Tennessee | $118,918 | $97,700 | $21,218 |
| 39 | Colorado | $186,523 | $169,533 | $16,990 |
| 40 | Georgia | $126,686 | $110,222 | $16,464 |
| 41 | Arizona | $139,946 | $127,526 | $12,420 |
| 42 | New Jersey | $200,639 | $191,587 | $9,052 |
| 43 | Idaho | $140,682 | $132,639 | $8,043 |
| 44 | Hawaii | $262,204 | $256,485 | $5,719 |
| 45 | Nevada | $143,929 | $143,083 | $846 |
| 46 | Utah | $163,491 | $163,968 | -$477 |
| 47 | Maryland | $141,574 | $142,100 | -$526 |
| 48 | Virginia | $128,076 | $130,624 | -$2,548 |
| 49 | Delaware | $108,392 | $117,849 | -$9,457 |
| 50 | Vermont | $115,024 | $126,117 | -$11,093 |
| 51 | California | $173,786 | $230,728 | -$56,942 |
6 tips on deciding between a new house and existing one
Anyone could make a strong case for buying either a brand-new or an existing home. Both options have distinct pros and cons: Newly built homes offer modern conveniences and customization, while older homes often come with charm, character and established communities. While 61% of homebuyers say they prefer new construction, according to NAHB, others are drawn to the unique appeal of preowned properties.
“You would be well-served to keep an open mind when it comes to choosing between new and existing homes because there are so many different factors that go into making a place right for you,” Schulz says.
Consider these tips when selecting the path for your homebuying journey.
- Clarify your homeownership goals. A good place to start is to reflect on your homebuying priorities. For example, are you looking for your forever home, a starter house or a short-term stop? Do you want to settle in an established neighborhood or help shape a new one? Aligning your goals with your home choice can help you decide which type better suits your lifestyle and timeline.
- Calculate the full upfront cost. Listing prices are just the beginning. While new homes are typically more expensive than existing properties in most states, homebuilders often offer incentives that can significantly reduce the mortgage interest rate or offset upfront fees. On the other hand, existing homes may have lower closing costs. Be sure to factor in and compare the total upfront outlay, including closing fees, potential landscaping or appliance purchases and any other expenses required to make the home move-in ready.
- Weigh ongoing expenses. New homes typically have lower utility and maintenance costs, thanks to modern and efficient systems and building materials, while existing properties could have aging home systems or a roof that will need replacement soon. Additionally, homeowners insurance tends to be cheaper for new homes; however, property taxes may be higher, as new homes are assessed at the current market rate. Weigh the costs of routine maintenance and repairs, taxes, homeowners insurance and other recurring home expenses when choosing between a new home and an existing one.
- Consider the age of the home. “All existing homes are not created equal,” Schulz says. “For example, there may be a huge difference between a 10-to-20-year-old existing home and a 50-to-75-year-old home. Being open to considering all potential opportunities on a case-by-case basis can help you ensure you’ll find the right home for you.”
- Know your tolerance for repairs. “It’s so important to know yourself when shopping for a home,” Schulz says. “Every home requires work, but existing ones can bring even greater challenges just because of the wear and tear they’ve endured through the years.” If you love a project and have the time and resources to renovate, an older home might be perfect. If not, the move-in-ready nature of new construction may save stress in the long run.
- Look beyond price. “Cost is obviously a big deal, but so are things like the length of your commute and the quality of schools in the area,” Schulz says. A lower-cost home may not be worth it if it negatively impacts your daily quality of life.
Methodology
Researchers utilized the National Association of Home Builders (NAHB) “Households Being Priced Out of the Housing Market” report to identify median new-home prices in 2025 and the income needed to qualify for mortgages. An income-to-price difference was determined using these figures.
For existing-home values, researchers utilized U.S. Census Bureau 2023 American Community Survey (ACS) microdata for median values by state. 2023 values were adjusted to 2025 values using the Federal Housing Finance Agency (FHFA) House Price Index. The calculated 2025 median-home values were then compared to 2025 new-home values to calculate the percentage and dollar differences by state.
To estimate the household income needed for existing homes, the previously calculated income-to-price ratio from new-home prices was applied to the adjusted 2025 values for existing homes. We then compared the household income required to buy new homes and existing homes by state.
View mortgage loan offers from up to 5 lenders in minutes