Falling Mortgage Rates Could Save Homebuyers $40,000+ Over Lifetime of Loan
Buying a home has never been an easy journey, and today’s high prices and tight inventory make the process even more challenging. But there’s a silver lining for buyers: Mortgage rates are moving in the right direction.
According to a LendingTree analysis, the average APR for 30-year, fixed-rate mortgages across the U.S. dropped by 0.51 percentage points between July 2024 and July 2025. That decline brings the average APR to 6.68% — from 7.19% a year earlier — and could save borrowers roughly $40,000 over the life of a loan.
Key findings
- 30-year, fixed-rate mortgage APRs decreased by an average of 0.51 percentage points across the U.S. between July 2024 and July 2025. In July 2025, the average APR was 6.68%, down from 7.19% in July 2024.
- Across the U.S., falling APRs caused calculated mortgage payments to decrease by an average of $111.71 a month. That amounts to an average of $1,340.56 in annual savings and $40,216.81 in savings over 30 years.
- Calculated mortgage payments fell the most in the District of Columbia, Massachusetts and California. These states saw monthly savings of $213.85, $210.42 and $209.26, respectively, averaging $76,023.34 in savings over 30 years.
- Minnesota, South Dakota and Wisconsin saw the smallest payment decreases. Monthly savings in these states were $24.40, $25.40 and $31.08, respectively. This still translates to an average savings of $9,705.89 over 30 years.
- North Dakota was the only state where mortgage payments increased. Average APRs rose by 0.03 percentage points from 6.81% in July 2024 to 6.84% in July 2025, raising the average monthly payment by $5.16 and resulting in $1,858.24 in additional costs over 30 years.
Mortgage rates are down — here’s how much that can save you
Mortgage interest rates have declined over the past year. The average rate across the U.S. on a 30-year, fixed-rate mortgage in July 2025 was 6.68%, a decrease of 0.51 percentage points from 7.19% in July 2024.
One factor contributing to falling mortgage rates is multiple cuts to the federal funds rate in fall 2024. The Federal Reserve doesn’t directly determine mortgage rates; however, movements in the federal funds rate, as well as other economic factors, influence their direction. A quarter-point cut in September — the first of 2025 — and the potential for more decreases this year have injected confidence that borrowing costs will ease.
Declining mortgage rates are more than just numbers — they mean more affordable homeownership for borrowers. The average calculated monthly mortgage payment across the U.S. was $111.71 lower in July 2025 than in July 2024, providing households with $1,340.56 in annual savings and a remarkable $40,216.81 in savings over the life of a 30-year mortgage.
How changing APRs impact calculated mortgage payments across U.S.
| Stats | July 2024 | July 2025 | Difference |
|---|---|---|---|
| Avg. APR | 7.19% | 6.68% | 0.51 percentage points |
| Calculated monthly payment | $2,157.21 | $2,045.49 | $111.71 |
“These savings are big,” says Matt Schulz, LendingTree chief consumer finance analyst and author of “Ask Questions, Save Money, Make More: How to Take Control of Your Financial Life.” “Rate declines not only can help make homeownership more attainable, but they also can help consumers balance their financial goals.
“That extra $111 a month can give a typical American household a little bit of financial breathing room that they’re so desperate for during these expensive times. It can mean a little extra cash in the emergency fund or toward a credit card payment. It can mean a little extra to put toward investments or other long-term goals. This stuff matters.”
Calculated mortgage payments fell most in District of Columbia
Borrowers in the nation’s capital experienced the largest decrease in average calculated monthly mortgage payments, dropping $213.85 from $3,160.51 in July 2024 to $2,946.66 in July 2025. This amounts to $2,566.14 in annual savings and $76,984.34 over 30 years. Mortgage rates decreased by 0.69 percentage points on average in the District of Columbia.
Massachusetts and California had the next highest calculated payment decreases, dropping $210.42 and $209.26, respectively. Mortgage rates decreased 0.72 percentage points in Massachusetts and 0.64 percentage points in California. The declines result in $2,525.09 in annual savings and $75,752.61 over 30 years for Massachusetts borrowers, and $2,511.10 in annual savings and $75,333.06 in lifetime savings for California borrowers.
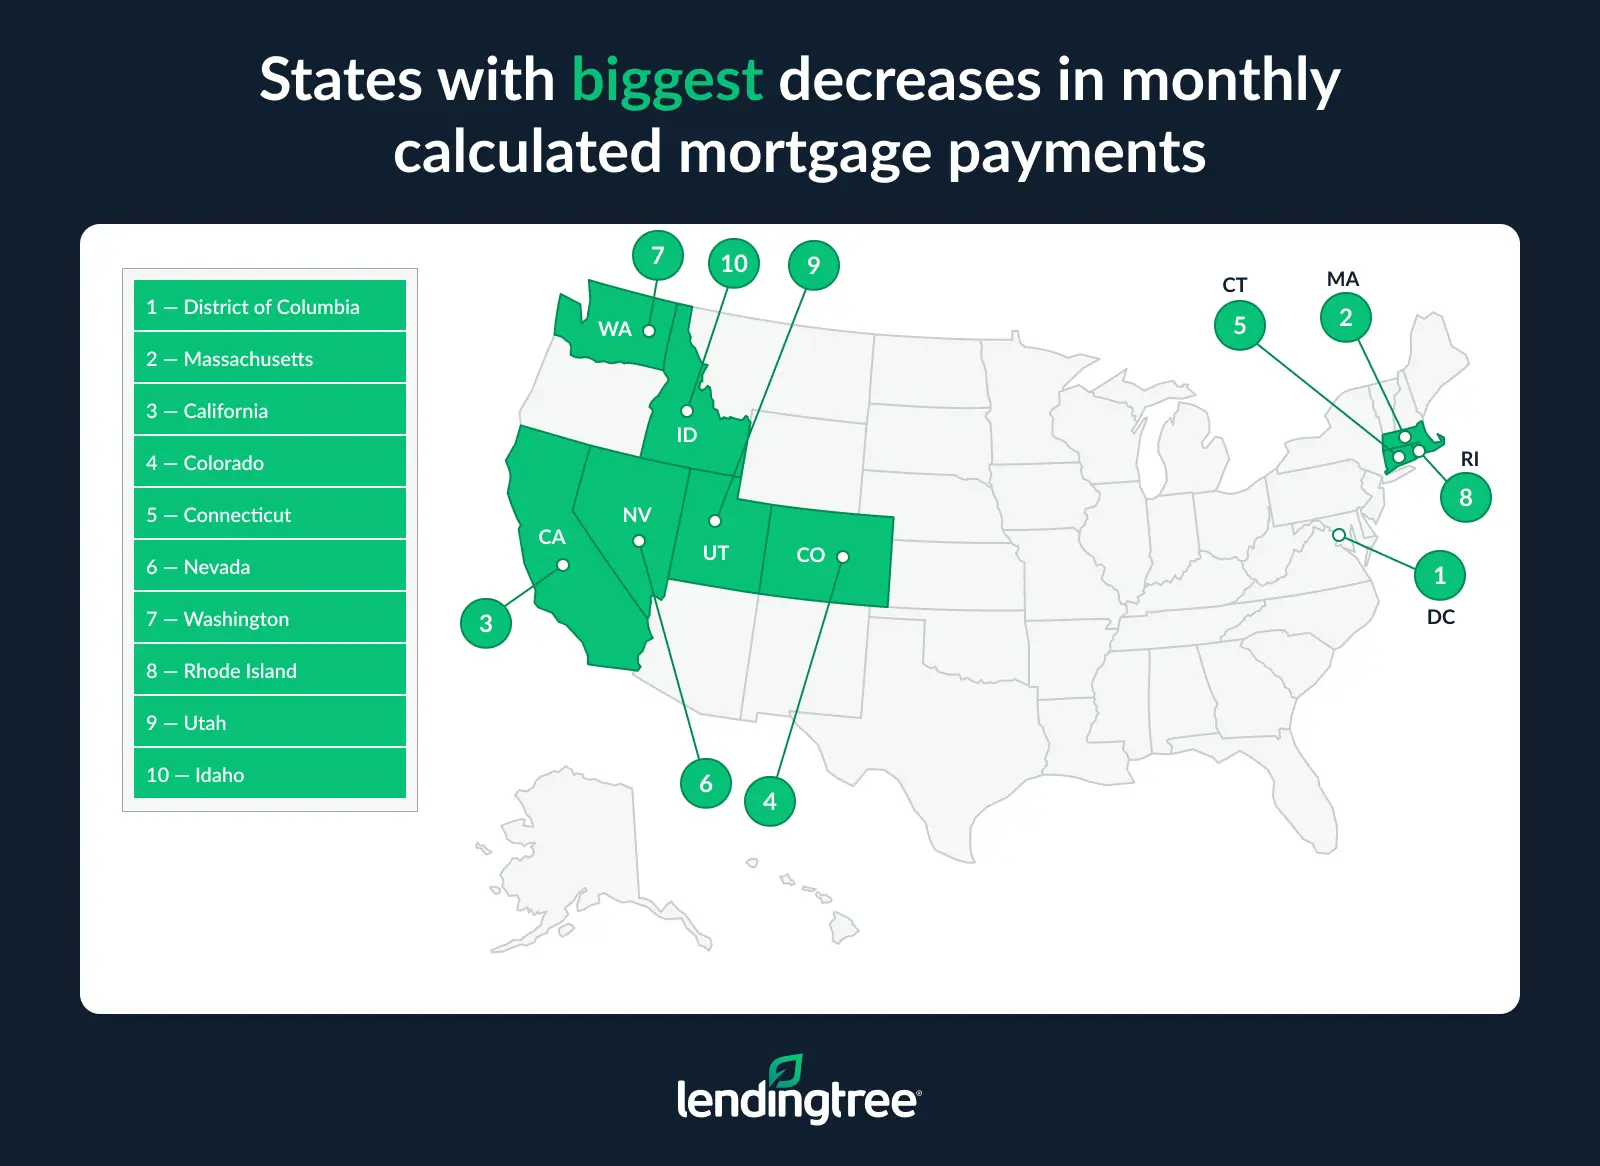
Mortgage rate decreases in the District of Columbia, Massachusetts and California were above the average across the U.S. of 0.51 percentage points, resulting in greater potential savings for borrowers in those locations. But that only tells part of the story, Schulz says. The higher mortgage payment savings are also connected to higher home prices and larger loan amounts.
“Those are three very expensive places to live, especially when it comes to housing,” Schulz says. “Because homes are so expensive there, the dollar savings from a small rate decrease will be greater than they would be in other locations.”
For context, the average mortgage amount across the U.S. is $318,245, which is significantly lower than average loan amounts in the District of Columbia ($463,298), Massachusetts ($436,092) and California ($489,476). Since the principal amounts are higher, the monthly dollar savings are significantly larger.
Calculated mortgage payments fell least in Minnesota
Minnesota borrowers saw the smallest drop in mortgage payments, averaging $24.40 a month. But every bit helps; the decrease amounts to $292.81 in annual savings and $8,784.45 over 30 years — a meaningful difference when money is tight.
South Dakota saw the next smallest payment decrease — $25.40 monthly, $304.76 annually and $9,142.86 over the life of a 30-year mortgage. Wisconsin follows with average monthly savings of $31.08, which amounts to $373.01 annually and $11,190.38 over 30 years.
Minnesota, South Dakota and Wisconsin had the lowest rate decreases — 0.12, 0.15 and 0.17 percentage points, respectively — significantly lower than the average across the U.S. (0.51 percentage points).
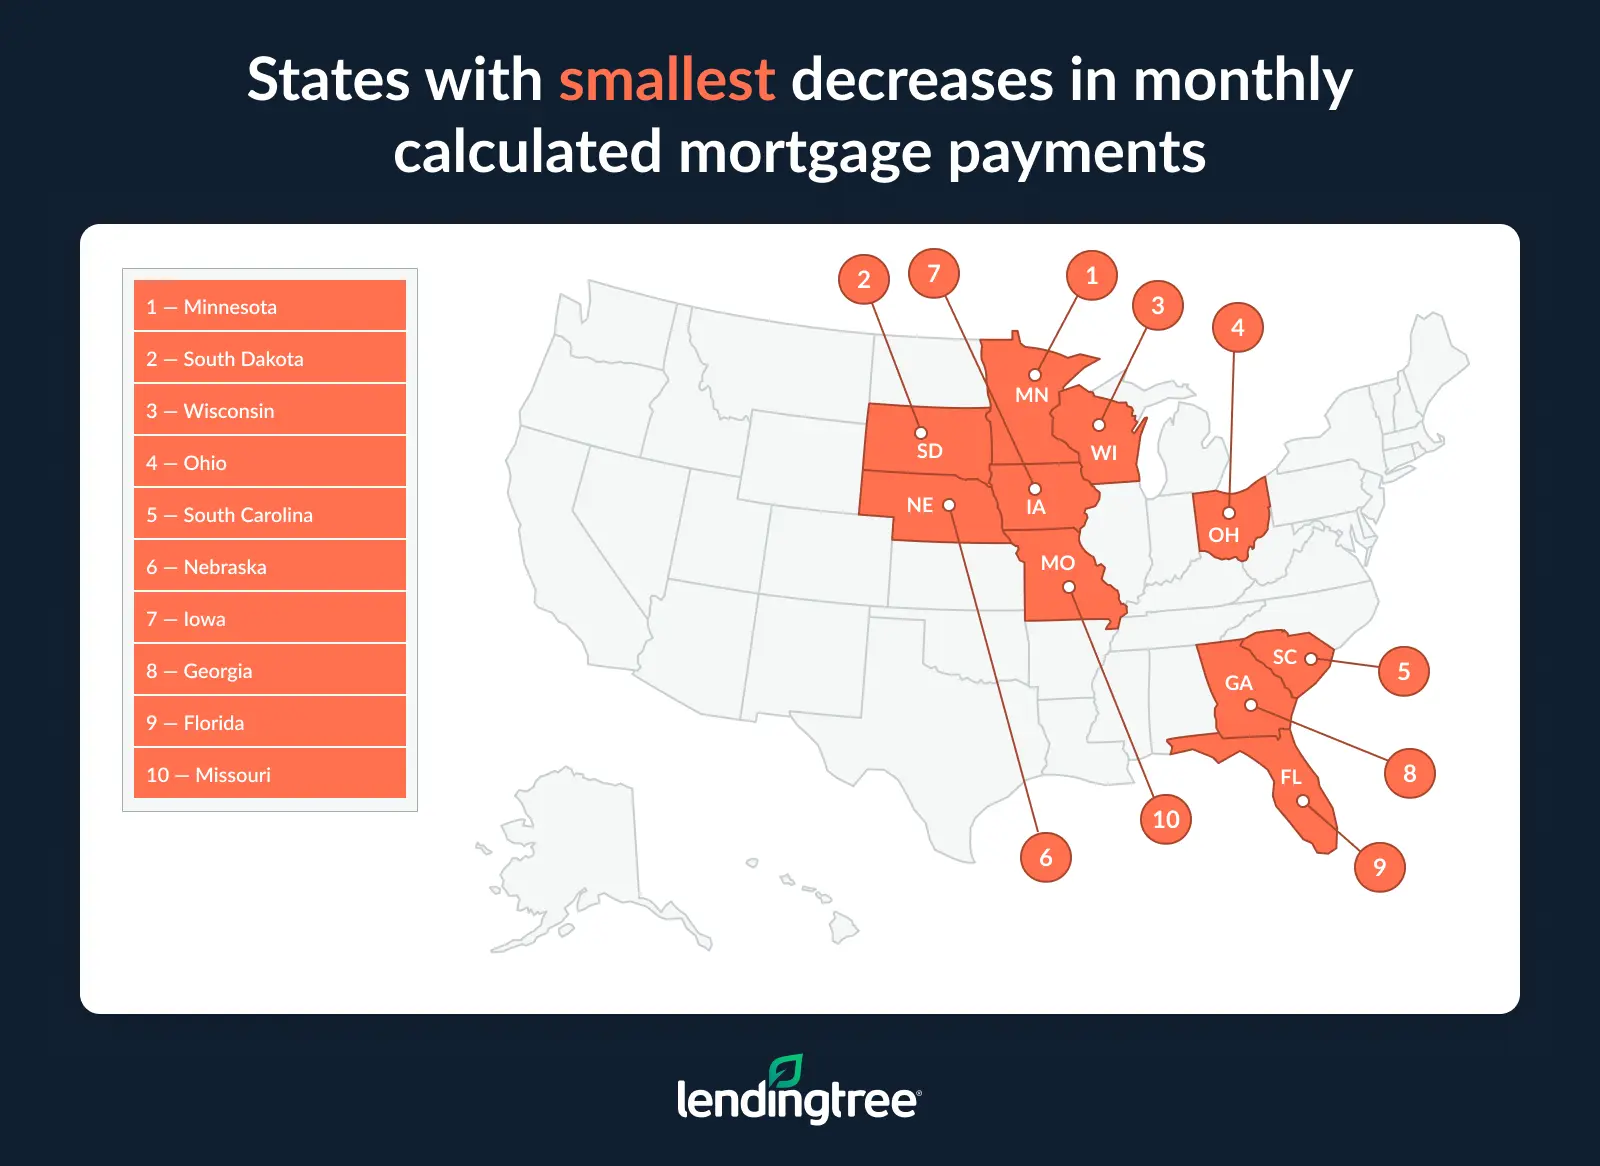
Only one state, North Dakota, experienced a rate increase between July 2024 and July 2025, albeit a modest one. The average rate rose by 0.03 percentage points, from 6.81% in July 2024 to 6.84% in July 2025, resulting in a $5.16 increase in the average calculated monthly payment and $1,858.24 in additional costs over 30 years.
Mortgage rates may fluctuate less dramatically in some states, resulting in smaller shifts in payments compared to national trends. Also, states in the Midwest typically have lower-than-average home prices and mortgage amounts, especially compared to coastal or high-cost markets. Because savings are directly proportional to the size of the mortgage, a rate drop can result in a less significant impact.
Full rankings: Biggest savings in calculated mortgage payments, July 2024 to July 2025
| Rank | State | Avg. mortgage amount, July 25 | Avg. APR, July 24 | Avg. APR, July 25 | Difference (% points) | Calculated payment, July 24 | Calculated payment, July 25 | Monthly decrease (avg.) | Annual decrease (avg.) | 30-year decrease (avg.) |
|---|---|---|---|---|---|---|---|---|---|---|
| 1 | District of Columbia | $463,298 | 7.25% | 6.56% | 0.69 | $3,160.51 | $2,946.66 | $213.85 | $2,566.14 | $76,984.34 |
| 2 | Massachusetts | $436,092 | 7.31% | 6.59% | 0.72 | $2,992.68 | $2,782.26 | $210.42 | $2,525.09 | $75,752.61 |
| 3 | California | $489,476 | 7.19% | 6.55% | 0.64 | $3,319.19 | $3,109.93 | $209.26 | $2,511.10 | $75,333.06 |
| 4 | Colorado | $420,202 | 7.14% | 6.46% | 0.68 | $2,835.23 | $2,644.92 | $190.32 | $2,283.79 | $68,513.75 |
| 5 | Connecticut | $359,620 | 7.32% | 6.58% | 0.74 | $2,470.34 | $2,292.00 | $178.34 | $2,140.12 | $64,203.70 |
| 6 | Nevada | $358,854 | 7.27% | 6.56% | 0.71 | $2,452.89 | $2,282.38 | $170.51 | $2,046.08 | $61,382.47 |
| 7 | Washington | $451,144 | 7.08% | 6.52% | 0.56 | $3,025.75 | $2,857.47 | $168.28 | $2,019.32 | $60,579.64 |
| 8 | Rhode Island | $333,047 | 7.33% | 6.60% | 0.73 | $2,290.07 | $2,127.03 | $163.03 | $1,956.40 | $58,691.99 |
| 9 | Utah | $396,167 | 7.10% | 6.50% | 0.60 | $2,662.37 | $2,504.04 | $158.32 | $1,899.89 | $56,996.61 |
| 10 | Idaho | $325,223 | 7.31% | 6.59% | 0.72 | $2,231.84 | $2,074.92 | $156.93 | $1,883.13 | $56,493.80 |
| 11 | New Jersey | $423,427 | 7.07% | 6.53% | 0.54 | $2,837.00 | $2,684.71 | $152.30 | $1,827.58 | $54,827.40 |
| 12 | Hawaii | $494,503 | 7.11% | 6.68% | 0.43 | $3,326.55 | $3,184.36 | $142.19 | $1,706.30 | $51,189.06 |
| 13 | Oregon | $340,594 | 7.22% | 6.61% | 0.61 | $2,316.53 | $2,177.48 | $139.04 | $1,668.50 | $50,054.87 |
| 14 | Arkansas | $255,997 | 7.44% | 6.64% | 0.80 | $1,779.46 | $1,641.72 | $137.75 | $1,652.95 | $49,588.42 |
| 15 | Vermont | $281,004 | 7.42% | 6.71% | 0.71 | $1,949.45 | $1,815.12 | $134.33 | $1,611.95 | $48,358.45 |
| 16 | Maryland | $370,899 | 7.13% | 6.59% | 0.54 | $2,500.07 | $2,366.33 | $133.74 | $1,604.85 | $48,145.39 |
| 17 | Arizona | $343,477 | 7.24% | 6.66% | 0.58 | $2,340.79 | $2,207.28 | $133.51 | $1,602.16 | $48,064.92 |
| 18 | Wyoming | $306,225 | 7.23% | 6.59% | 0.64 | $2,084.84 | $1,953.71 | $131.13 | $1,573.57 | $47,207.18 |
| 19 | Mississippi | $249,873 | 7.55% | 6.79% | 0.76 | $1,755.71 | $1,627.32 | $128.39 | $1,540.68 | $46,220.52 |
| 20 | Louisiana | $247,218 | 7.44% | 6.68% | 0.76 | $1,718.44 | $1,591.96 | $126.47 | $1,517.68 | $45,530.47 |
| 21 | New York | $373,207 | 7.42% | 6.92% | 0.50 | $2,589.10 | $2,462.94 | $126.17 | $1,514.01 | $45,420.24 |
| 22 | Maine | $316,604 | 7.32% | 6.73% | 0.59 | $2,174.85 | $2,049.28 | $125.57 | $1,506.84 | $45,205.06 |
| 23 | New Mexico | $299,420 | 7.35% | 6.74% | 0.61 | $2,062.92 | $1,940.04 | $122.88 | $1,474.53 | $44,236.00 |
| 24 | New Hampshire | $339,586 | 7.23% | 6.70% | 0.53 | $2,311.97 | $2,191.27 | $120.70 | $1,448.36 | $43,450.78 |
| 25 | Montana | $314,245 | 7.32% | 6.75% | 0.57 | $2,158.65 | $2,038.19 | $120.46 | $1,445.50 | $43,364.89 |
| 26 | Illinois | $294,403 | 7.29% | 6.72% | 0.57 | $2,016.34 | $1,903.63 | $112.72 | $1,352.59 | $40,577.75 |
| 27 | Pennsylvania | $274,468 | 7.28% | 6.67% | 0.61 | $1,877.94 | $1,765.62 | $112.32 | $1,347.85 | $40,435.41 |
| 28 | Delaware | $344,958 | 7.12% | 6.64% | 0.48 | $2,322.88 | $2,212.23 | $110.66 | $1,327.87 | $39,836.00 |
| 29 | North Carolina | $300,578 | 7.19% | 6.64% | 0.55 | $2,038.25 | $1,927.62 | $110.64 | $1,327.65 | $39,829.55 |
| 30 | Indiana | $257,855 | 7.44% | 6.81% | 0.63 | $1,792.38 | $1,682.74 | $109.64 | $1,315.65 | $39,469.60 |
| 31 | Tennessee | $301,231 | 7.17% | 6.65% | 0.52 | $2,038.61 | $1,933.80 | $104.81 | $1,257.71 | $37,731.35 |
| 32 | Kentucky | $233,177 | 7.49% | 6.83% | 0.66 | $1,628.81 | $1,524.80 | $104.01 | $1,248.11 | $37,443.19 |
| 33 | Kansas | $260,751 | 7.32% | 6.74% | 0.58 | $1,791.18 | $1,689.49 | $101.69 | $1,220.22 | $36,606.72 |
| 34 | Oklahoma | $238,842 | 7.43% | 6.81% | 0.62 | $1,658.58 | $1,558.66 | $99.92 | $1,199.07 | $35,971.96 |
| 35 | Alaska | $316,146 | 6.93% | 6.47% | 0.46 | $2,088.49 | $1,992.02 | $96.46 | $1,157.53 | $34,726.05 |
| 36 | Virginia | $353,451 | 7.01% | 6.61% | 0.40 | $2,353.89 | $2,259.68 | $94.21 | $1,130.54 | $33,916.15 |
| 37 | Texas | $304,826 | 7.06% | 6.62% | 0.44 | $2,040.31 | $1,950.83 | $89.49 | $1,073.84 | $32,215.10 |
| 38 | West Virginia | $216,718 | 7.55% | 6.98% | 0.57 | $1,522.75 | $1,438.92 | $83.83 | $1,005.96 | $30,178.80 |
| 39 | Alabama | $253,735 | 7.14% | 6.70% | 0.44 | $1,712.03 | $1,637.30 | $74.73 | $896.80 | $26,903.99 |
| 40 | Michigan | $243,764 | 7.25% | 6.80% | 0.45 | $1,662.90 | $1,589.16 | $73.74 | $884.90 | $26,546.86 |
| 41 | Missouri | $281,591 | 6.96% | 6.64% | 0.32 | $1,865.87 | $1,805.85 | $60.02 | $720.26 | $21,607.79 |
| 42 | Florida | $323,948 | 6.98% | 6.71% | 0.27 | $2,150.88 | $2,092.51 | $58.37 | $700.44 | $21,013.29 |
| 43 | Georgia | $304,348 | 6.96% | 6.68% | 0.28 | $2,016.67 | $1,959.85 | $56.81 | $681.73 | $20,451.88 |
| 44 | Iowa | $249,628 | 7.06% | 6.77% | 0.29 | $1,670.85 | $1,622.40 | $48.45 | $581.40 | $17,441.97 |
| 45 | Nebraska | $267,249 | 6.91% | 6.66% | 0.25 | $1,761.89 | $1,717.41 | $44.48 | $533.71 | $16,011.41 |
| 46 | South Carolina | $277,040 | 6.99% | 6.77% | 0.22 | $1,841.29 | $1,800.56 | $40.73 | $488.80 | $14,663.88 |
| 47 | Ohio | $249,890 | 6.99% | 6.75% | 0.24 | $1,660.85 | $1,620.78 | $40.06 | $480.78 | $14,423.29 |
| 48 | Wisconsin | $274,905 | 6.85% | 6.68% | 0.17 | $1,801.34 | $1,770.26 | $31.08 | $373.01 | $11,190.38 |
| 49 | South Dakota | $253,497 | 6.94% | 6.79% | 0.15 | $1,676.32 | $1,650.92 | $25.40 | $304.76 | $9,142.86 |
| 50 | Minnesota | $306,037 | 6.80% | 6.68% | 0.12 | $1,995.13 | $1,970.73 | $24.40 | $292.81 | $8,784.45 |
| 51 | North Dakota | $258,035 | 6.81% | 6.84% | +0.03 | $1,683.91 | $1,689.08 | +$5.16 | +$61.94 | +$1,858.24 |
Finding the lowest APR: Top homebuying tips
Securing the lowest possible APR can make a major difference in your monthly payment and long-term mortgage costs. “Because houses are so expensive, even a tiny reduction in APR can mean thousands and thousands of dollars saved over the life of the mortgage,” Schulz says.
Here are some strategies to help:
- Shop around with multiple lenders. “It’s hard to overstate how important it is to compare rates from different lenders when shopping for a mortgage,” Schulz says. “Rates can vary significantly from one lender to the next, so if you don’t take the time to shop around for rates, you’re likely doing yourself and your family a disservice.” In fact, research has shown that borrowers could save as much as $80,000 simply by getting multiple mortgage quotes.
- Boost your credit score. A higher credit score signals less risk to lenders and often qualifies you for the most competitive APRs. Maintain an on-time payment history (the most significant factor in your credit score) for your loans, credit cards and any other debt payments. Additionally, keep your credit utilization low and avoid taking on new debt as you prepare to apply for a mortgage.
- Consider your down payment. Putting more money down can lower your loan-to-value ratio, reducing risk and potentially helping you secure a better rate.
- Evaluate loan types and terms. Consider all your options for your mortgage. For example, adjustable-rate mortgages (ARMs) carry lower interest rates than fixed-rate loans, and 15-year mortgages have lower rates than 30-year loans. However, the risks associated with ARMs and the higher payments of shorter-term loans aren’t suitable for everyone. Select the options that best align with your financial goals.
- Negotiate and ask about discounts. Some lenders may offer rate reductions for autopay enrollment, for existing customer relationships or by paying points up front.
“You have much more power over mortgage rates than you think you do,” Schulz says. “You can’t control when rates rise or fall. You can’t control when the Fed makes moves. However, you can shop around for the best rates. You can pay points to bring down your APR. You can consider a 15-year mortgage instead of a 30-year mortgage.
You have much more power over mortgage rates than you think you do.

“Those and other options are available to you if you have your heart set on lowering your mortgage rates. Just make sure that you do your homework so you know what you’re getting into before you act.”
Methodology
Data was generated from more than 40,000 users who received an offer for a 30-year, fixed-rate mortgage on the LendingTree platform in July 2024 or July 2025.
To calculate monthly mortgage payments, LendingTree used the average mortgage amounts offered to users in each state in July 2025 and the average APRs offered to users in each state in July 2024 and July 2025.
Monthly payment differences were found by subtracting a calculated monthly payment with an average APR for July 2025 from a calculated monthly payment with an average APR for July 2024. To determine how much this difference would add up to yearly, the monthly difference was multiplied by 12. This yearly difference was multiplied by 30 to determine 30-year savings.
View mortgage loan offers from up to 5 lenders in minutes