Sole Female Applicants 30% More Likely to Be Denied Mortgage Than Sole Males


Women have steadily increased their share of the homebuying market, with single women owning more homes than single men. But when it comes to securing the keys, the playing field is far from even.
According to a LendingTree study, sole female mortgage applicants are 29.8% more likely to be denied a mortgage than sole males. Here’s a closer look.
Key findings
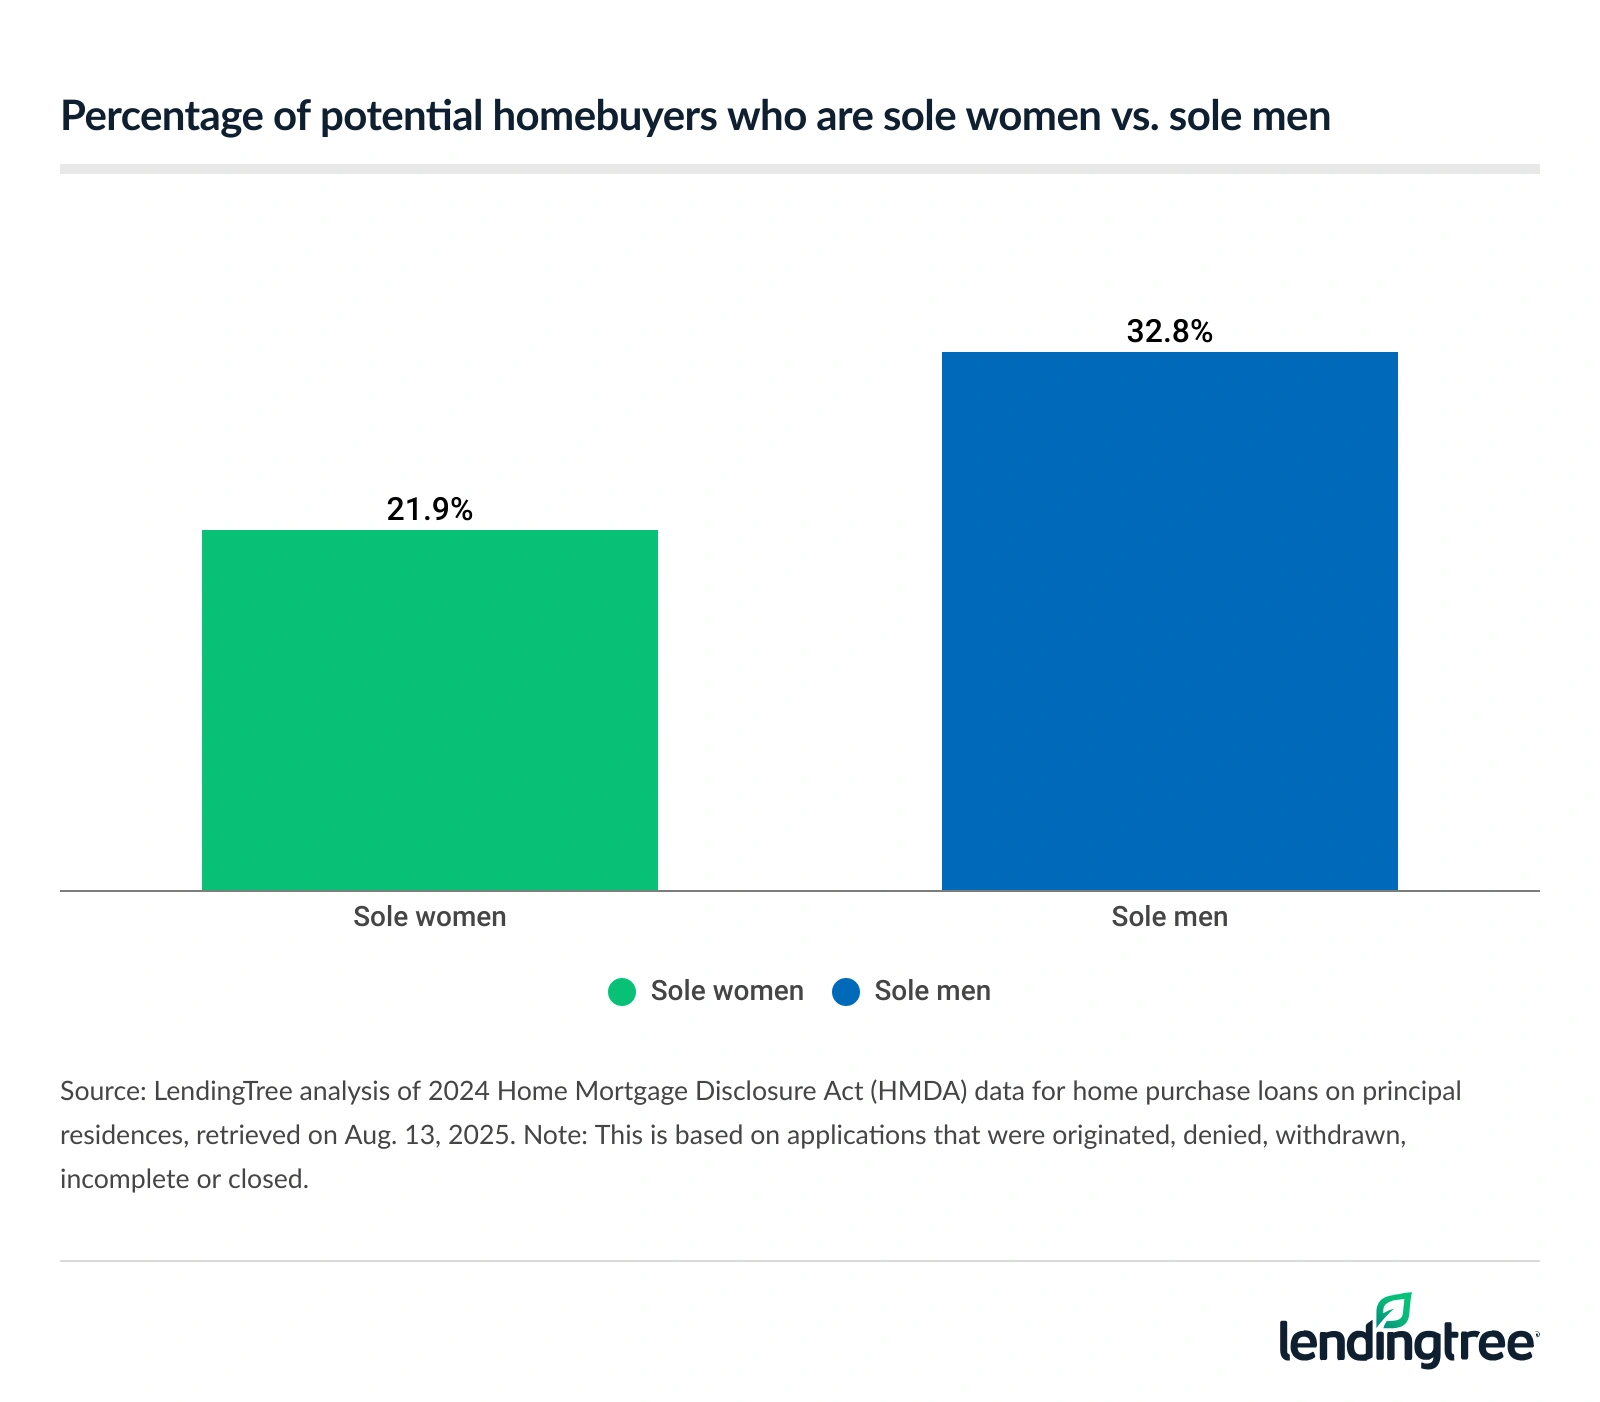
- Sole women made up 21.9% of potential homebuyers in 2024, compared with 32.8% for sole men — 1.5 men for every woman. Sole female applicants face higher denial rates but originate conventional 30-year, fixed-rate mortgages for smaller amounts, resulting in lower monthly payments amid slightly better average interest rates.
- The District of Columbia is the only state where the percentage of sole female applicants is higher than that among sole males (32.0% versus 29.2%). Utah has the largest gap (125.4%), with over twice as many sole men applying as sole women (30.2% versus 13.4%). Alaska (101.1% more sole male applicants than sole females) and North Dakota (100.0% more) follow.
- Sole female applicants are 29.8% more likely to be denied a mortgage than sole males (15.7% versus 12.1%). The largest disparities are in Louisiana (29.0% versus 18.1%), Mississippi (29.0% versus 19.8%) and Alabama (21.9% versus 14.8%). Denial rates among sole men exceed those among sole women in six states — D.C., Alaska, Hawaii, Vermont, Maine and Rhode Island.
- Sole men who originate mortgages pay more monthly than sole women in every state. Sole men originate conventional 30-year, fixed-rate mortgages with higher average loan amounts in every state. In Vermont, Iowa and Wyoming, the monthly payment differences are under $100. The largest gaps are in Hawaii ($649), California ($640) and Washington ($578).
- In 2024, sole women originated $173.3 billion in mortgage debt, while sole men originated a much more significant $328.7 billion. In total, sole women originated 600,817 loans, while men originated 949,477. (This is across all primary home purchases in 2024, not just those with conventional 30-year, fixed-rate mortgages.)
Sole borrowers are applicants whose loans are only in one person’s name. Not all sole borrowers are single — presumably, some sole borrowers are in couples and buying homes for families but only put the loan in one person’s name.
Sole women less likely to be potential homebuyers
Sole female mortgage applicants made up 21.9% of potential homebuyers in 2024, while sole men accounted for 32.8%. That means there were 1.5 sole male applicants for every sole female applicant.
Matt Schulz — LendingTree chief consumer finance analyst and author of “Ask Questions, Save Money, Make More: How to Take Control of Your Financial Life” — says income unquestionably plays a major role in these disparities.
“Women tend to have smaller incomes than men, and that can create homebuying challenges,” he says. “While income doesn’t factor into your credit score, it massively affects your debt-to-income (DTI) ratio, your ability to save for a down payment and your comfort level with a long-term financial commitment like buying a house. Those things matter a lot. Of course, when it comes to men being more likely than women to buy a home, there are other factors as well, including sexism, but it’s hard to overstate how important income is to the homebuying process.”
Overall, sole female applicants face higher denial rates at 15.7%, compared with 12.1% among sole male applicants. Looking at originated conventional 30-year, fixed-rate mortgages, women take out smaller amounts (averaging $299,134, versus $356,550), resulting in lower monthly payments amid slightly better average interest rates.
By loan type originations, sole male applicants dominate across the board. Among just sole applicants, men originate a significant 81.6% of Veterans Affairs (VA) loans, compared with 18.4% among sole women.
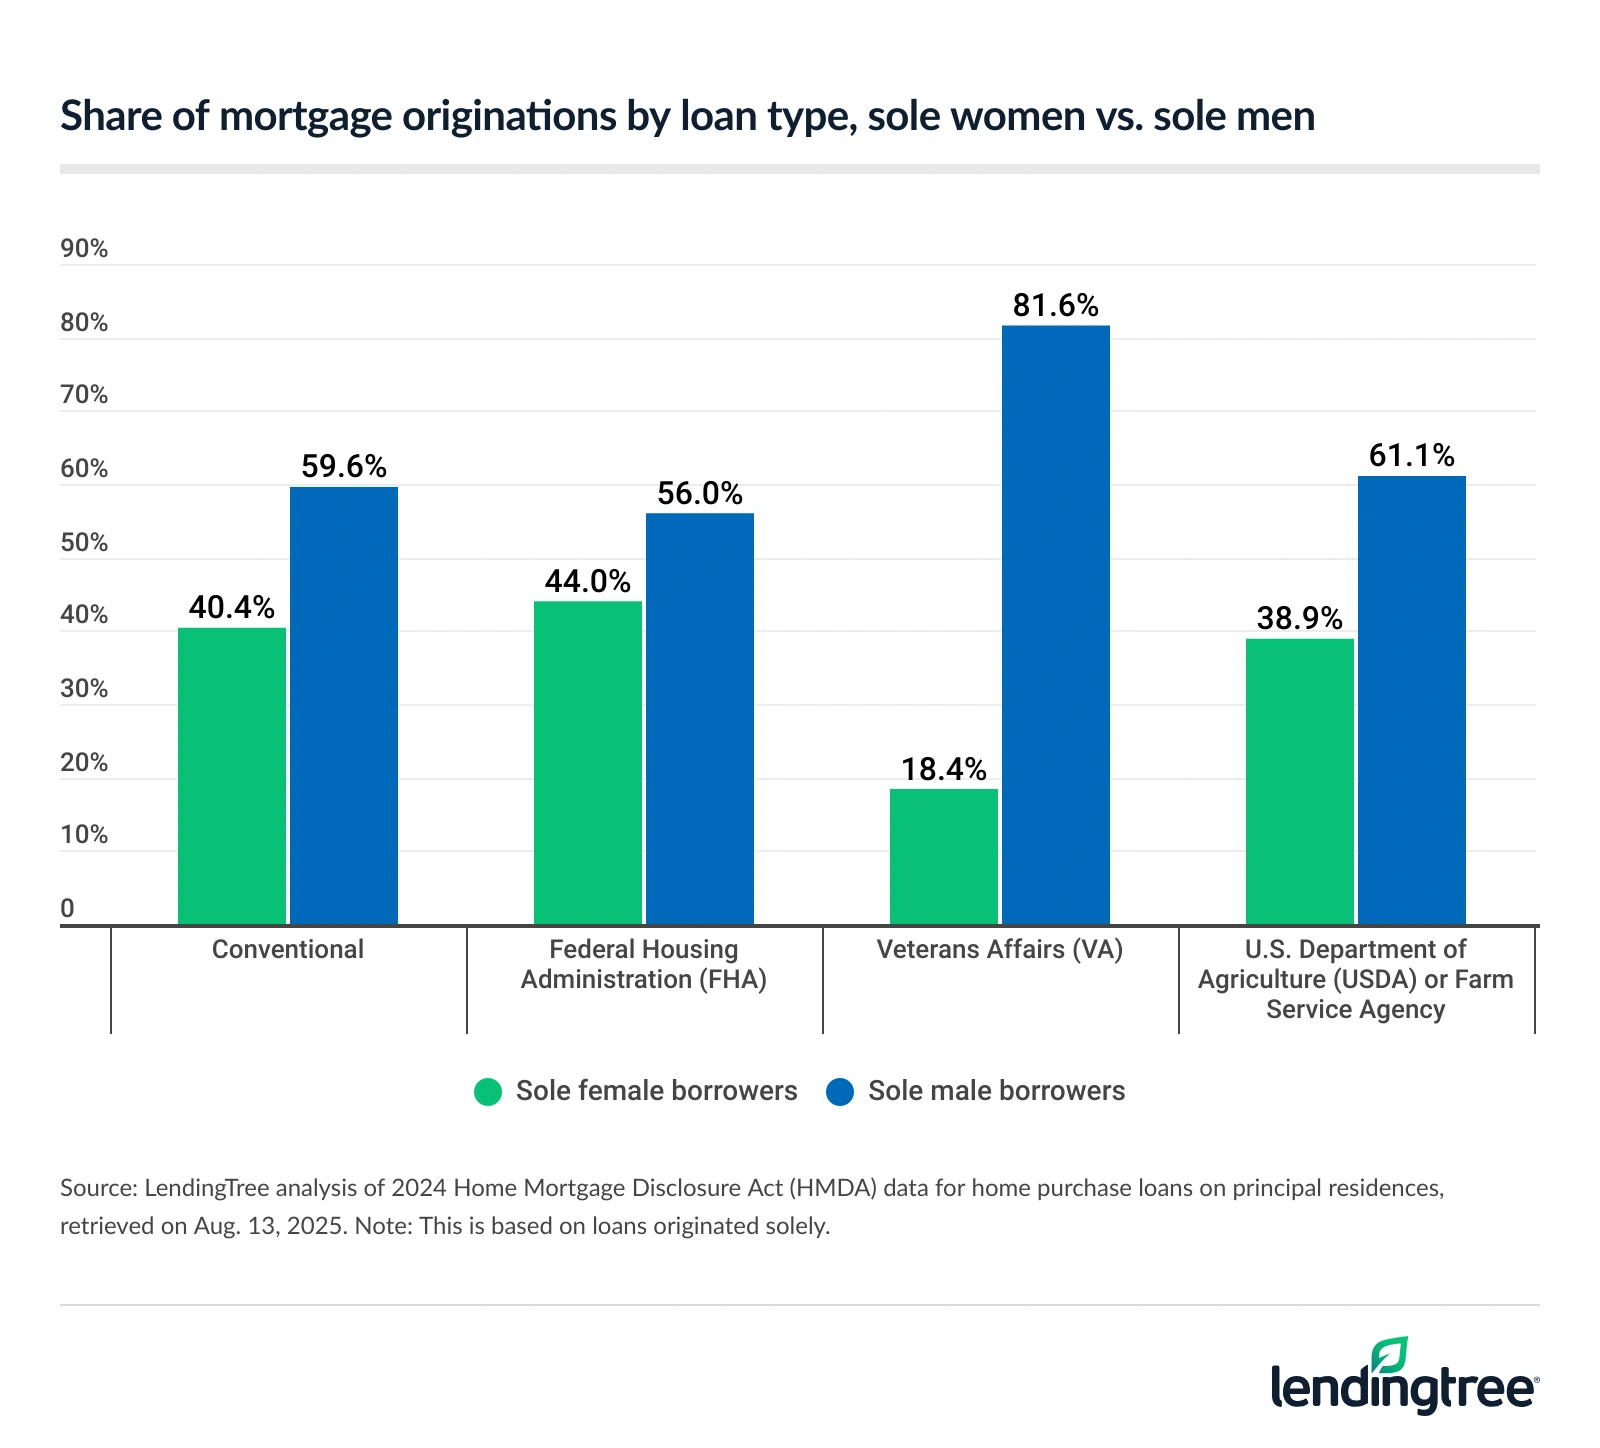
Sole women hold a higher percentage of sole-originated FHA loans at 44.0%, but sole men still account for the majority at 56.0%.
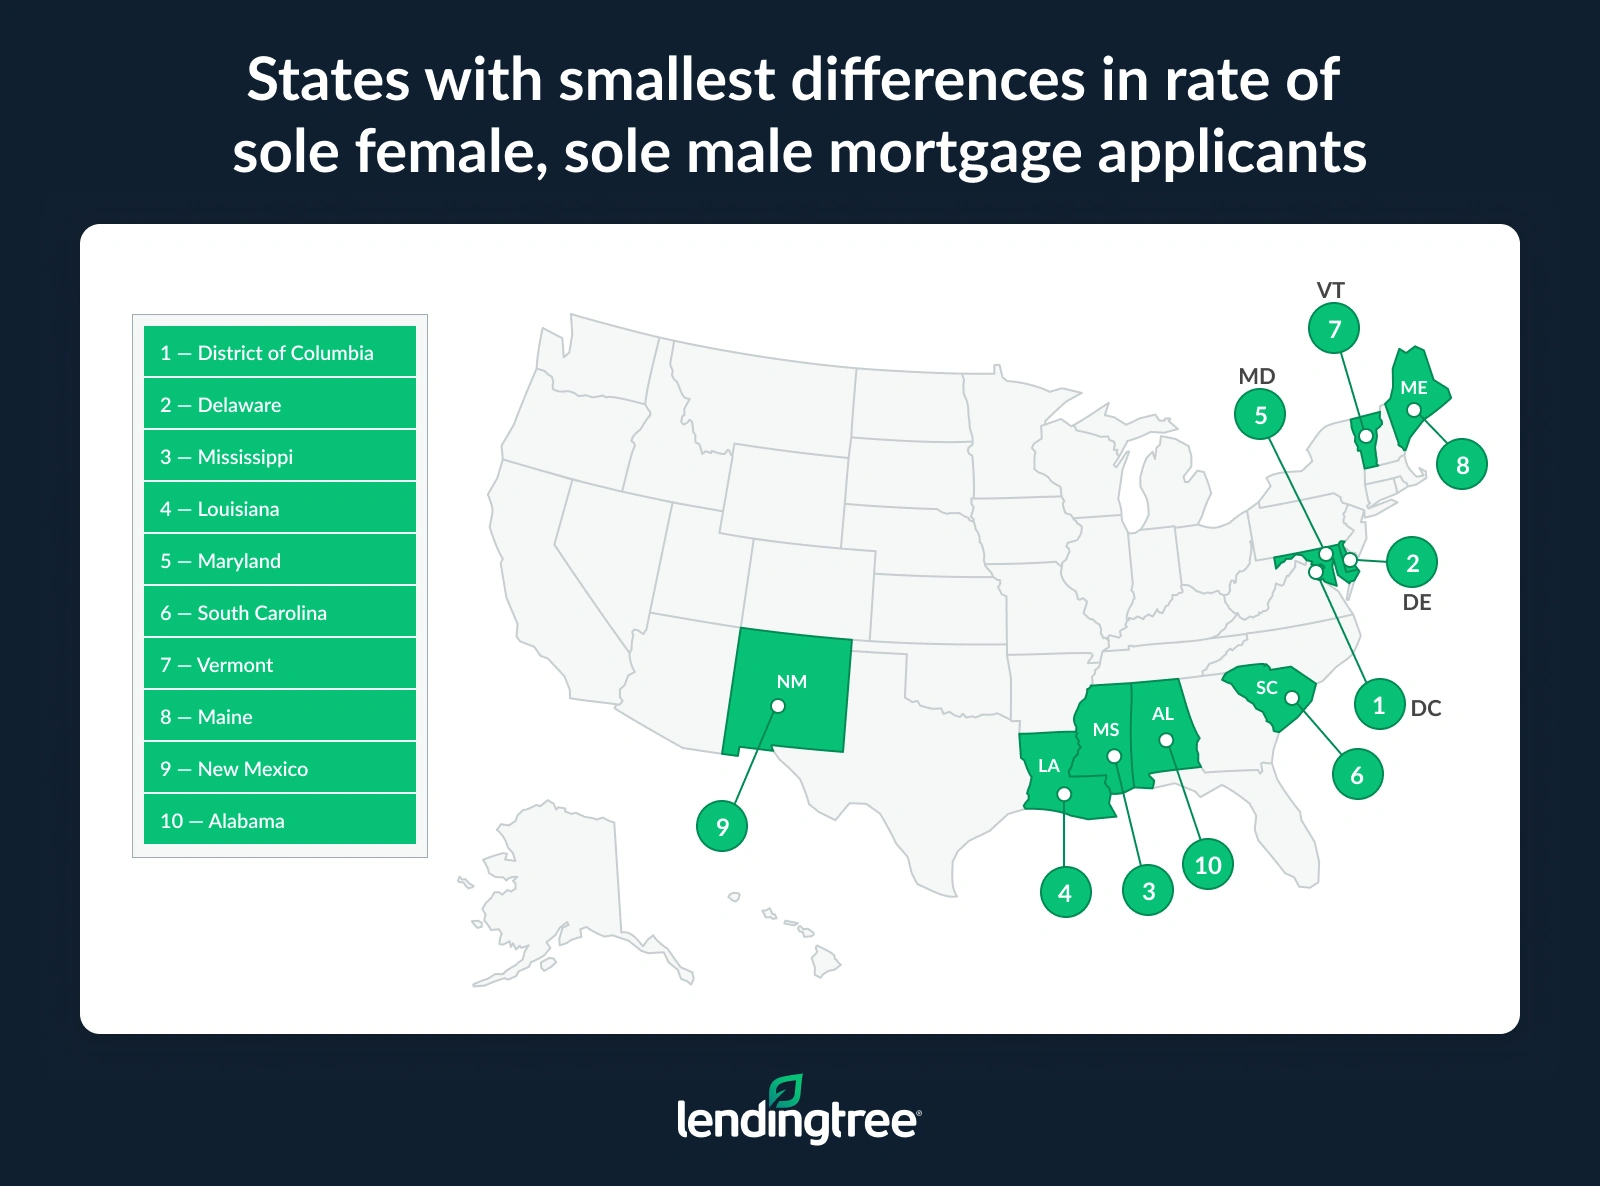
D.C. only state with higher share of sole female applicants
By state, just one has a higher percentage of sole female loan applicants: The District of Columbia. Here, 32.0% of applicants are sole women, while 29.2% are sole men.
The states with the next smallest disparities are Delaware (27.3% are sole female applicants, versus 30.1% for sole males) and Mississippi (29.8% versus 33.9%).
Conversely, Utah has the largest gap, with 30.2% sole male applicants, versus 13.4% sole female applicants — over twice as many sole men apply as sole women. That could largely boil down to Utah’s culture, which historically emphasizes traditional family structures. Women may be more likely to purchase homes jointly with their spouses than alone, while men may be more inclined to buy homes by themselves than with their partners.
Alaska (37.2% sole men, versus 18.5% sole women) and North Dakota (37.0% versus 18.5%) have the next highest rates of sole men applicants compared to sole women applicants.
Full rankings: Percentage of potential homebuyers who are sole women vs. sole men (by state)
| Rank | State | %, sole women | %, sole men | % difference |
|---|---|---|---|---|
| 1 | District of Columbia | 32.0% | 29.2% | -8.8% |
| 2 | Delaware | 27.3% | 30.1% | 10.3% |
| 3 | Mississippi | 29.8% | 33.9% | 13.8% |
| 4 | Louisiana | 28.9% | 33.7% | 16.6% |
| 5 | Maryland | 26.3% | 31.7% | 20.5% |
| 6 | South Carolina | 26.3% | 33.1% | 25.9% |
| 7 | Vermont | 20.2% | 25.9% | 28.2% |
| 8 | Maine | 21.7% | 29.2% | 34.6% |
| 9 | New Mexico | 23.6% | 31.8% | 34.7% |
| 10 | Alabama | 26.5% | 35.8% | 35.1% |
| 11 | Oregon | 19.3% | 26.2% | 35.8% |
| 12 | Georgia | 26.1% | 35.8% | 37.2% |
| 13 | Minnesota | 22.2% | 30.6% | 37.8% |
| 14 | Arkansas | 23.5% | 32.4% | 37.9% |
| 15 | New York | 22.7% | 31.6% | 39.2% |
| 16 | North Carolina | 24.2% | 33.8% | 39.7% |
| 17 | Massachusetts | 20.3% | 28.5% | 40.4% |
| 18 | Illinois | 25.0% | 35.2% | 40.8% |
| 19 | Kentucky | 23.7% | 33.5% | 41.4% |
| 20 | Rhode Island | 22.2% | 31.8% | 43.2% |
| 21 | Missouri | 22.6% | 32.8% | 45.1% |
| 22 | Connecticut | 24.4% | 35.5% | 45.5% |
| 22 | Pennsylvania | 23.5% | 34.2% | 45.5% |
| 24 | Michigan | 25.3% | 37.2% | 47.0% |
| 25 | Virginia | 22.6% | 33.3% | 47.3% |
| 26 | Wisconsin | 19.4% | 28.8% | 48.5% |
| 27 | West Virginia | 24.2% | 36.3% | 50.0% |
| 28 | Ohio | 23.7% | 35.7% | 50.6% |
| 29 | Florida | 22.1% | 33.9% | 53.4% |
| 30 | Iowa | 21.5% | 33.1% | 54.0% |
| 31 | Nevada | 20.8% | 32.1% | 54.3% |
| 32 | Indiana | 23.2% | 35.9% | 54.7% |
| 32 | Tennessee | 21.2% | 32.8% | 54.7% |
| 34 | Colorado | 18.4% | 28.9% | 57.1% |
| 35 | Oklahoma | 21.1% | 33.6% | 59.2% |
| 36 | Arizona | 19.2% | 30.7% | 59.9% |
| 37 | Kansas | 20.2% | 32.7% | 61.9% |
| 38 | California | 17.4% | 28.3% | 62.6% |
| 39 | Montana | 17.5% | 28.8% | 64.6% |
| 40 | Nebraska | 18.2% | 30.5% | 67.6% |
| 41 | New Jersey | 19.2% | 32.3% | 68.2% |
| 42 | Washington | 16.5% | 28.0% | 69.7% |
| 43 | South Dakota | 17.6% | 30.7% | 74.4% |
| 44 | Hawaii | 16.4% | 29.0% | 76.8% |
| 45 | Texas | 19.6% | 34.7% | 77.0% |
| 46 | New Hampshire | 16.9% | 30.2% | 78.7% |
| 47 | Idaho | 14.4% | 26.1% | 81.3% |
| 48 | Wyoming | 17.6% | 34.3% | 94.9% |
| 49 | North Dakota | 18.5% | 37.0% | 100.0% |
| 50 | Alaska | 18.5% | 37.2% | 101.1% |
| 51 | Utah | 13.4% | 30.2% | 125.4% |
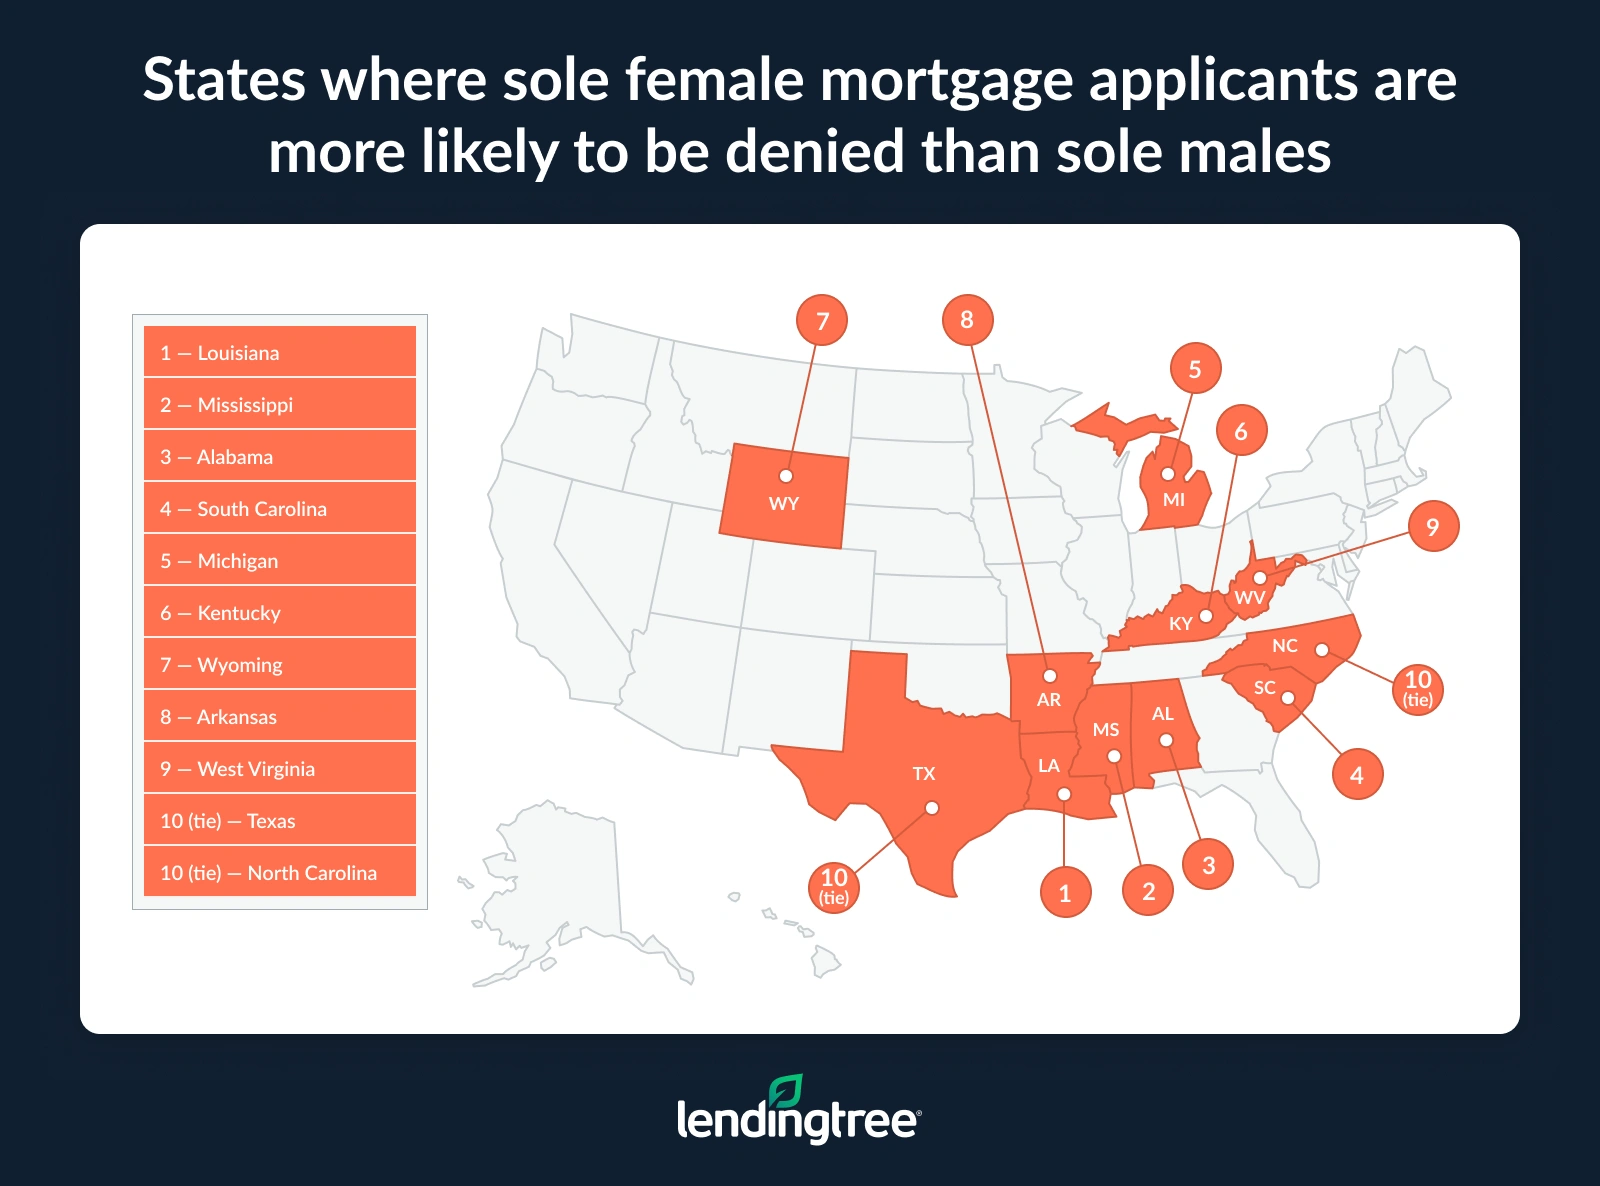
Sole female applicants face higher denial rates than males
Not only are sole women less likely to be applicants, but they’re also 29.8% more likely to be denied a mortgage than sole men, at 15.7% versus 12.1%.
“Sexism and gender-based discrimination haven’t disappeared in 2025, so that likely plays a role,” Schulz says. “However, income matters here, too. Your DTI ratio is a key factor in determining your ability to get a mortgage. If you’re not making enough money, it gets more challenging to make that ratio look good.”
By state, Louisiana has the largest spread, with sole women denied 29.0%, versus 18.1% among sole men. Mississippi (29.0% among sole women and 19.8% among sole men) and Alabama (21.9% versus 14.8%) follow.
In just six states, denial rates among sole men are higher than those of women. Those are:
- D.C. (8.1% among sole women applicants, versus 10.1% among sole men)
- Alaska (5.8% versus 6.5%)
- Hawaii (10.5% versus 10.9%)
- Vermont (10.4% versus 10.7%)
- Maine (10.8% versus 10.9%)
- Rhode Island (9.3% versus 9.4%)
Full rankings: States where sole female mortgage applicants are less (or more) likely to be denied than sole males
| Rank | State | Denial rate, sole women | Denial rate, sole men | Spread in rates |
|---|---|---|---|---|
| 1 | District of Columbia | 8.1% | 10.1% | -2.0 |
| 2 | Alaska | 5.8% | 6.5% | -0.7 |
| 3 | Hawaii | 10.5% | 10.9% | -0.4 |
| 4 | Vermont | 10.4% | 10.7% | -0.3 |
| 5 | Maine | 10.8% | 10.9% | -0.1 |
| 5 | Rhode Island | 9.3% | 9.4% | -0.1 |
| 7 | Massachusetts | 9.5% | 9.3% | 0.2 |
| 8 | Connecticut | 9.8% | 9.5% | 0.3 |
| 9 | New Jersey | 10.5% | 9.9% | 0.6 |
| 10 | Washington | 8.9% | 8.0% | 0.9 |
| 11 | California | 11.4% | 10.4% | 1.0 |
| 12 | Idaho | 9.6% | 8.5% | 1.1 |
| 12 | Maryland | 10.0% | 8.9% | 1.1 |
| 14 | New York | 13.5% | 12.3% | 1.2 |
| 15 | Arizona | 11.2% | 9.6% | 1.6 |
| 16 | Oregon | 10.5% | 8.8% | 1.7 |
| 16 | Nevada | 12.1% | 10.4% | 1.7 |
| 18 | Minnesota | 9.4% | 7.6% | 1.8 |
| 19 | Missouri | 11.2% | 9.3% | 1.9 |
| 19 | Pennsylvania | 11.6% | 9.7% | 1.9 |
| 19 | Montana | 12.2% | 10.3% | 1.9 |
| 22 | Ohio | 10.5% | 8.5% | 2.0 |
| 23 | Illinois | 11.6% | 9.4% | 2.2 |
| 24 | Delaware | 14.1% | 11.8% | 2.3 |
| 24 | Virginia | 11.0% | 8.7% | 2.3 |
| 26 | Florida | 16.4% | 13.7% | 2.7 |
| 26 | Wisconsin | 11.3% | 8.6% | 2.7 |
| 28 | Colorado | 12.5% | 9.7% | 2.8 |
| 29 | New Hampshire | 12.2% | 9.3% | 2.9 |
| 29 | Iowa | 11.7% | 8.8% | 2.9 |
| 31 | North Dakota | 10.2% | 7.1% | 3.1 |
| 31 | Nebraska | 10.7% | 7.6% | 3.1 |
| 31 | Kansas | 12.5% | 9.4% | 3.1 |
| 31 | Indiana | 12.9% | 9.8% | 3.1 |
| 31 | Tennessee | 14.9% | 11.8% | 3.1 |
| 36 | Utah | 12.3% | 9.1% | 3.2 |
| 37 | South Dakota | 12.0% | 8.3% | 3.7 |
| 38 | Georgia | 15.5% | 11.5% | 4.0 |
| 38 | New Mexico | 18.6% | 14.6% | 4.0 |
| 38 | Oklahoma | 18.5% | 14.5% | 4.0 |
| 41 | North Carolina | 15.4% | 11.0% | 4.4 |
| 41 | Texas | 19.7% | 15.3% | 4.4 |
| 43 | West Virginia | 20.4% | 15.9% | 4.5 |
| 44 | Arkansas | 20.5% | 15.8% | 4.7 |
| 45 | Wyoming | 16.7% | 11.7% | 5.0 |
| 46 | Kentucky | 21.2% | 15.4% | 5.8 |
| 47 | Michigan | 17.2% | 10.9% | 6.3 |
| 48 | South Carolina | 21.2% | 14.2% | 7.0 |
| 49 | Alabama | 21.9% | 14.8% | 7.1 |
| 50 | Mississippi | 29.0% | 19.8% | 9.2 |
| 51 | Louisiana | 29.0% | 18.1% | 10.9 |
Sole men originate 30-year mortgages for larger amounts
Sole female borrowers who originate mortgages take on less than sole men. While sole women take on $299,134 on average, the average loan size for sole men is $356,550. (This looks at home purchase loans for principal residences that were conventional 30-year, fixed-rate mortgages to calculate averages.) With interest rates of 6.48% for sole women and 6.57% for sole men, this translates to monthly payments of $1,887 and $2,270, respectively. That’s a $383 difference.
In every state, sole men originate conventional 30-year, fixed-rate mortgages with higher average loan amounts. That gap is largest in Hawaii, where sole men pay an average of $3,864 a month and sole women pay $3,214 — a difference of $649. California ($640) and Washington ($578) follow.
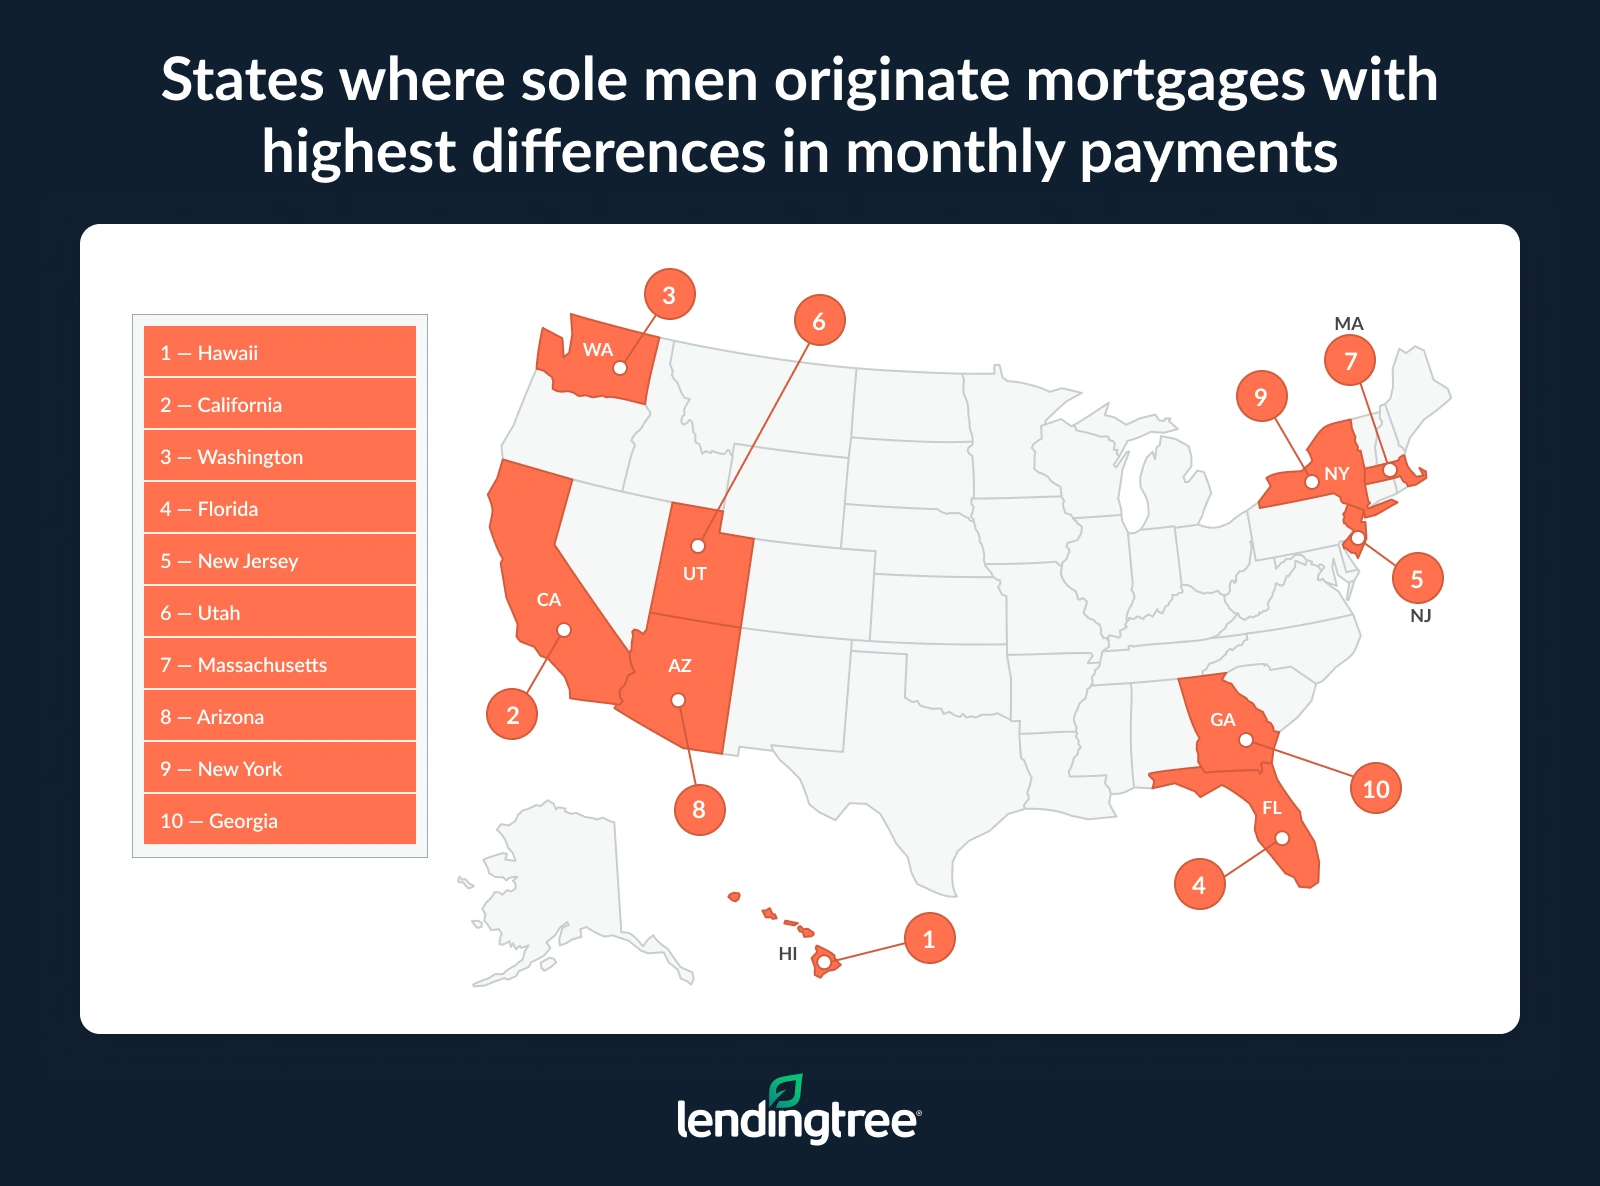
Meanwhile, in Vermont, Iowa and Wyoming, the monthly payment differences are under $100.
Full rankings: Average loan amounts, interest rates and monthly payments, sole women vs. sole men
| Rank | State | Avg. loan amount, sole women | Avg. loan amount, sole men | Avg. interest rate, sole women | Avg. interest rate, sole men | Estimated monthly payment, sole women | Estimated monthly payment, sole men | Difference ($) |
|---|---|---|---|---|---|---|---|---|
| 1 | Vermont | $289,734 | $302,115 | 6.52% | 6.52% | $1,835 | $1,914 | $78 |
| 2 | Iowa | $173,263 | $189,566 | 6.10% | 6.08% | $1,050 | $1,146 | $96 |
| 3 | Wyoming | $243,118 | $263,564 | 5.83% | 5.69% | $1,431 | $1,528 | $97 |
| 4 | Nebraska | $221,651 | $240,812 | 6.60% | 6.58% | $1,416 | $1,535 | $119 |
| 5 | West Virginia | $192,360 | $210,559 | 6.52% | 6.56% | $1,218 | $1,339 | $121 |
| 6 | North Dakota | $223,914 | $245,640 | 6.15% | 6.26% | $1,364 | $1,514 | $150 |
| 7 | New Mexico | $236,161 | $257,028 | 6.83% | 6.93% | $1,544 | $1,698 | $154 |
| 8 | Wisconsin | $227,750 | $252,925 | 6.58% | 6.62% | $1,452 | $1,619 | $167 |
| 9 | Indiana | $198,324 | $225,458 | 6.42% | 6.50% | $1,243 | $1,425 | $182 |
| 10 | South Dakota | $237,428 | $265,622 | 6.26% | 6.36% | $1,463 | $1,655 | $191 |
| 11 | Pennsylvania | $240,676 | $270,009 | 6.57% | 6.63% | $1,532 | $1,730 | $197 |
| 12 | Ohio | $204,337 | $233,968 | 6.65% | 6.71% | $1,312 | $1,511 | $200 |
| 13 | Minnesota | $241,329 | $271,564 | 6.13% | 6.24% | $1,467 | $1,670 | $203 |
| 14 | Rhode Island | $334,503 | $368,494 | 6.36% | 6.35% | $2,084 | $2,293 | $209 |
| 15 | Missouri | $217,121 | $249,086 | 6.62% | 6.65% | $1,390 | $1,599 | $210 |
| 16 | Kentucky | $204,046 | $235,632 | 6.42% | 6.52% | $1,279 | $1,492 | $213 |
| 17 | Kansas | $215,240 | $247,576 | 6.60% | 6.65% | $1,375 | $1,589 | $215 |
| 18 | Oklahoma | $199,805 | $233,844 | 6.41% | 6.52% | $1,251 | $1,481 | $230 |
| 19 | Maine | $287,985 | $324,966 | 6.66% | 6.72% | $1,851 | $2,101 | $251 |
| 20 | Michigan | $205,703 | $244,847 | 6.59% | 6.65% | $1,312 | $1,572 | $259 |
| 21 | Connecticut | $287,388 | $323,354 | 6.45% | 6.62% | $1,807 | $2,069 | $262 |
| 22 | Alaska | $307,702 | $348,983 | 6.41% | 6.47% | $1,927 | $2,199 | $272 |
| 23 | Arkansas | $227,005 | $268,419 | 6.60% | 6.66% | $1,450 | $1,725 | $275 |
| 24 | Alabama | $227,487 | $268,418 | 6.52% | 6.62% | $1,441 | $1,718 | $277 |
| 25 | Louisiana | $218,072 | $258,609 | 6.60% | 6.71% | $1,393 | $1,670 | $278 |
| 26 | Illinois | $237,171 | $279,520 | 6.60% | 6.70% | $1,515 | $1,804 | $289 |
| 26 | Mississippi | $178,524 | $217,775 | 5.60% | 6.06% | $1,025 | $1,314 | $289 |
| 28 | Maryland | $334,910 | $374,458 | 6.49% | 6.66% | $2,115 | $2,406 | $292 |
| 29 | Montana | $313,137 | $360,225 | 6.45% | 6.50% | $1,969 | $2,277 | $308 |
| 30 | Delaware | $299,216 | $346,255 | 6.45% | 6.58% | $1,881 | $2,207 | $325 |
| 31 | South Carolina | $266,702 | $316,299 | 6.57% | 6.68% | $1,698 | $2,037 | $339 |
| 32 | Colorado | $372,365 | $431,059 | 6.18% | 6.17% | $2,276 | $2,632 | $356 |
| 33 | District of Columbia | $452,780 | $507,842 | 6.58% | 6.60% | $2,886 | $3,243 | $358 |
| 34 | Oregon | $364,367 | $420,502 | 6.57% | 6.63% | $2,320 | $2,694 | $374 |
| 35 | New Hampshire | $335,965 | $392,428 | 6.71% | 6.75% | $2,170 | $2,545 | $375 |
| 36 | Tennessee | $285,765 | $343,114 | 6.53% | 6.60% | $1,812 | $2,191 | $379 |
| 37 | Virginia | $319,417 | $377,486 | 6.63% | 6.71% | $2,046 | $2,438 | $392 |
| 38 | Idaho | $324,536 | $387,065 | 6.45% | 6.53% | $2,041 | $2,454 | $414 |
| 39 | Texas | $308,617 | $370,875 | 6.44% | 6.54% | $1,939 | $2,354 | $415 |
| 40 | North Carolina | $290,438 | $356,881 | 6.54% | 6.64% | $1,843 | $2,289 | $445 |
| 41 | Nevada | $352,256 | $421,365 | 6.34% | 6.42% | $2,190 | $2,641 | $452 |
| 42 | Georgia | $306,328 | $371,021 | 6.33% | 6.57% | $1,902 | $2,362 | $460 |
| 43 | New York | $325,422 | $395,406 | 6.62% | 6.71% | $2,083 | $2,554 | $471 |
| 44 | Arizona | $345,662 | $421,155 | 6.47% | 6.49% | $2,178 | $2,659 | $481 |
| 45 | Massachusetts | $394,811 | $468,842 | 6.43% | 6.62% | $2,477 | $3,000 | $523 |
| 46 | Utah | $351,460 | $434,441 | 6.48% | 6.59% | $2,217 | $2,772 | $555 |
| 47 | New Jersey | $364,204 | $449,561 | 6.72% | 6.76% | $2,355 | $2,919 | $564 |
| 48 | Florida | $309,032 | $395,594 | 6.35% | 6.48% | $1,923 | $2,495 | $572 |
| 49 | Washington | $405,103 | $493,897 | 6.23% | 6.33% | $2,489 | $3,067 | $578 |
| 50 | California | $516,184 | $611,447 | 6.47% | 6.57% | $3,252 | $3,893 | $640 |
| 51 | Hawaii | $499,129 | $599,360 | 6.68% | 6.69% | $3,214 | $3,864 | $649 |
Sole women who originate mortgages take on less debt
Looking across all primary home purchases in 2024, sole women originated $173.3 billion in mortgage debt, while sole men originated a much more significant $328.7 billion. Breaking that down by loan numbers, sole women originated 600,817 loans, while men originated 949,477.
Among sole borrowers, sole men dominated home purchase originations in nearly all age groups. Among those under 25, sole men made up 71.2% of sole originations, compared with 28.8% among sole women.
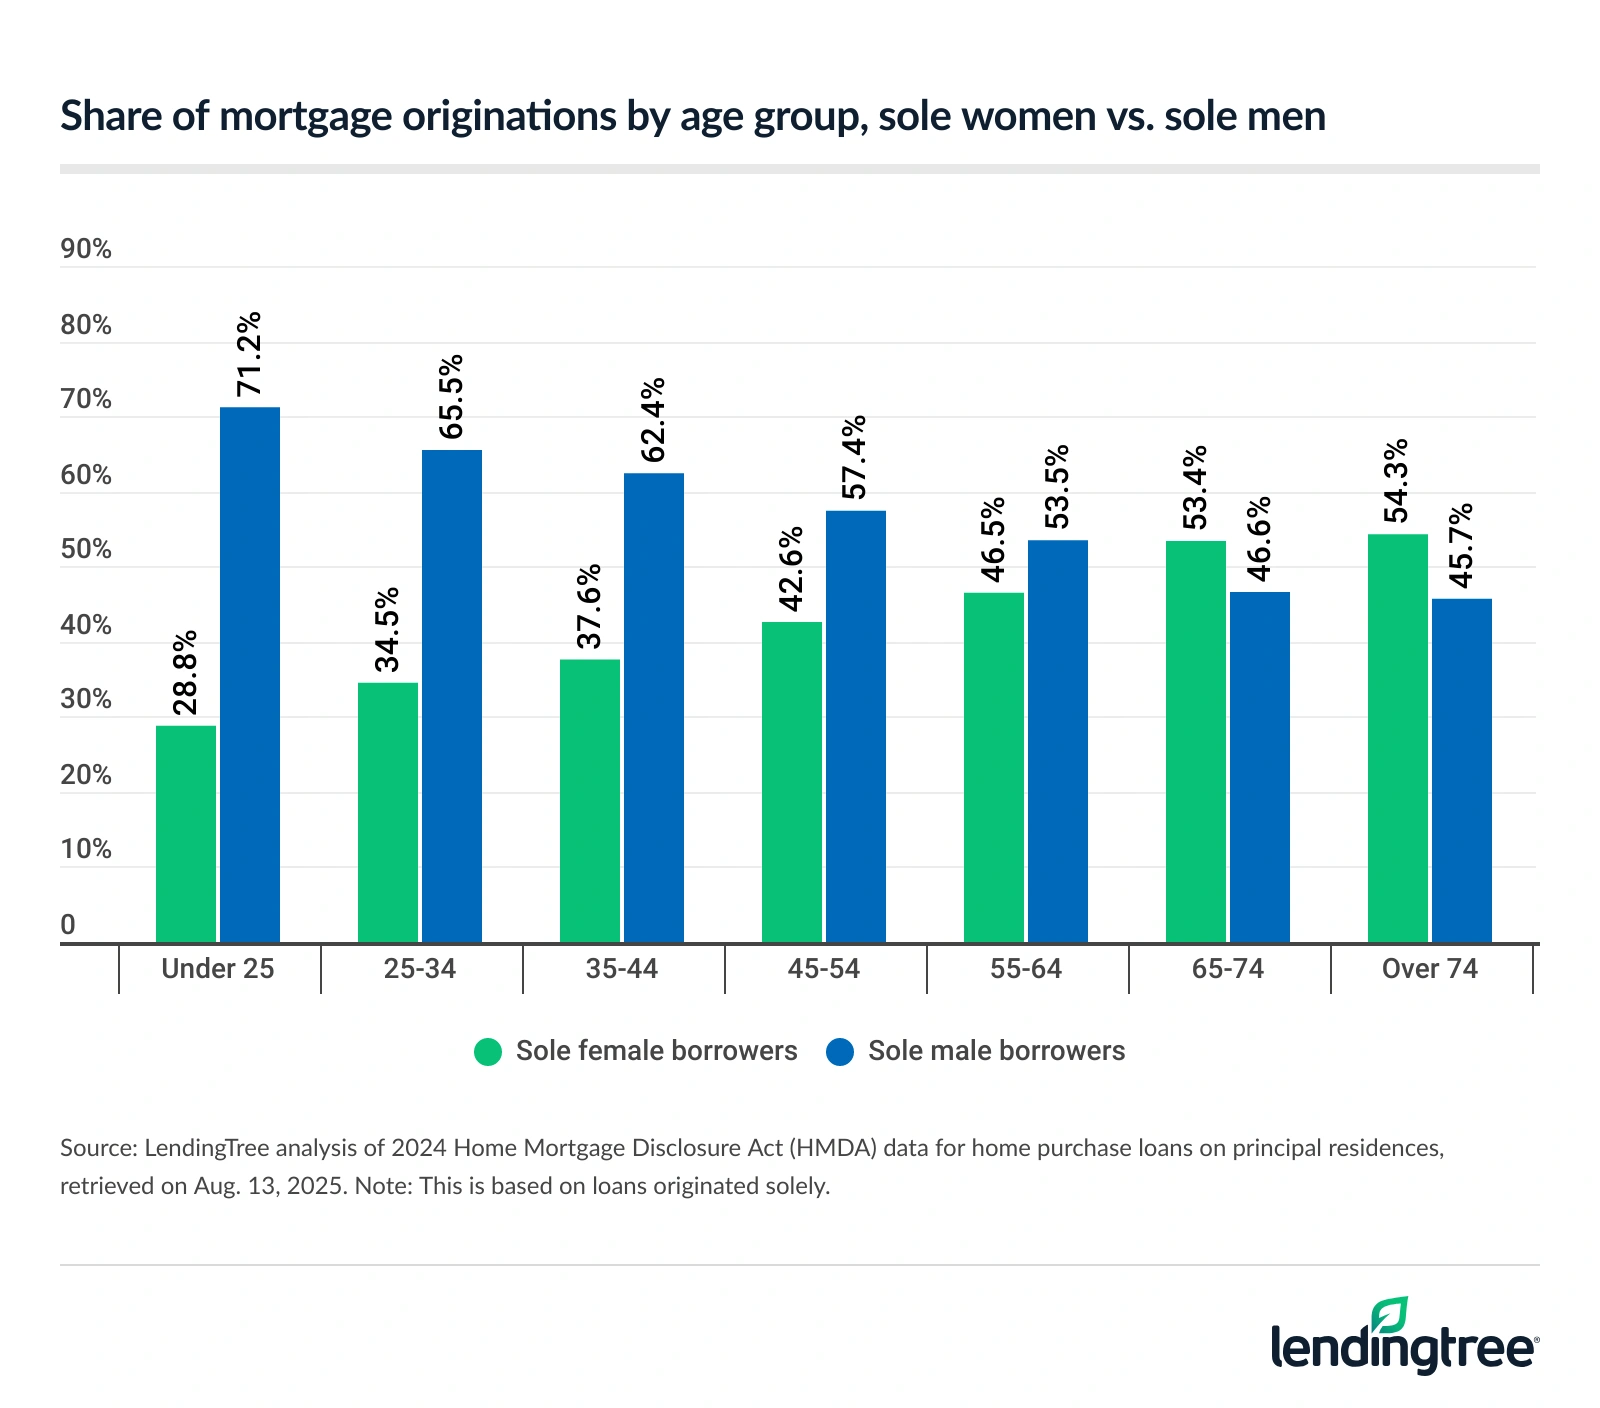
The gap narrows with age, with women outpacing men in the 65-to-74 and over-74 age groups.
Across all DTI brackets, sole men make up the majority of sole originations, ranging from 58.0% in the 43% to 49% bracket to 69.2% in the over-60% bracket.
Comparison of sole female vs. sole male originations by DTI bracket
| DTI bracket | Sole female borrowers (%) | Sole male borrowers (%) |
|---|---|---|
| Less than 20% | 31.2% | 68.8% |
| 20% to 29% | 34.6% | 65.4% |
| 30% to 35% | 36.4% | 63.6% |
| 36% to 42% | 38.8% | 61.2% |
| 43% to 49% | 42.0% | 58.0% |
| 50% to 60% | 38.4% | 61.6% |
| More than 60% | 30.8% | 69.2% |
Homebuying as a sole woman: Top expert tips
If you’re looking to take out a mortgage as a sole female buyer, the path to success may not be easy. Still, there are a few ways to improve your approval odds. We offer the following advice:
- Get your credit in order as much as you can. “If you’re not in the market for a home right now but know you will be someday, focus in the interim on improving your credit,” Schulz says. “Knock down your debt as much as possible. Set up autopay to make sure you never miss a payment. Check your credit report to make sure it’s accurate. These are just a few of the things you can do to make a difference in your credit. It all matters because a higher credit score can mean a significantly lower mortgage APR, and that can save you thousands of dollars over the life of that mortgage.”
- Shop around for the lowest rates. “It’s old, clichéd advice, but it’s still some of the best,” he says. “Rates can vary significantly among different lenders and even a reduction of a fraction of a point can save you thousands of dollars in interest over the years. If you don’t take the time to shop around and compare rates, you’re probably paying too much, and that’s the last thing any of us needs today.”
- Consider consolidating your other debts to reduce your interest payments. “Improving your DTI ratio can go a long way toward improving your chances of getting a mortgage,” he says. “However, it’s obviously easier said than done, but a debt consolidation loan can help. Not only can it reduce the amount of interest you pay on that debt and shrink the payoff period, but it can also streamline your finances by reducing multiple payments down to one. Still, when it comes to getting a mortgage, consolidation is more of a long-term strategy than a short-term fix. It may be best employed a year or more before you plan to apply for the mortgage.”
Methodology
LendingTree researchers analyzed 2024 Home Mortgage Disclosure Act (HMDA) data for home purchase loans on principal residences, retrieved on Aug. 13, 2025. Borrowers with no co-borrower were classified as “sole.”
The following application outcomes were included:
- Loans originated
- Applications denied
- Applications withdrawn
- Applications closed due to being incomplete
- Applications approved but not accepted by the borrower
Preapproval requests, whether approved or denied, were excluded. We calculated the:
- Share of applicants who are sole women or sole men, excluding records with unavailable gender.
- Denial rates for sole women and sole men.
- Distribution of sole borrowers by loan type, age group and debt-to-income (DTI) brackets — based on loans originated solely.
Separately, we analyzed 2024 HMDA originations for sole borrowers, limited to home purchase loans for principal residences that were conventional 30-year, fixed-rate mortgages. Adjustable-rate loans were excluded by removing loans with a nonzero introductory-rate period.
For each gender and state, we calculated the average loan amounts and average interest rates, and estimated the monthly principal and interest payment using a standard 360-month amortization.
View mortgage loan offers from up to 5 lenders in minutes