First-Time Homebuyers Get Smaller Loans, Put Less Down — and Pay Higher Rates


Looking to buy your first home? Expect to get a smaller loan and pay higher rates.
That’s one unfortunate takeaway from a LendingTree analysis of more than 89,000 mortgage purchase inquiries made on our platform in 2025. We also found that first-time homebuyers plan to make smaller down payments than repeat buyers, and that there’s one state in which first-time buyers dominate the market.
Here’s more on what we found.
Millions of Americans come to LendingTree to compare mortgage rates and connect with lenders. To do so, they complete a form we call a mortgage purchase inquiry.
This form isn’t a formal application. It’s an informational form where the potential borrower answers key questions, including how much they want to borrow, how much they plan to put down, when they plan to buy, how they plan to use the property and where it’ll be located.
These forms provide the basis for much of this analysis. However, it’s important to understand that we limited our sample to consumers who were seeking a 30-year, fixed-rate mortgage and had a credit score of at least 620. That means this report represents a slice of the overall U.S. housing market rather than the entire market. It’s a significant slice, but it’s still just a slice.
Also, the report utilizes information, including APRs, from offers received by those who filled out a mortgage purchase inquiry.
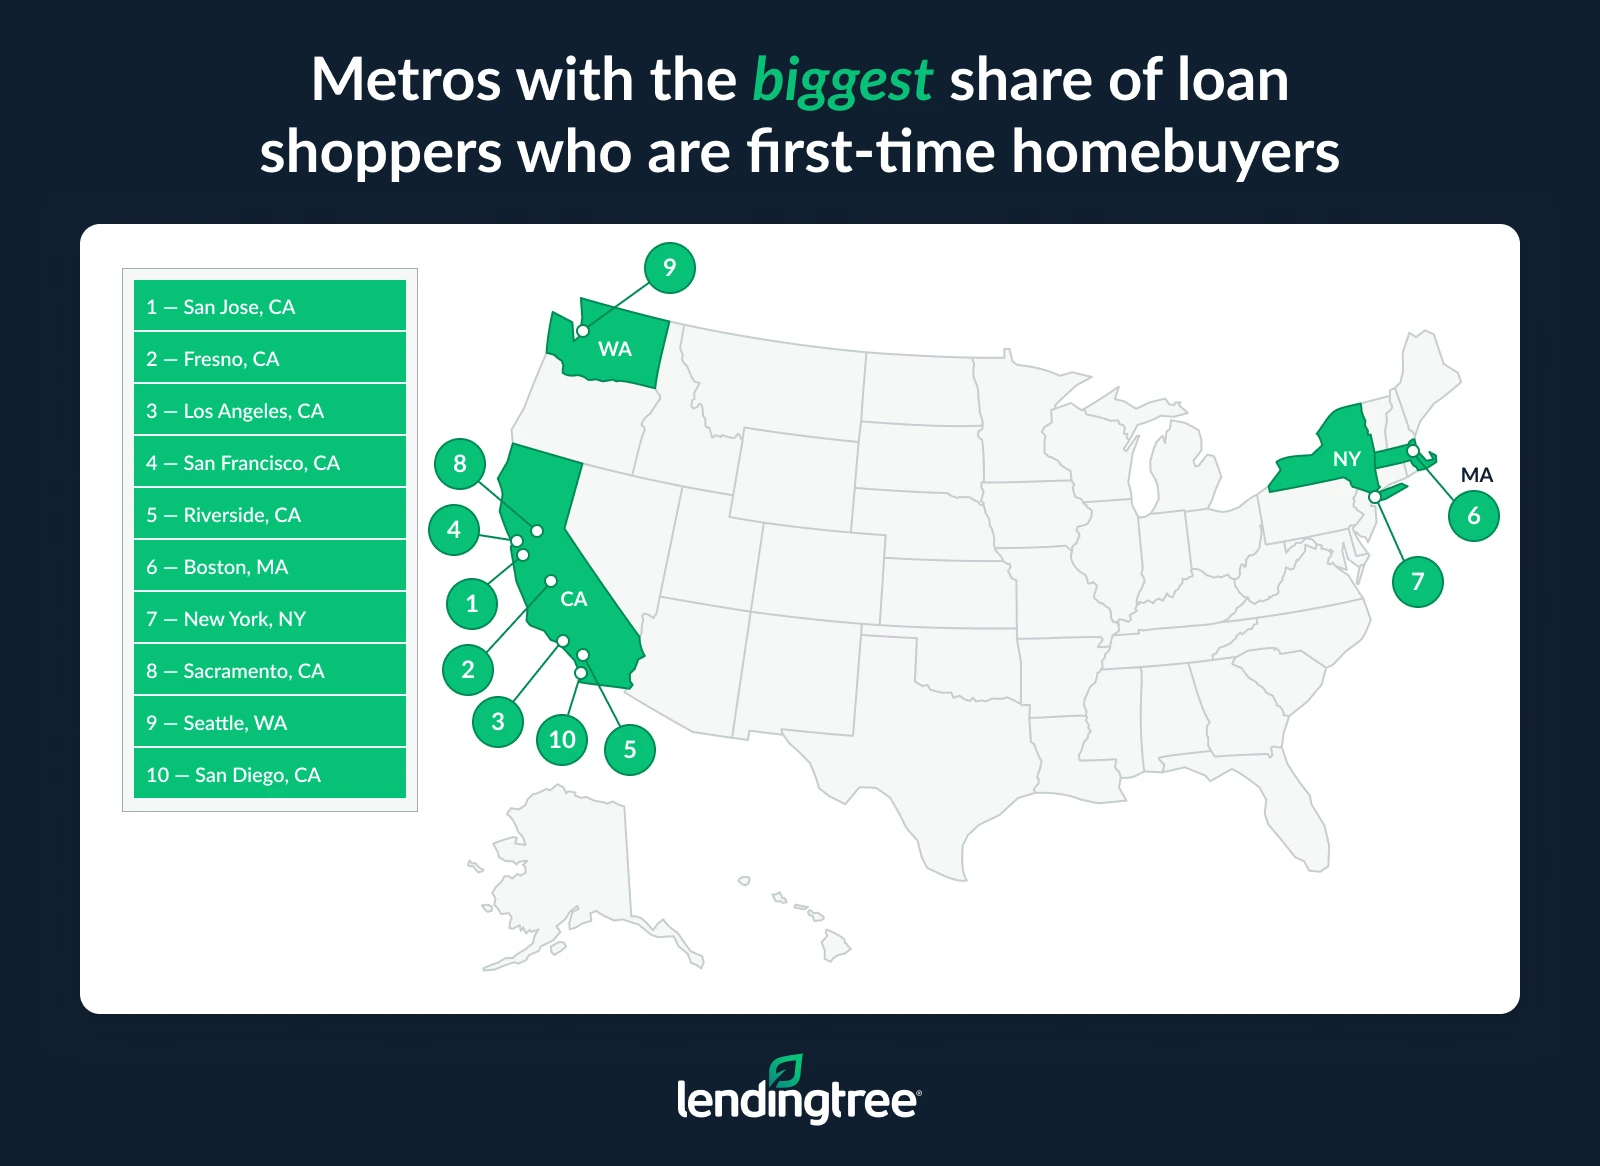
- California dominates the metros where first-time buyers make up the biggest share of the market. Seven of the top 10 metros are in the Golden State, led by San Jose (75.2%), Fresno (73.2%) and Los Angeles (72.9%). The only non-California metros in the top 10 are Boston (68.8%), New York (68.5%) and Seattle (66.9%).
- First-time homebuyers are younger, earn less and have lower credit scores than repeat buyers. On the LendingTree platform, first-time buyers are on average 37.5 years old, up from 35.8 a year ago. They earn $95,309 a year and have a 707 credit score. That compares with 50.5 years old, $140,029 in annual income and a 736 credit score among repeat buyers. Even so, first-timers receive nearly as many offers (5.0 on average, versus 5.3).
- They also borrow less and put down far less, yet they pay slightly higher interest rates. The typical first-time buyer loan is $304,111 at a 6.44% APR, compared with $337,300 at a 6.35% APR among repeat buyers. First-time buyers also put down an average of 13.8% ($55,471), compared with 22.8% ($119,270) among repeat buyers. 30.5% of first-time buyers say they intend to put down less than 10%, compared with 14.8% of repeat buyers.
- First-time buyers may have smaller payments, but the impact on their budgets is greater. They spend an average of 23.2% of their annual income on principal and interest payments each month, compared with 17.4% among repeat buyers, even though their average monthly payment is lower ($1,844 versus $2,030).
California dominates the metros where first-time buyers make up the biggest share of the market
Our analysis of mortgage purchase inquiries on the LendingTree platform in 2025 revealed that at least 55.0% of inquiries in every major U.S. metro were from first-time homebuyers. That may be surprising given how expensive homebuying is today and how many headlines have been written about younger Americans giving up on homeownership. That is what our analysis showed us, however, and perhaps most surprisingly, many of the nation’s most expensive housing markets are among the most likely to be dominated by first-time homebuyers.
Seven of the 10 metros where the largest share of loan shoppers are first-time homebuyers are in California. That includes the top five: San Jose (75.2%), Fresno (73.2%), Los Angeles (72.9%), San Francisco (71.0%) and Riverside (69.6%). The only non-California metros in the top 10 are Boston (68.8%), New York (68.5%) and Seattle (66.9%).
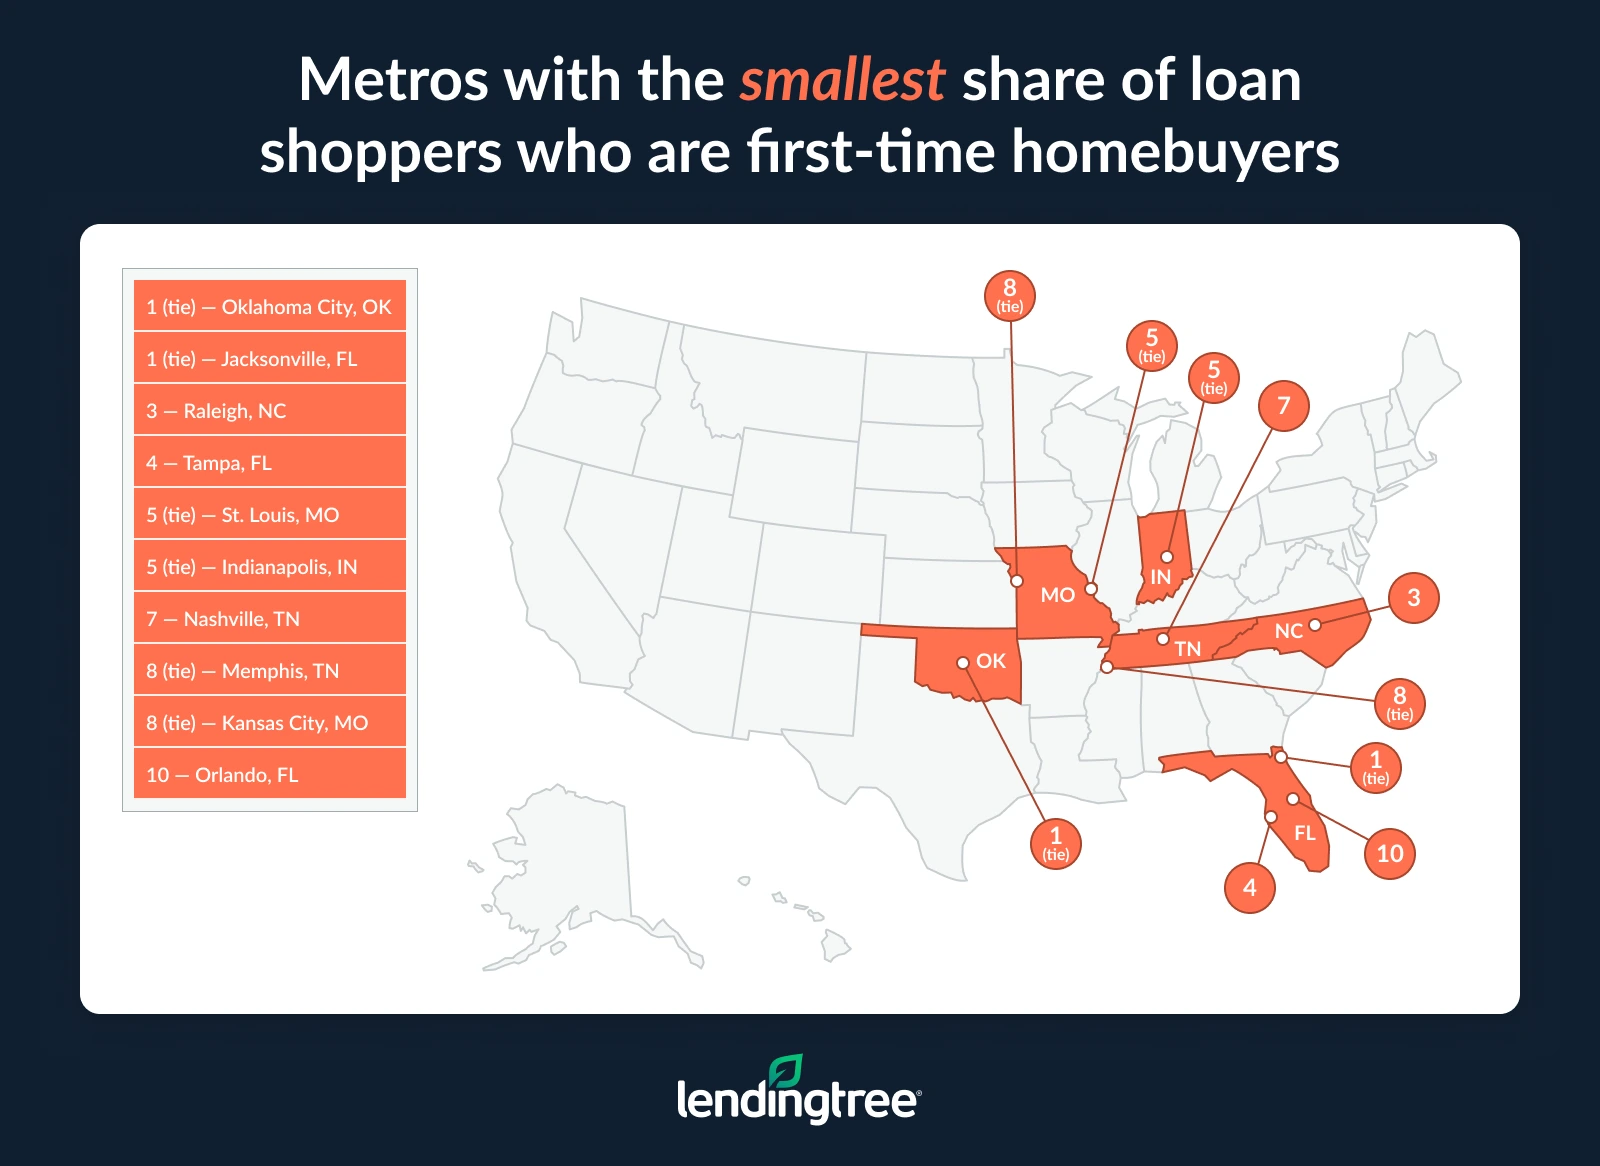
At the other end of the list, just 55.6% of loan shoppers in Oklahoma City and Jacksonville, Fla., are first-time buyers. Raleigh, N.C. (56.4%), Tampa, Fla. (56.5%), and St. Louis and Indianapolis (both 56.7%) aren’t far behind.
While metros with higher percentages of first-time buyers are primarily coastal, those at the bottom of the list are mostly Southern or Midwestern.
The gap between San Jose (75.2%) and Oklahoma City and Jacksonville (both 55.6%) is nearly 20 percentage points. However, that’s far from the only difference. For example, the average loan amount in San Jose is $642,766, while the combined average loan amounts in Oklahoma City ($218,830) and Jacksonville ($253,777) are just $472,607. Also, the average credit score for a first-time buyer in San Jose is 726. In Oklahoma City and Jacksonville, it’s 701 and 713, respectively.
That last part is surely significant, as your credit score plays a huge role in your ability to get a home. Add in the fact that San Jose residents have one of the highest incomes in the nation, and it stands to reason that they would be at the top of this list, despite the high cost of housing in the area.
Metros with the highest share of first-time homebuyers
| Rank | Metro | Share of loan shoppers who are first-time buyers | Avg. age | Avg. credit score | Avg. down payment | Avg. loan amount | Avg. monthly mortgage payment |
|---|---|---|---|---|---|---|---|
| 1 | San Jose, CA | 75.2% | 39.7 | 726 | $165,225 | $642,766 | $3,946 |
| 2 | Fresno, CA | 73.2% | 37.4 | 699 | $53,381 | $329,954 | $1,980 |
| 3 | Los Angeles, CA | 72.9% | 40.3 | 719 | $131,966 | $537,185 | $3,256 |
| 4 | San Francisco, CA | 71.0% | 39.1 | 723 | $170,553 | $626,110 | $3,834 |
| 5 | Riverside, CA | 69.6% | 41.3 | 712 | $66,682 | $403,856 | $2,416 |
| 6 | Boston, MA | 68.8% | 36.2 | 716 | $111,487 | $446,471 | $2,697 |
| 7 | New York, NY | 68.5% | 39.3 | 720 | $103,105 | $425,802 | $2,559 |
| 8 | Sacramento, CA | 68.2% | 39.7 | 713 | $68,039 | $402,418 | $2,398 |
| 9 | Seattle, WA | 66.9% | 37.7 | 718 | $109,626 | $482,161 | $2,891 |
| 10 | San Diego, CA | 66.2% | 39.2 | 715 | $113,255 | $528,304 | $3,194 |
| 11 | Philadelphia, PA | 65.4% | 36.9 | 712 | $58,677 | $304,958 | $1,828 |
| 12 | Providence, RI | 64.3% | 37.6 | 712 | $66,849 | $335,672 | $2,030 |
| 13 | Milwaukee, WI | 64.2% | 34.5 | 708 | $49,581 | $275,273 | $1,661 |
| 14 | Salt Lake City, UT | 63.6% | 35.2 | 711 | $71,810 | $380,716 | $2,302 |
| 15 | Chicago, IL | 63.3% | 37.0 | 713 | $60,056 | $297,227 | $1,799 |
| 15 | Pittsburgh, PA | 63.3% | 36.0 | 711 | $36,365 | $220,618 | $1,338 |
| 17 | Houston, TX | 62.9% | 38.6 | 703 | $47,333 | $278,795 | $1,709 |
| 18 | Virginia Beach, VA | 62.6% | 38.2 | 702 | $38,268 | $276,407 | $1,691 |
| 19 | Miami, FL | 62.4% | 41.5 | 712 | $75,943 | $365,270 | $2,197 |
| 20 | Hartford, CT | 62.2% | 37.4 | 713 | $57,534 | $292,507 | $1,758 |
| 20 | Washington, DC | 62.2% | 38.6 | 712 | $78,886 | $396,980 | $2,385 |
| 22 | Cleveland, OH | 62.0% | 36.9 | 707 | $38,766 | $223,538 | $1,350 |
| 22 | Dallas, TX | 62.0% | 37.0 | 706 | $54,743 | $320,648 | $1,954 |
| 24 | Baltimore, MD | 61.1% | 37.3 | 710 | $58,897 | $305,553 | $1,832 |
| 25 | Columbus, OH | 61.0% | 36.0 | 707 | $43,533 | $257,242 | $1,558 |
| 26 | Austin, TX | 60.9% | 36.1 | 711 | $61,600 | $337,392 | $2,052 |
| 27 | Las Vegas, NV | 60.1% | 41.7 | 706 | $59,675 | $358,864 | $2,174 |
| 28 | Detroit, MI | 60.0% | 36.0 | 708 | $44,591 | $238,072 | $1,447 |
| 29 | Minneapolis, MN | 59.9% | 33.9 | 710 | $50,085 | $289,448 | $1,748 |
| 30 | Denver, CO | 59.7% | 36.4 | 713 | $71,278 | $394,216 | $2,342 |
| 31 | Cincinnati, OH | 58.3% | 35.1 | 706 | $38,500 | $231,867 | $1,413 |
| 32 | Charlotte, NC | 58.1% | 36.3 | 709 | $54,745 | $318,143 | $1,905 |
| 32 | Grand Rapids, MI | 58.1% | 33.1 | 709 | $46,052 | $243,748 | $1,481 |
| 34 | San Antonio, TX | 58.0% | 39.2 | 698 | $40,268 | $263,270 | $1,628 |
| 35 | Louisville, KY | 57.8% | 35.7 | 702 | $40,787 | $240,756 | $1,466 |
| 35 | Phoenix, AZ | 57.8% | 38.8 | 707 | $59,136 | $339,336 | $2,034 |
| 35 | Portland, OR | 57.8% | 38.7 | 713 | $68,212 | $364,287 | $2,173 |
| 38 | Richmond, VA | 57.7% | 36.7 | 708 | $51,308 | $281,267 | $1,702 |
| 39 | Birmingham, AL | 57.6% | 33.9 | 697 | $39,146 | $234,157 | $1,431 |
| 40 | Atlanta, GA | 57.5% | 38.2 | 702 | $52,367 | $309,651 | $1,873 |
| 41 | Orlando, FL | 57.3% | 40.5 | 710 | $55,575 | $310,982 | $1,862 |
| 42 | Kansas City, MO | 57.2% | 34.5 | 704 | $37,521 | $258,368 | $1,573 |
| 42 | Memphis, TN | 57.2% | 38.3 | 699 | $36,516 | $251,875 | $1,530 |
| 44 | Nashville, TN | 56.8% | 35.6 | 709 | $58,784 | $327,406 | $1,967 |
| 45 | Indianapolis, IN | 56.7% | 35.1 | 703 | $35,473 | $252,849 | $1,543 |
| 45 | St. Louis, MO | 56.7% | 35.6 | 703 | $39,915 | $243,545 | $1,484 |
| 47 | Tampa, FL | 56.5% | 40.4 | 712 | $47,518 | $289,879 | $1,741 |
| 48 | Raleigh, NC | 56.4% | 36.9 | 711 | $55,646 | $325,086 | $1,954 |
| 49 | Jacksonville, FL | 55.6% | 41.1 | 713 | $39,720 | $253,777 | $1,529 |
| 49 | Oklahoma City, OK | 55.6% | 36.6 | 701 | $30,991 | $218,830 | $1,340 |
First-time homebuyers are younger, earn less and have lower credit scores than repeat buyers
Zooming out a bit, we find that first-time homebuyers on the LendingTree platform make up 59.2% of all mortgage purchase inquiries, up slightly from 57.3% a year ago.
The average first-time buyer in 2025 is a little older, earns a little less and has a slightly lower credit score than the average 2024 first-time homebuyer.
First-time buyers are 37.5 years old on average. That’s up from 35.8 a year ago. They earn $95,309 a year and have a credit score of 707.
First-time homebuyers are older in 2025, receive more offers and earn less than in 2024
| Attribute | First-time buyers, 2024 | First-time buyers, 2025 | Change (%) |
|---|---|---|---|
| Avg. credit score | 710 | 707 | -0.4% |
| Avg. age | 35.8 | 37.5 | 4.8% |
| Avg. annual income | $100,889 | $95,309 | -5.5% |
| Avg. offers received | 3.3 | 5.0 | 53.7% |
| % of loan inquiries | 57.3% | 59.2% | 3.4% |
When compared with repeat buyers, some distinct differences emerge. The average repeat homebuyer is 50.5 years old, earns $140,029 a year and has a credit score of 736. Still, they receive about the same number of offers from lenders via the LendingTree platform (5.0 for first-timers versus 5.3 for repeat buyers).
First-time homebuyers are younger, earn less and have lower credit scores than repeat buyers
| Attribute | Repeat buyers | First-time buyers |
|---|---|---|
| Avg. credit score | 736 | 707 |
| Avg. age | 50.5 | 37.5 |
| Avg. annual income | $140,029 | $95,309 |
| Avg. offers received | 5.3 | 5.0 |
| % of loan inquiries | 40.8% | 59.2% |
| % of inquiries that were for FHA loans | 2.9% | 5.4% |
They also borrow less and put down far less, yet they pay slightly higher rates
Given that first-time homebuyers have lower credit scores and lower incomes than repeat buyers, it makes sense that they would request smaller loans, make smaller down payments and receive less favorable offers. That’s exactly what we found, though the gap in one key area may not be as large as you’d expect.
The typical first-time buyer requested a loan of $304,111, 9.8% less than the $337,300 requested by repeat buyers. We also found that repeat buyers’ average intended down payment is more than double that of first-time buyers. First-time buyers said they intend to put down an average of $55,471 (13.8% of the loan amount), compared with $119,270 (22.8%) among repeat buyers.
That’s a massive difference and a really big deal because a down payment of 20% allows you to avoid private mortgage insurance (PMI), dramatically reducing your monthly costs. Nearly a third of first-time buyers (30.5%) say they intend to put down less than 10%, compared with just 14.8% of repeat buyers. However, it’s important to note that these numbers are intended down payments, not the amounts borrowers ultimately put down.
Repeat buyers are also offered lower APRs on average than first-time buyers (6.35% versus 6.44%). That’s a significant difference — on massive purchases such as mortgages, even a slightly lower APR can mean thousands of dollars in savings — but perhaps not as wide a gap as one might expect, given other differences between the two groups of buyers.
First-time buyers take out smaller loans and put less down, but they pay slightly higher interest rates
| Attribute | Repeat buyers | First-time buyers | Difference (%) |
|---|---|---|---|
| Avg. loan amount | $337,300 | $304,111 | 9.8% |
| Avg. APR | 6.35% | 6.44% | -1.4% |
| Avg. down payment | $119,270 | $55,471 | 53.5% |
| Avg. down payment (%) | 22.8% | 13.8% | 39.5% |
| Avg. monthly mortgage payment | $2,030 | $1,844 | 9.2% |
First-time buyers may have smaller payments, but the impact on their budgets is greater
Despite the smaller down payments and higher interest rates, first-time buyers still tend to pay less each month toward principal and interest than repeat buyers ($1,844 versus $2,030). That’s largely due to their average loan amounts being significantly smaller.
Still, those costs represent a significantly larger burden for first-time homebuyers. They spend an average of 23.2% of their annual income on these payments, compared with 17.4% among repeat buyers.
It’s also important to note that our report may underestimate this burden. The above numbers don’t factor in PMI or other monthly costs that often get rolled into monthly payments. PMI can cost between $30 and $70 a month for every $100,000 you borrow — $90 to $210 a month on a $300,000 mortgage. That’s a lot of money for the average household, and a price that first-time buyers are significantly more likely to have to pay.
First-time buyers devote a larger share of income to housing costs despite lower monthly payments
| Attribute | Repeat buyers | First-time buyers |
|---|---|---|
| Avg. annual income | $140,029 | $95,309 |
| Avg. monthly mortgage payment | $2,030 | $1,844 |
| Avg. annual mortgage payment | $24,360 | $22,124 |
| % of income spent on mortgage | 17.4% | 23.2% |
No matter how many times you’ve bought, some advice remains the same
A home is the biggest purchase most people will ever make. Whether buying for the first time or the 10th, it’s important to approach the purchase cautiously and try to control what you can. (Believe it or not, there are plenty of things you can control.)
Here’s how you can do that:
- Shop around for the best mortgage rate. This is an absolute must. If you’re not taking the time to compare rates among various lenders, there’s a good chance you’re paying too much. There can be significant differences in offers from one lender to the next, and it only takes a slightly lower interest rate to save thousands of dollars over the life of the mortgage.
- Crunch the numbers to understand what you can really afford. Is it flattering to be told you can get a massive mortgage? Sure. However, just because someone is willing to offer you money doesn’t mean that you have to take it or that you can afford to pay it back. LendingTree’s mortgage affordability calculator can help you determine what can really work for you. Just make sure that you take into account PMI, property taxes, homeowners association fees and other such costs when you’re doing the calculations. Otherwise, you won’t get the most accurate picture of what you can afford.
- Consider different types of loans. A conventional 30-year, fixed-rate mortgage isn’t the only game in town. Our report found that 5.4% of inquiries from first-time homebuyers are for Federal Housing Administration (FHA) loans, nearly double the 2.9% among repeat buyers. FHA loans allow down payments as low as 3.5%, making them an appealing option for first-time buyers. However, it’s just one of many alternatives, including Veterans Affairs (VA) loans, U.S. Department of Agriculture (USDA) loans and adjustable-rate mortgages. You may not qualify for all of these different types of loans, but they can be worth looking into at a minimum.
- Be flexible about location. It’s the oldest cliche in real estate, but where you live matters a lot. Being flexible about where you look, even within your area, can have a massive impact on the price you pay for your home. Of course, that doesn’t mean that you should sacrifice all your other priorities to save a few thousand dollars on a home. Things like school systems, length of commute, safety, proximity to friends and family, access to child care and other factors can be incredibly important, too. However, if you’re willing to be a little more flexible in your house hunt, it can bring real savings.
- Improve your credit. There’s little in life that’s more expensive than having poor credit. People with good credit get the best deals from lenders, and that’s rarely more important than it is when shopping for a home. If you know that you want to buy a home in the next year or so, start working on your credit today. Check your credit report to make sure there aren’t inaccuracies holding your score down. Automate your bill payments to make sure that you’re never late. Consolidate your debts to knock down your interest rates and speed up your payoff time. These are just a few things that can help.
Methodology
LendingTree analysts examined about 89,000 mortgage purchase inquiries made on the LendingTree platform between Jan. 1 and Dec. 31, 2025. The analysis was limited to borrowers seeking 30-year, fixed-rate mortgages with credit scores of at least 620. Borrowers were classified as first-time or repeat buyers.
When borrowers received multiple offers, researchers selected the offer with the lowest APR for analysis. Income figures are self-reported by borrowers, and all loan terms reflect lender quotes rather than final or accepted loans.
Down payment percentages and amounts were calculated using lender-reported offer data and estimated home values derived from the loan amount plus the down payment. Monthly mortgage payments reflect principal and interest only and exclude taxes, insurance and fees that may have been rolled into the loan’s principal value.
View mortgage loan offers from up to 5 lenders in minutes