14.9 Million Homes Are Vacant in the US — Here Are the States With the Highest Vacancy Rates


Home vacancy rates reveal more than just empty houses — they offer a window into the overall housing market. High vacancy rates can indicate oversupply or declining demand, which could lead to lower property values and slower economic growth. For renters, however, declining demand could drive prices down, amp up affordability and offer a better shot at homeownership.
So, where do things stand today? Our latest LendingTree study dives into U.S. Census Bureau data to look at vacancy rates and home values across the country and by state. Read on for what we found.
Key findings
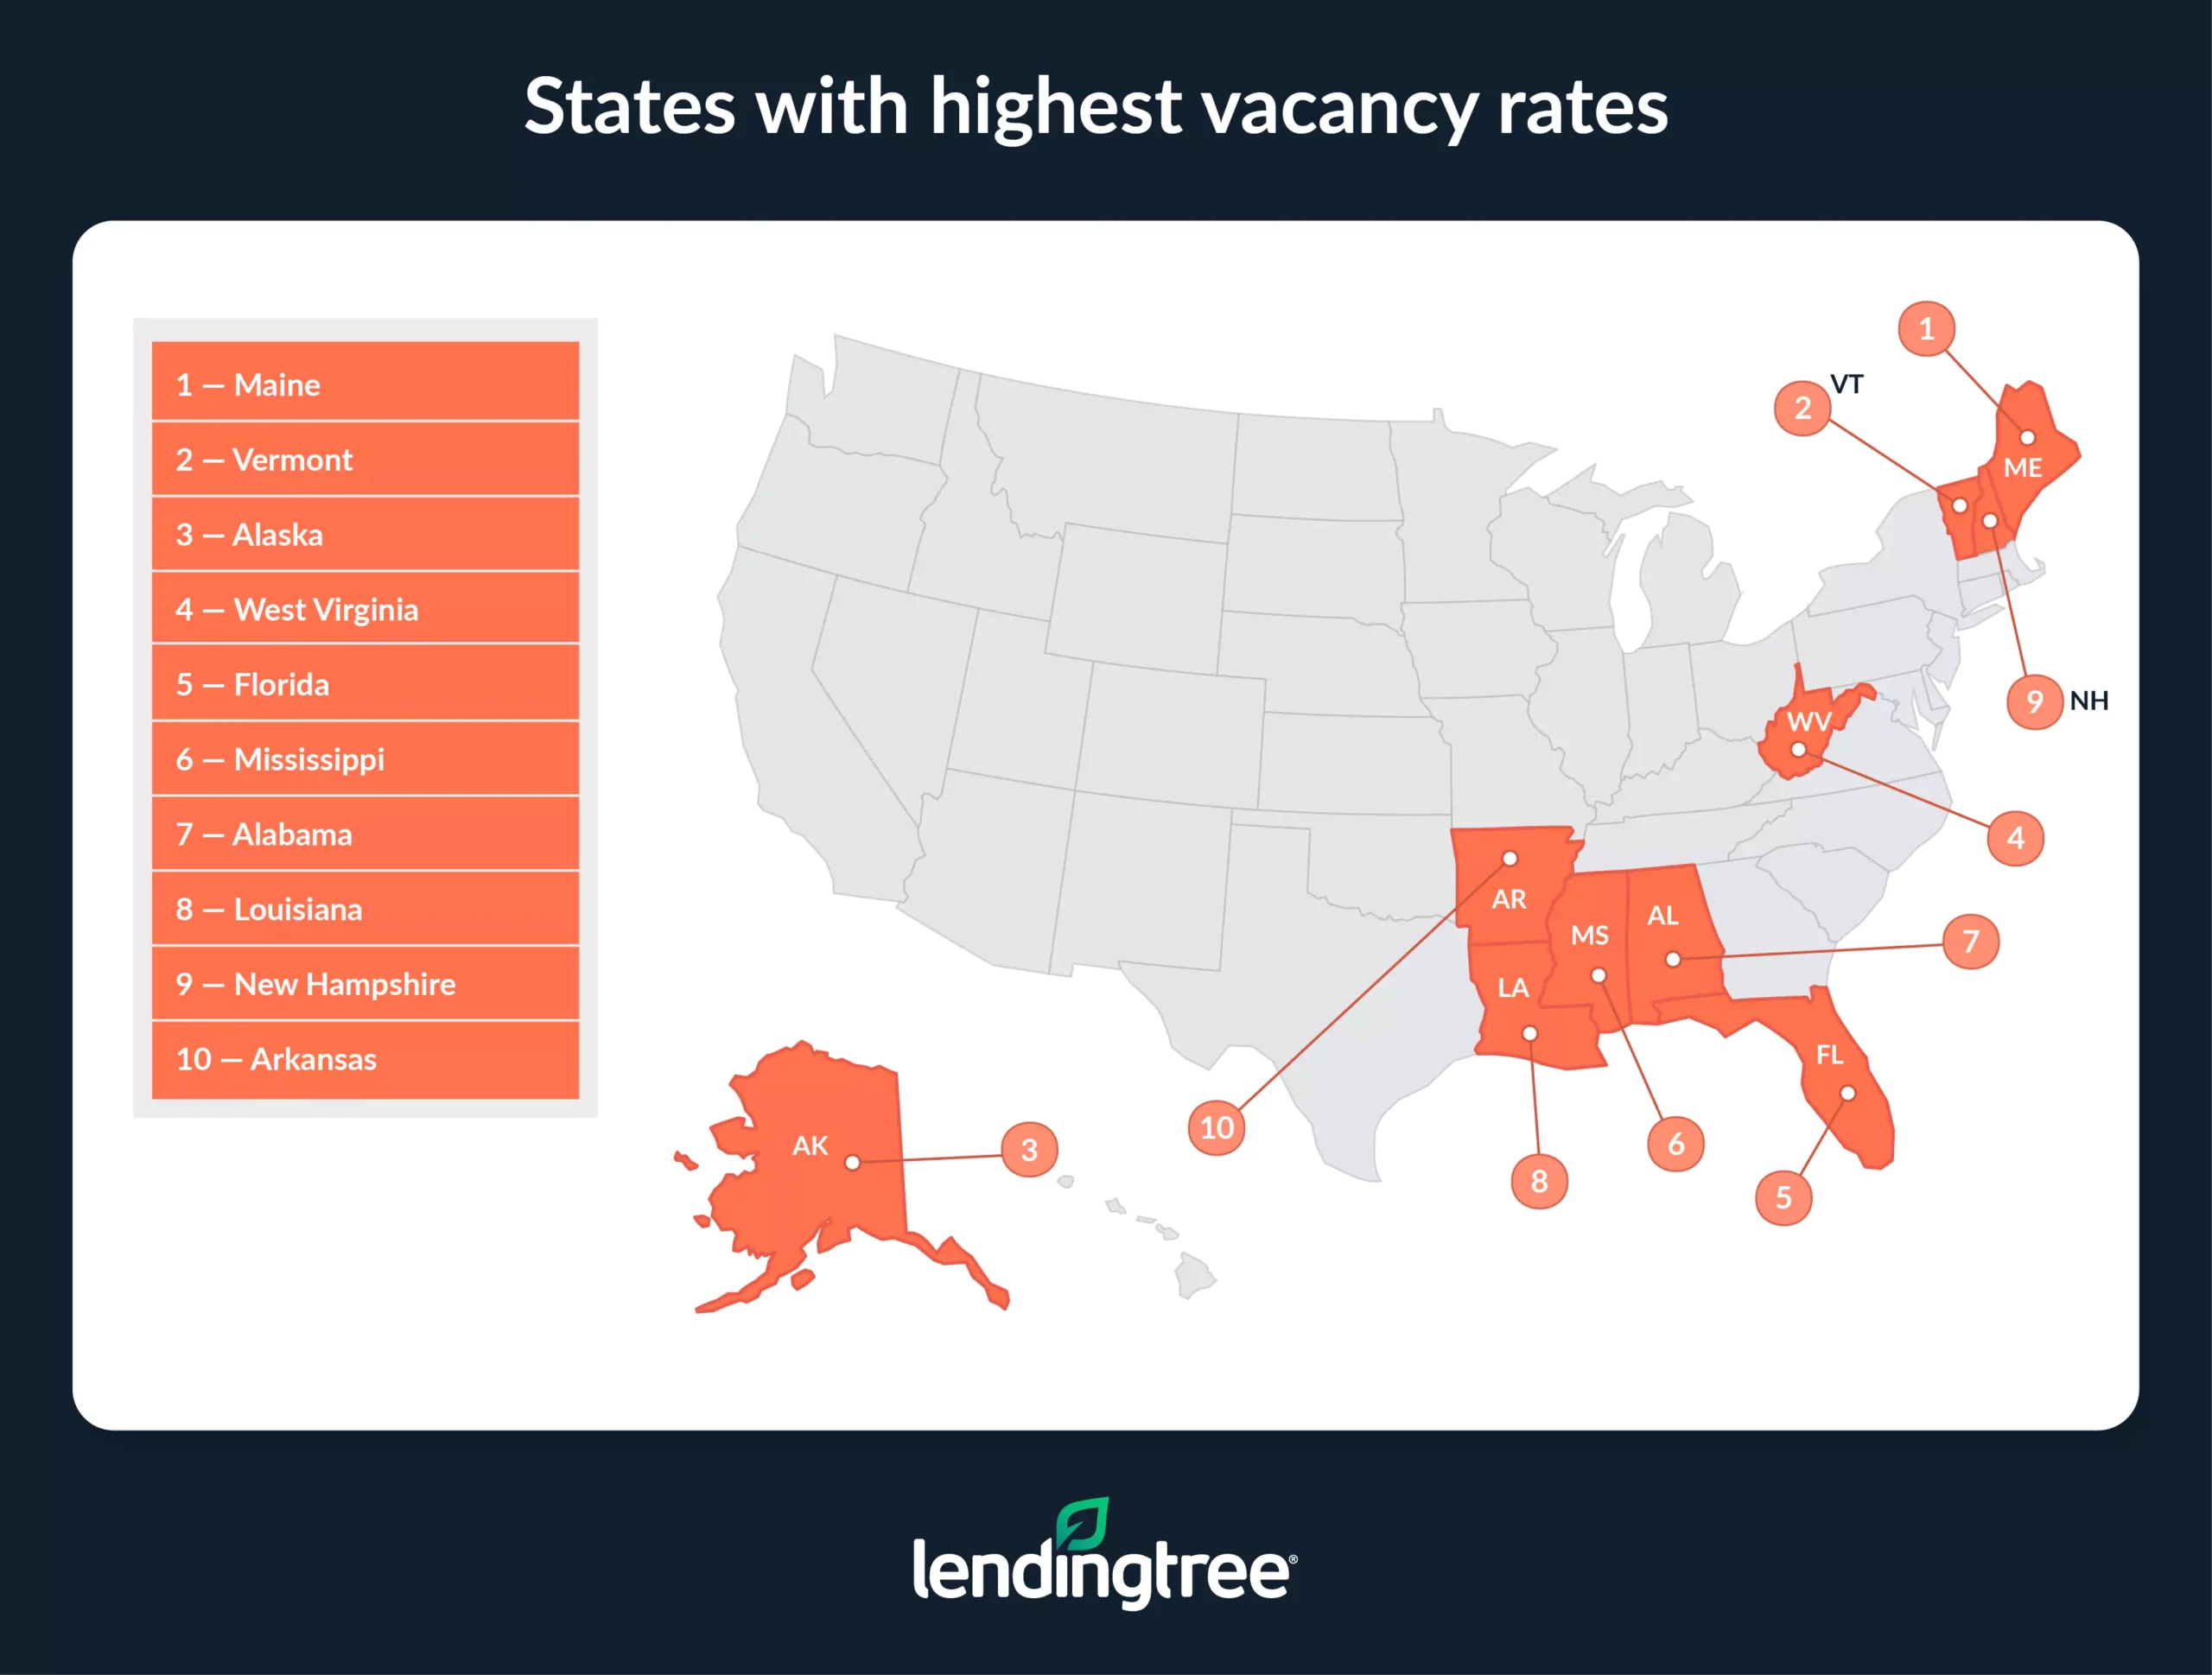
- Maine, Vermont and Alaska have the highest vacancy rates. Vacancy rates in these states are 21.09%, 20.06% and 18.24%, respectively. These states account for nearly 285,000 vacant homes combined.
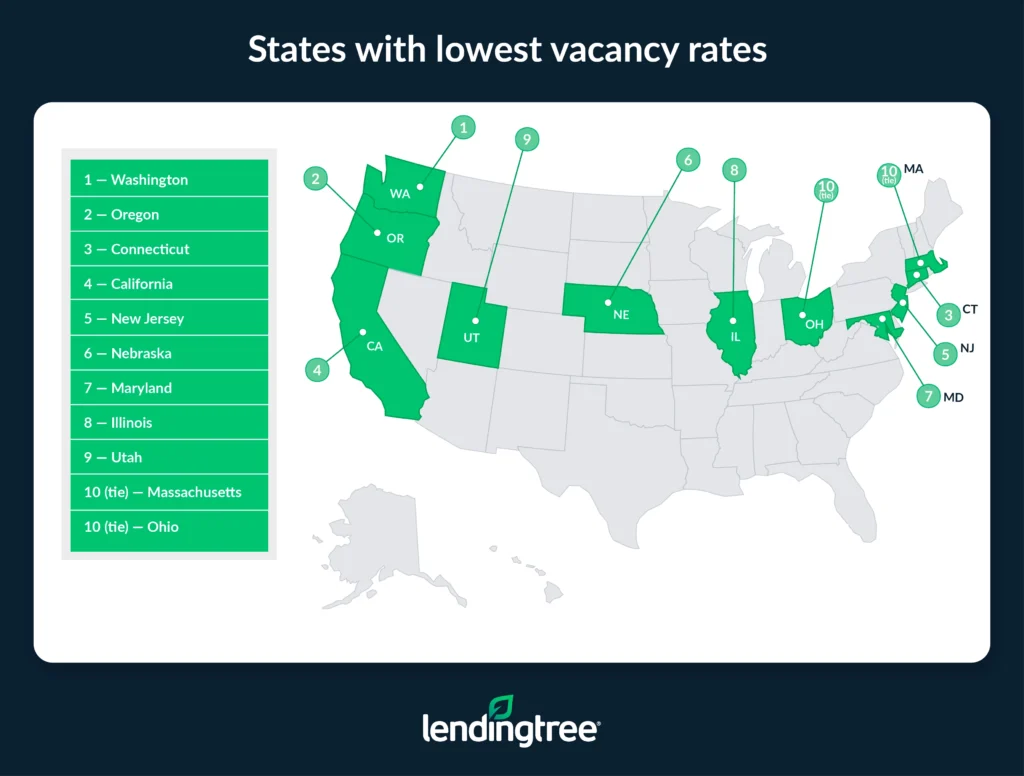
- Washington, Oregon and Connecticut have the lowest vacancy rates. The vacancy rate is 7.42% in Washington. Oregon (7.46%) and Connecticut (7.54%) follow closely. Despite the lower rates, these states collectively have over 495,000 vacant homes — more than 200,000 higher than the amount in Maine, Vermont and Alaska.
- Vacancy rates are down in every state but one. Vacancy rates in the U.S. fell 0.36 percentage points between 2022 and 2023. The states with the biggest percentage point decreases were Wyoming (0.89), Alabama (0.85) and North Dakota and Montana (both 0.77). Meanwhile, vacancy rates rose by 0.05 percentage points in Washington — the only state with an increase.
- States with low vacancy rates have significantly higher median home values than states with high vacancy rates. Across the 10 states with the lowest vacancy rates, the median home values average $408,382. Meanwhile, median home values average $247,850 in the 10 with the highest vacancy rates. Despite this, New Hampshire ($367,200), Alaska ($333,300) and Florida ($325,000) all have higher-than-median home values despite their high vacancy rates.
Highest vacancy rates: Maine, Vermont, Alaska
Vacancy rates differ significantly depending on where you look in the country. If you’re looking at Maine, you’ll find the highest vacancy rate in the country — 21.09% (157,467 vacant homes), according to our analysis of the U.S. Census Bureau 2023 American Community Survey (ACS) with five-year estimates. Following Maine at the top is Vermont, with a 20.06% vacancy rate (67,606 vacant homes), and Alaska, with an 18.24% vacancy rate (59,745 vacant homes).
Together, these three states account for nearly 285,000 vacant homes — out of 14.9 million vacant homes nationwide.
5.6 million homes are vacant in nation’s largest metros
Why the higher vacancy rates in these states? A big part of the answer lies in the Census Bureau’s definition of a vacant house. It’s not just houses sitting empty, but a broader array of properties.
For example, homes are classified as vacant if they’re used for seasonal, recreational or occasional use — and all three of the top three states with the highest vacancy rates have a large percentage of these types of properties due to their locations, weather and recreation opportunities.
National vacancy rate
| Total housing units | Occupied housing units | Vacant housing units | Vacancy rate | Median home value |
|---|---|---|---|---|
| 142,332,876 | 127,482,865 | 14,850,011 | 10.43% | $322,180 |
Nationally, the vacancy rate is much lower than that of these three states, with the U.S. average sitting at 10.43% — a figure that translates into nearly 15 million vacant homes. While that may sound like a lot, it may not feel like it if you’re searching for a place to live. That’s because not all of those properties are available to rent or buy.
In addition to seasonal and vacation homes, others are classified as vacant because they’re in transition — those that are rented but not occupied and sold but not occupied. Homes for migrant workers, which they occupy during crop season, are also classified as vacant.
Lowest vacancy rates: Washington, Oregon, Connecticut
The lowest vacancy rate in the country can be found out west in Washington (7.42%). The Evergreen State is followed by Oregon (7.46%) and Connecticut (7.54%). While these three states’ vacancy rates are low, the combined number of vacant homes in them is significantly higher than in the states with the lowest vacancy rates. Also, Maine (the state with the highest vacancy rate) has 157,467 vacant homes, while Washington (with the lowest vacancy rate) has 242,109 vacant homes.
This is largely due to disparities in the states’ total housing inventory. Those with the lowest vacancy rates have far larger housing inventories than those with the highest vacancy rates. In Maine (again, the state with the highest vacancy rate), there are only 746,552 total housing units, while in Washington (with the lowest vacancy rate), there are 3,262,667 — more than four times as many.
In general, the states with the lowest vacancy rates tend to have higher populations than those with higher rates, creating more demand for housing and thus lower vacancy rates. Also, the lower the number of total housing units in a state, the more significant the impact each vacant home has on the overall vacancy rate.
Full rankings
States with highest/lowest vacancy rates
| Rank | State | Total housing units | Occupied housing units | Vacant housing units | Vacancy rate | Median home value |
|---|---|---|---|---|---|---|
| 1 | Maine | 746,552 | 589,085 | 157,467 | 21.09% | $266,400 |
| 2 | Vermont | 337,072 | 269,466 | 67,606 | 20.06% | $290,500 |
| 3 | Alaska | 327,610 | 267,865 | 59,745 | 18.24% | $333,300 |
| 4 | West Virginia | 859,653 | 721,448 | 138,205 | 16.08% | $155,600 |
| 5 | Florida | 10,082,356 | 8,550,911 | 1,531,445 | 15.19% | $325,000 |
| 6 | Mississippi | 1,332,811 | 1,131,760 | 201,051 | 15.08% | $161,400 |
| 7 | Alabama | 2,316,192 | 1,969,105 | 347,087 | 14.99% | $195,100 |
| 8 | Louisiana | 2,094,002 | 1,783,168 | 310,834 | 14.84% | $208,700 |
| 9 | New Hampshire | 644,253 | 551,186 | 93,067 | 14.45% | $367,200 |
| 10 | Arkansas | 1,382,664 | 1,189,160 | 193,504 | 14.00% | $175,300 |
| 11 | South Carolina | 2,401,638 | 2,070,390 | 331,248 | 13.79% | $236,700 |
| 12 | Delaware | 457,958 | 396,209 | 61,749 | 13.48% | $326,800 |
| 13 | Hawaii | 564,905 | 488,991 | 75,914 | 13.44% | $808,200 |
| 14 | Montana | 522,939 | 452,683 | 70,256 | 13.43% | $338,100 |
| 14 | Wyoming | 275,131 | 238,176 | 36,955 | 13.43% | $285,100 |
| 16 | North Dakota | 374,866 | 325,079 | 49,787 | 13.28% | $241,100 |
| 17 | New Mexico | 949,524 | 825,021 | 124,503 | 13.11% | $232,200 |
| 18 | North Carolina | 4,815,195 | 4,186,924 | 628,271 | 13.05% | $259,400 |
| 19 | Oklahoma | 1,763,036 | 1,542,780 | 220,256 | 12.49% | $185,900 |
| 20 | Michigan | 4,599,683 | 4,040,168 | 559,515 | 12.16% | $217,600 |
| 21 | Missouri | 2,809,501 | 2,484,834 | 324,667 | 11.56% | $215,600 |
| 22 | Wisconsin | 2,750,750 | 2,446,028 | 304,722 | 11.08% | $247,400 |
| 23 | Arizona | 3,142,443 | 2,796,790 | 345,653 | 11.00% | $358,900 |
| 24 | South Dakota | 402,364 | 358,552 | 43,812 | 10.89% | $236,800 |
| 25 | Kentucky | 2,010,655 | 1,791,991 | 218,664 | 10.88% | $192,300 |
| 26 | Idaho | 776,683 | 693,821 | 82,862 | 10.67% | $376,000 |
| 27 | Georgia | 4,483,873 | 4,008,013 | 475,860 | 10.61% | $272,900 |
| 28 | Tennessee | 3,095,472 | 2,768,743 | 326,729 | 10.56% | $256,800 |
| 29 | New York | 8,539,536 | 7,668,956 | 870,580 | 10.19% | $403,000 |
| 30 | Rhode Island | 484,615 | 436,902 | 47,713 | 9.85% | $368,800 |
| 31 | District of Columbia | 356,101 | 321,556 | 34,545 | 9.70% | $724,600 |
| 32 | Kansas | 1,285,221 | 1,160,715 | 124,506 | 9.69% | $203,400 |
| 33 | Texas | 11,890,808 | 10,747,240 | 1,143,568 | 9.62% | $260,400 |
| 34 | Nevada | 1,307,338 | 1,183,393 | 123,945 | 9.48% | $406,100 |
| 35 | Pennsylvania | 5,779,663 | 5,235,339 | 544,324 | 9.42% | $240,500 |
| 36 | Minnesota | 2,519,538 | 2,282,967 | 236,571 | 9.39% | $305,500 |
| 37 | Indiana | 2,953,344 | 2,681,537 | 271,807 | 9.20% | $201,600 |
| 38 | Virginia | 3,654,784 | 3,326,260 | 328,524 | 8.99% | $360,700 |
| 39 | Iowa | 1,427,175 | 1,303,763 | 123,412 | 8.65% | $195,900 |
| 40 | Colorado | 2,545,124 | 2,325,576 | 219,548 | 8.63% | $502,200 |
| 41 | Ohio | 5,271,573 | 4,829,571 | 442,002 | 8.38% | $199,200 |
| 41 | Massachusetts | 3,014,657 | 2,762,070 | 252,587 | 8.38% | $525,800 |
| 43 | Utah | 1,193,082 | 1,094,896 | 98,186 | 8.23% | $455,000 |
| 44 | Illinois | 5,443,501 | 5,001,904 | 441,597 | 8.11% | $250,500 |
| 45 | Maryland | 2,545,532 | 2,339,510 | 206,022 | 8.09% | $397,700 |
| 46 | Nebraska | 855,631 | 786,885 | 68,746 | 8.03% | $223,800 |
| 47 | New Jersey | 3,775,842 | 3,478,355 | 297,487 | 7.88% | $427,600 |
| 48 | California | 14,532,683 | 13,434,847 | 1,097,836 | 7.55% | $695,400 |
| 49 | Connecticut | 1,536,049 | 1,420,170 | 115,879 | 7.54% | $343,200 |
| 50 | Oregon | 1,838,631 | 1,701,548 | 137,083 | 7.46% | $454,200 |
| 51 | Washington | 3,262,667 | 3,020,558 | 242,109 | 7.42% | $519,800 |
Vacancy rates dip slightly from 2022 to 2023
Overall, the U.S. vacancy rate waned a bit between 2022 and 2023 (the latest years we analyzed) — falling 0.36 percentage points in that period.
Why?
Interest rates were certainly at play, according to Matt Schulz, LendingTree chief consumer finance analyst and author of “Ask Questions, Save Money, Make More: How to Take Control of Your Financial Life.”
“During 2022 and 2023, the Fed was extremely busy raising rates in an attempt to combat inflation,” he says. “Mortgage rates rose sharply during that time, and those increases meant people were much more likely to stay put in their current home than to shop around for somewhere else to live.”
National change in vacancy rate
| Vacancy rate, 2022 | Vacancy rate, 2023 | % point difference |
|---|---|---|
| 10.79% | 10.43% | -0.36 |
Of course, some states saw bigger dips than others, with Wyoming seeing the biggest percentage point decrease (0.89). It was followed by Alabama (0.85) and North Dakota and Montana (both 0.77).
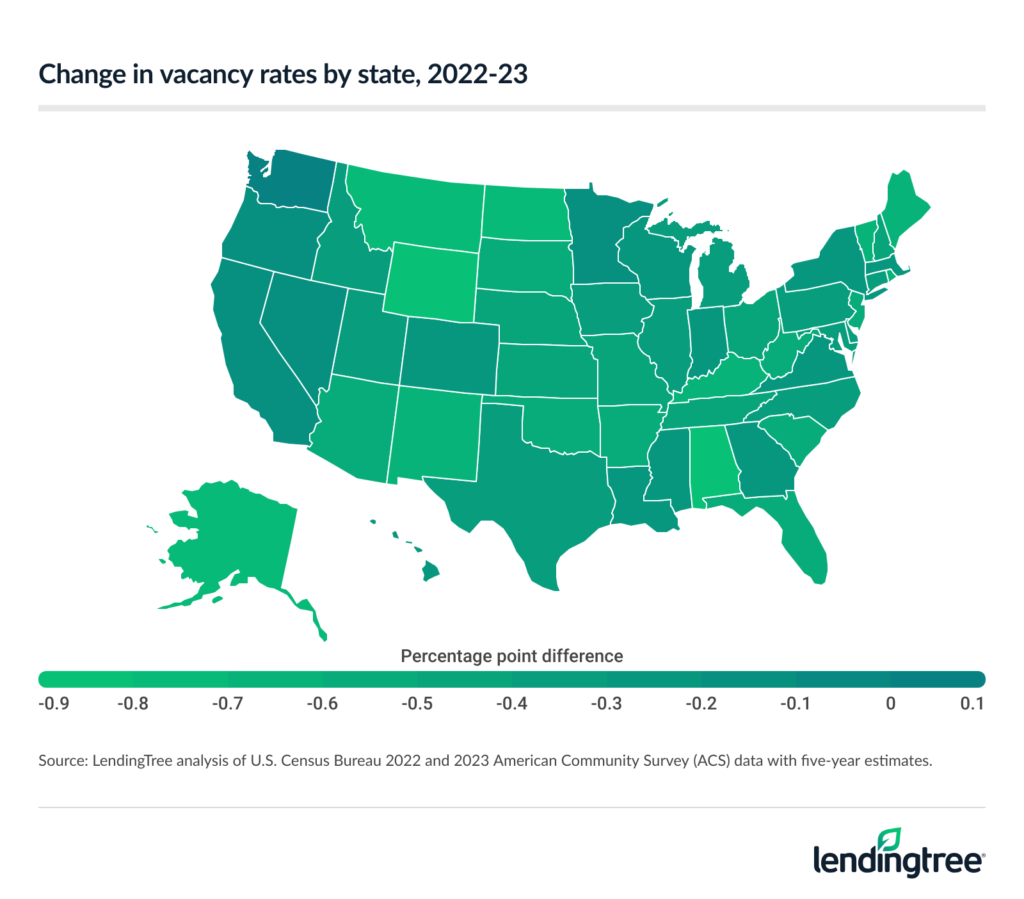
Only one state saw its vacancy rate increase — Washington, with a 0.05 increase. While it’s not entirely clear why the Evergreen State saw an increase when no other state did, it’s worth noting that Washington also had the lowest vacancy rate in the country, giving it lots of leeway for a small bump upward.
Full rankings
States with biggest increase/decreases in vacancy rates
| Rank | State | Vacancy rate, 2022 | Vacancy rate, 2023 | % point difference |
|---|---|---|---|---|
| 1 | Washington | 7.37% | 7.42% | 0.05 |
| 2 | Oregon | 7.58% | 7.46% | -0.12 |
| 3 | California | 7.69% | 7.55% | -0.13 |
| 4 | Minnesota | 9.54% | 9.39% | -0.15 |
| 5 | District of Columbia | 9.87% | 9.70% | -0.17 |
| 6 | Nevada | 9.68% | 9.48% | -0.20 |
| 7 | Wisconsin | 11.30% | 11.08% | -0.22 |
| 8 | Massachusetts | 8.61% | 8.38% | -0.23 |
| 9 | Georgia | 10.85% | 10.61% | -0.24 |
| 10 | Colorado | 8.88% | 8.63% | -0.26 |
| 11 | Virginia | 9.25% | 8.99% | -0.27 |
| 12 | Hawaii | 13.72% | 13.44% | -0.28 |
| 12 | Indiana | 9.49% | 9.20% | -0.28 |
| 12 | New York | 10.48% | 10.19% | -0.28 |
| 15 | Mississippi | 15.38% | 15.08% | -0.29 |
| 16 | Louisiana | 15.15% | 14.84% | -0.30 |
| 17 | Iowa | 8.96% | 8.65% | -0.31 |
| 17 | Michigan | 12.47% | 12.16% | -0.31 |
| 19 | Maryland | 8.41% | 8.09% | -0.32 |
| 19 | Pennsylvania | 9.74% | 9.42% | -0.32 |
| 21 | Idaho | 11.01% | 10.67% | -0.34 |
| 21 | Illinois | 8.45% | 8.11% | -0.34 |
| 21 | North Carolina | 13.39% | 13.05% | -0.34 |
| 24 | Utah | 8.59% | 8.23% | -0.36 |
| 25 | Delaware | 13.85% | 13.48% | -0.37 |
| 25 | Texas | 9.99% | 9.62% | -0.37 |
| 27 | Connecticut | 7.94% | 7.54% | -0.39 |
| 28 | Nebraska | 8.45% | 8.03% | -0.41 |
| 28 | Ohio | 8.79% | 8.38% | -0.41 |
| 30 | New Hampshire | 14.87% | 14.45% | -0.42 |
| 31 | Kansas | 10.16% | 9.69% | -0.47 |
| 32 | Missouri | 12.05% | 11.56% | -0.49 |
| 33 | Tennessee | 11.05% | 10.56% | -0.50 |
| 34 | Florida | 15.76% | 15.19% | -0.57 |
| 34 | South Carolina | 14.36% | 13.79% | -0.57 |
| 34 | South Dakota | 11.46% | 10.89% | -0.57 |
| 37 | Arizona | 11.58% | 11.00% | -0.58 |
| 37 | Oklahoma | 13.08% | 12.49% | -0.58 |
| 37 | West Virginia | 16.66% | 16.08% | -0.58 |
| 40 | Arkansas | 14.58% | 14.00% | -0.59 |
| 40 | New Jersey | 8.47% | 7.88% | -0.59 |
| 42 | Vermont | 20.67% | 20.06% | -0.62 |
| 43 | Kentucky | 11.51% | 10.88% | -0.63 |
| 44 | Rhode Island | 10.52% | 9.85% | -0.68 |
| 45 | Maine | 21.79% | 21.09% | -0.70 |
| 45 | New Mexico | 13.82% | 13.11% | -0.70 |
| 47 | Alaska | 18.95% | 18.24% | -0.71 |
| 48 | Montana | 14.21% | 13.43% | -0.77 |
| 48 | North Dakota | 14.06% | 13.28% | -0.77 |
| 50 | Alabama | 15.84% | 14.99% | -0.85 |
| 51 | Wyoming | 14.32% | 13.43% | -0.89 |
States with low vacancy rates have higher home values
Those looking for homes in states with low vacancy rates are likely looking at homes with higher values. In fact, across the top 10 states with the lowest vacancy rates (technically, it’s 11 states, as there was a tie for No. 10), median home values average $408,382. In contrast, median home values average $247,850 in the 10 states with the highest vacancy rates.
This is likely due in part to varying average incomes and populations between states.
“Bigger incomes likely mean a wider variety of options as to what exactly they can afford, even with housing prices that are higher than in other locations,” Schulz says. “Also, the states with the highest vacancy rates tend to be a little more sparsely populated, lacking the giant urban centers we see in many states at the other end of the list. That sparseness potentially means more land on which to build, which can potentially lead to oversupply and then more vacancies.”
There are some exceptions, however, such as New Hampshire ($367,200), Alaska ($333,300) and Florida ($325,000), which all have higher-than-median home values and high vacancy rates. This, again, is likely due to these three states having a large number of seasonal, recreational or occasional use properties classified as vacant.
5 things you should consider when shopping for a home
No matter the market or where you’re looking to buy, there are some things you should always consider when buying a home. Here are five essential tips to help you make the best decisions about what’s likely one of the biggest purchases of your life:
- Shop around for rates. Schulz says shopping around and comparing mortgage rates is one of the most important things you can do when you’re in the process of buying a home. “There can be a substantial difference in the terms you receive from one lender to the next, so if you don’t take the time to comparison shop, you can spend significantly more than you need to,” he says. “Even a small fraction of a percentage point higher on a mortgage rate can mean thousands of extra dollars paid over the life of the loan.”
- Stick to your budget. Crunch the numbers to determine what you can really afford before you begin shopping for a home. “It’s entirely possible that a bank will be willing to lend you far more than you can actually afford to handle,” Schulz says. “The truth is that just because someone is willing to give you a certain amount of money doesn’t mean that you should take it or that you can afford to pay it back. Borrowing more than you need or can handle is just a recipe for trouble.”
- Get the full price picture. The costs of owning a home don’t end once the mortgage closes. It’s expensive to be a homeowner, whether you’re talking about insurance and property taxes or basic management like unexpected repairs and regular lawn care. The list of expenses can seem endless and keep you from being able to work toward other financial goals. If you don’t take these things into account when shopping for a new home, your estimates of what you can afford may end up being highly inaccurate.
- Know thyself. Take inventory and get real with yourself — and any shopping partners — about what you want in a home. Are you OK with a fixer-upper, or would you prefer a new build? Are you planning on growing your family in the next few years, downsizing or maybe just staying the same? Do you want a big yard or a tiny one? How much of a commute are you willing to deal with? The list of considerations can feel endless, and everyone’s priorities will be different. But if you don’t take the time to think through these things, you’re more likely to end up in a house that isn’t quite the right fit for you.
- Ask questions. Even if you think it’s a dumb question, ask it anyway. “I can promise that you won’t be the first or last person to ask that question, and failing to ask can end up costing you real money further down the line,” Schulz says.
Borrowing more than you need or can handle is just a recipe for trouble.

Methodology
LendingTree researchers analyzed the U.S. Census Bureau 2023 American Community Survey (ACS) with five-year estimates.
The survey measures the overall vacancy rate in a state by dividing the number of vacant households by the total number of households. Occupied households include homes owned or rented by occupants who use the home as their primary residence, while vacant households are broken down into seven subcategories.
The U.S. Census Bureau defines these subcategories as follows:
- For rent: These are vacant units offered “for rent,” or vacant units that are offered for either sale or rent.
- Rented, not occupied: These are vacant units where a rental agreement has been reached but the future occupants haven’t moved in yet.
- For sale only: These are vacant units currently on the market.
- Sold, not occupied: Similar to “rented, not occupied,” this category covers homes that have sold but the new owner hasn’t moved in yet.
- For seasonal, recreational or occasional use: These include homes for seasonal use like beach cottages and hunting cabins or lodging for seasonal workers like herders and loggers. Timeshare condominiums are also included here.
- For migrant workers: These are homes for migrant workers to occupy while they’re employed in farm work during the crop season.
- Other vacant: This category captures vacant homes that don’t fall into any of the above.
We also analyzed the U.S. Census Bureau 2022 ACS with five-year estimates to compare vacancy rates between 2022 and 2023.
View mortgage loan offers from up to 5 lenders in minutes
Read more
Empty but Expensive: Vacancy Rates in America’s Most Expensive Towns Top 23% Updated August 16, 2022 Across the nation’s 50 most expensive towns, an average of 23.42% of homes are vacant….Read more
Share of Million-Dollar Homes Rising — Here Are the Metros Where They’re Most Prevalent Updated November 11, 2024 While $1 million houses aren’t common in most of the largest metros, they account for…Read more