New Homes Are 11% Smaller but 74% More Expensive per Square Foot


Newly built homes in the U.S. have gotten smaller in the past decade, while the average price per square foot for these homes has skyrocketed.
Here’s more on what we found in an analysis of Census Bureau data on new-home sizes and prices across the nation.
Key findings
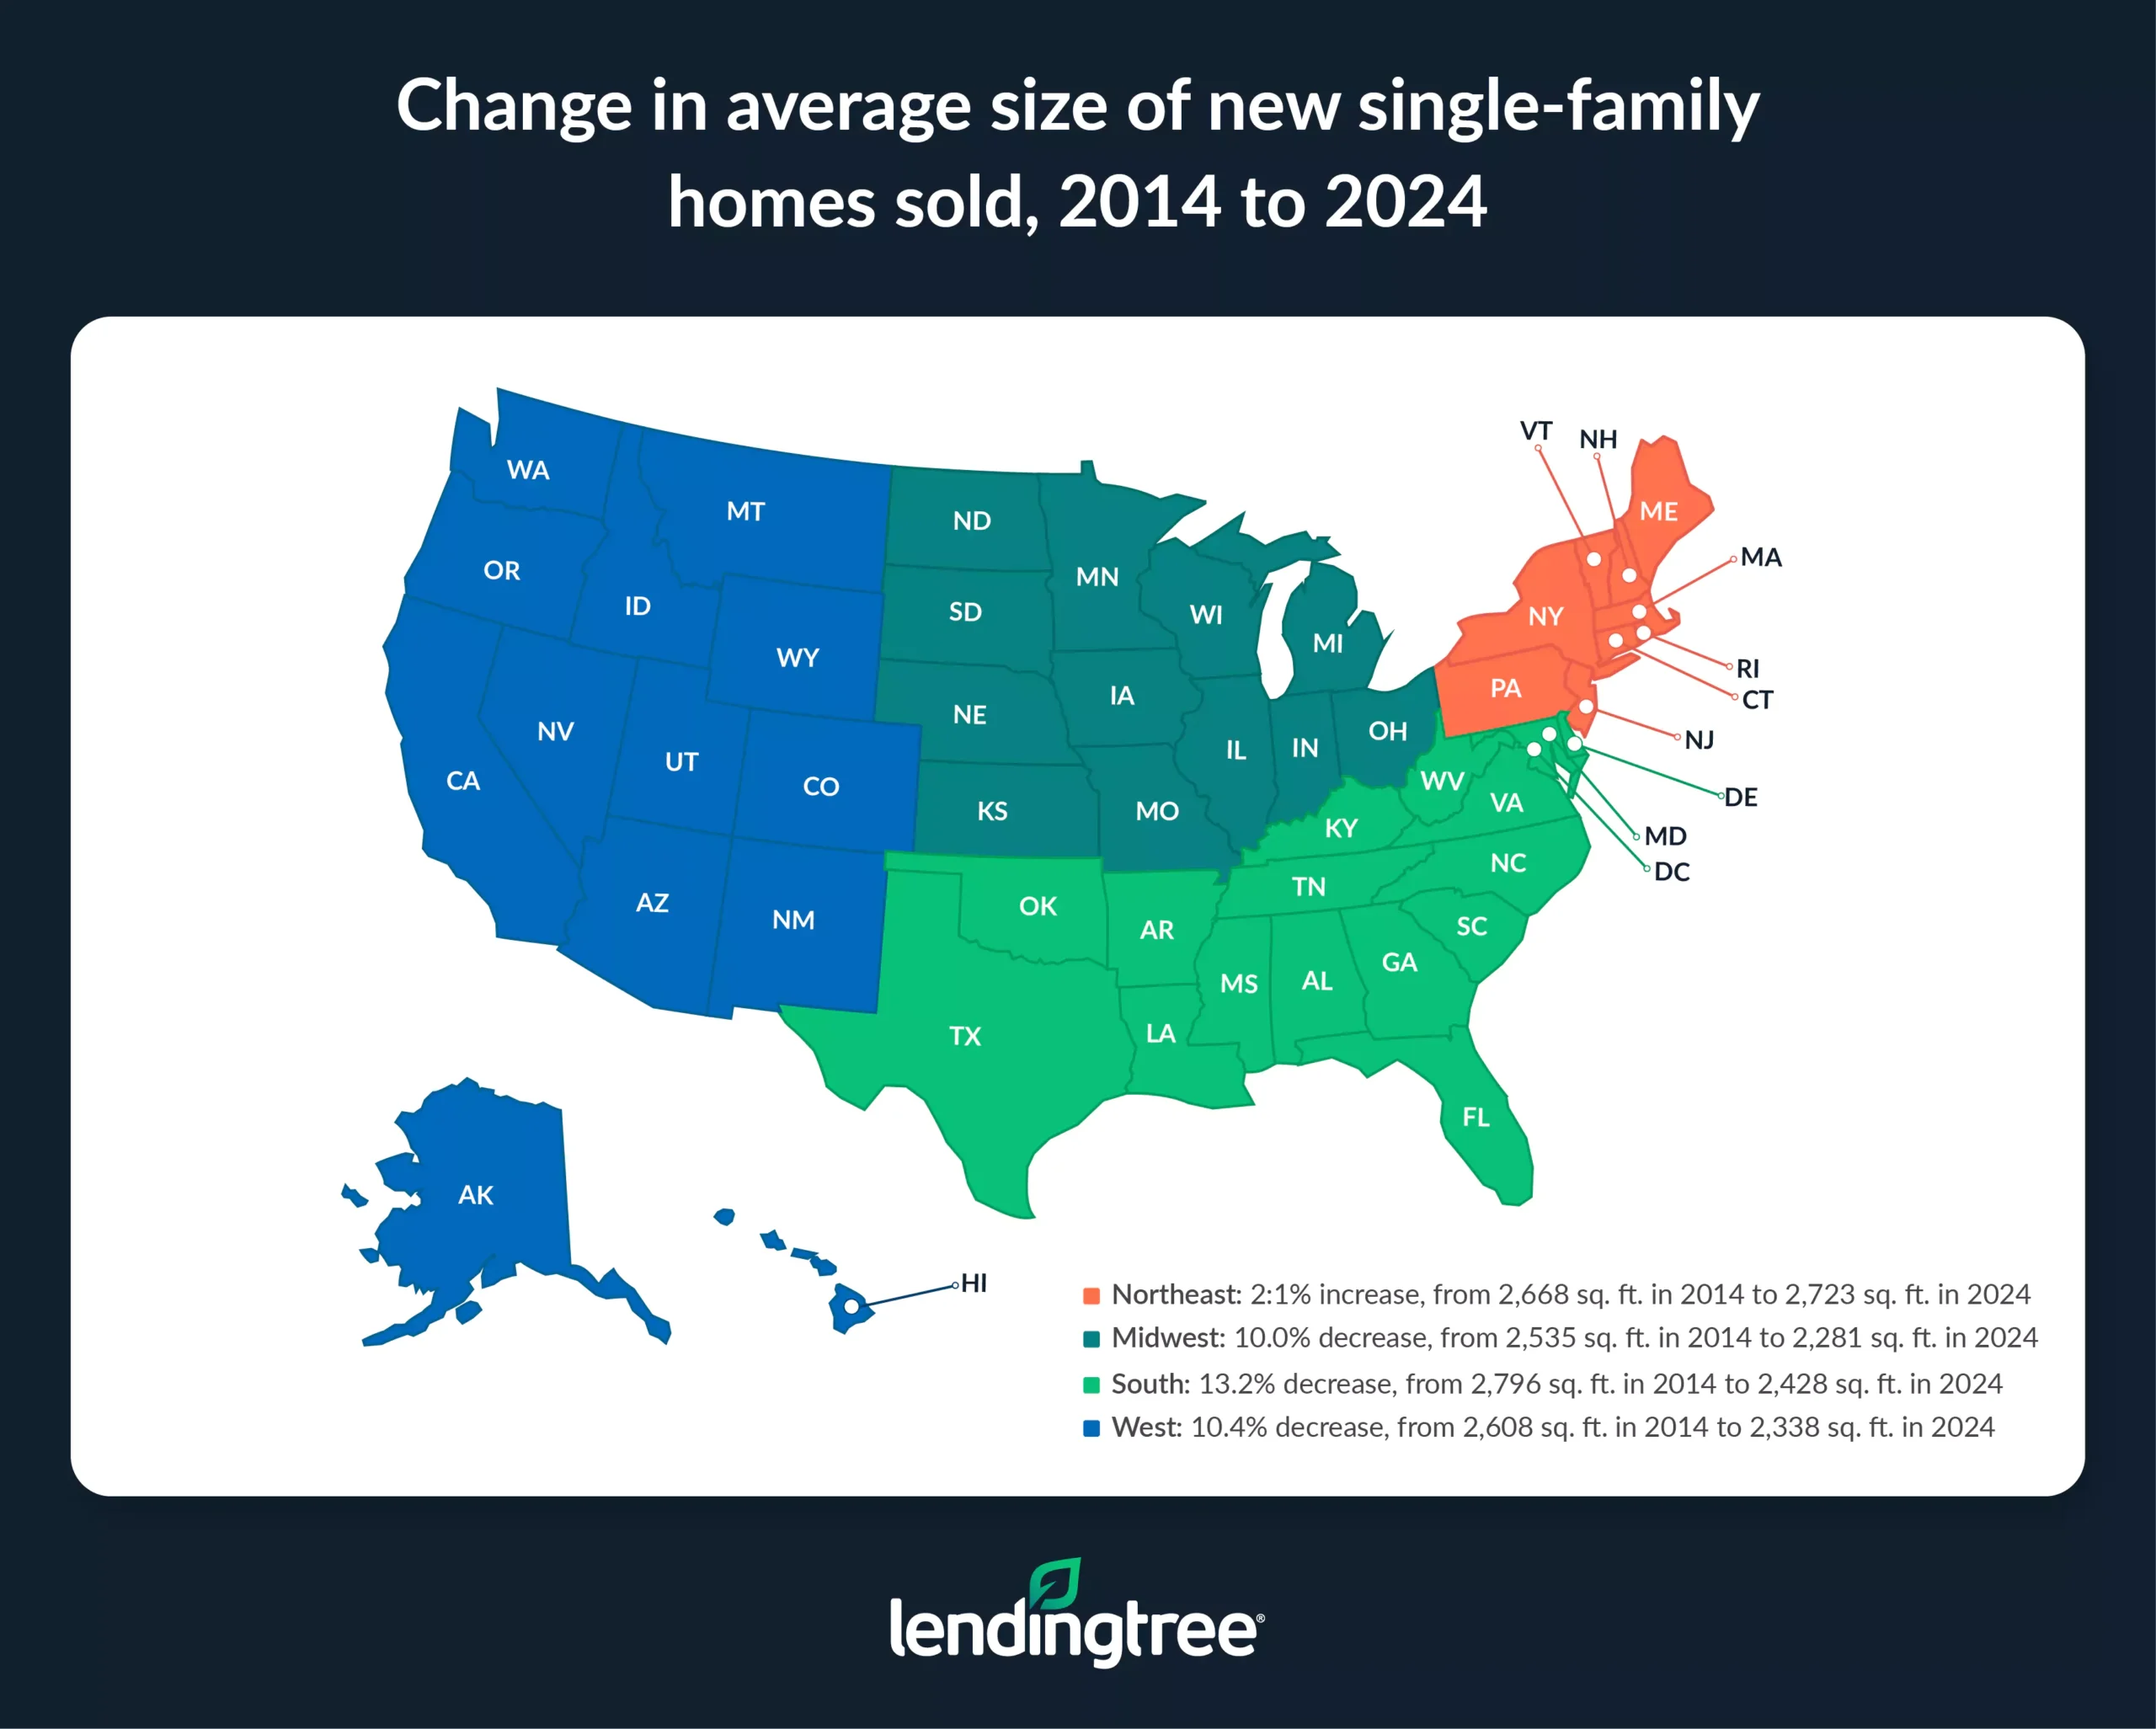
- New-home sizes have shrunk over the past decade, except in the Northeast. The average size of new single-family homes sold nationwide decreased by 11.2% from 2014 (2,707 square feet) to 2024 (2,404). The South experienced the steepest decline (13.2%), followed by the West (10.4%) and Midwest (10.0%). Only the Northeast saw a modest increase (2.1%).
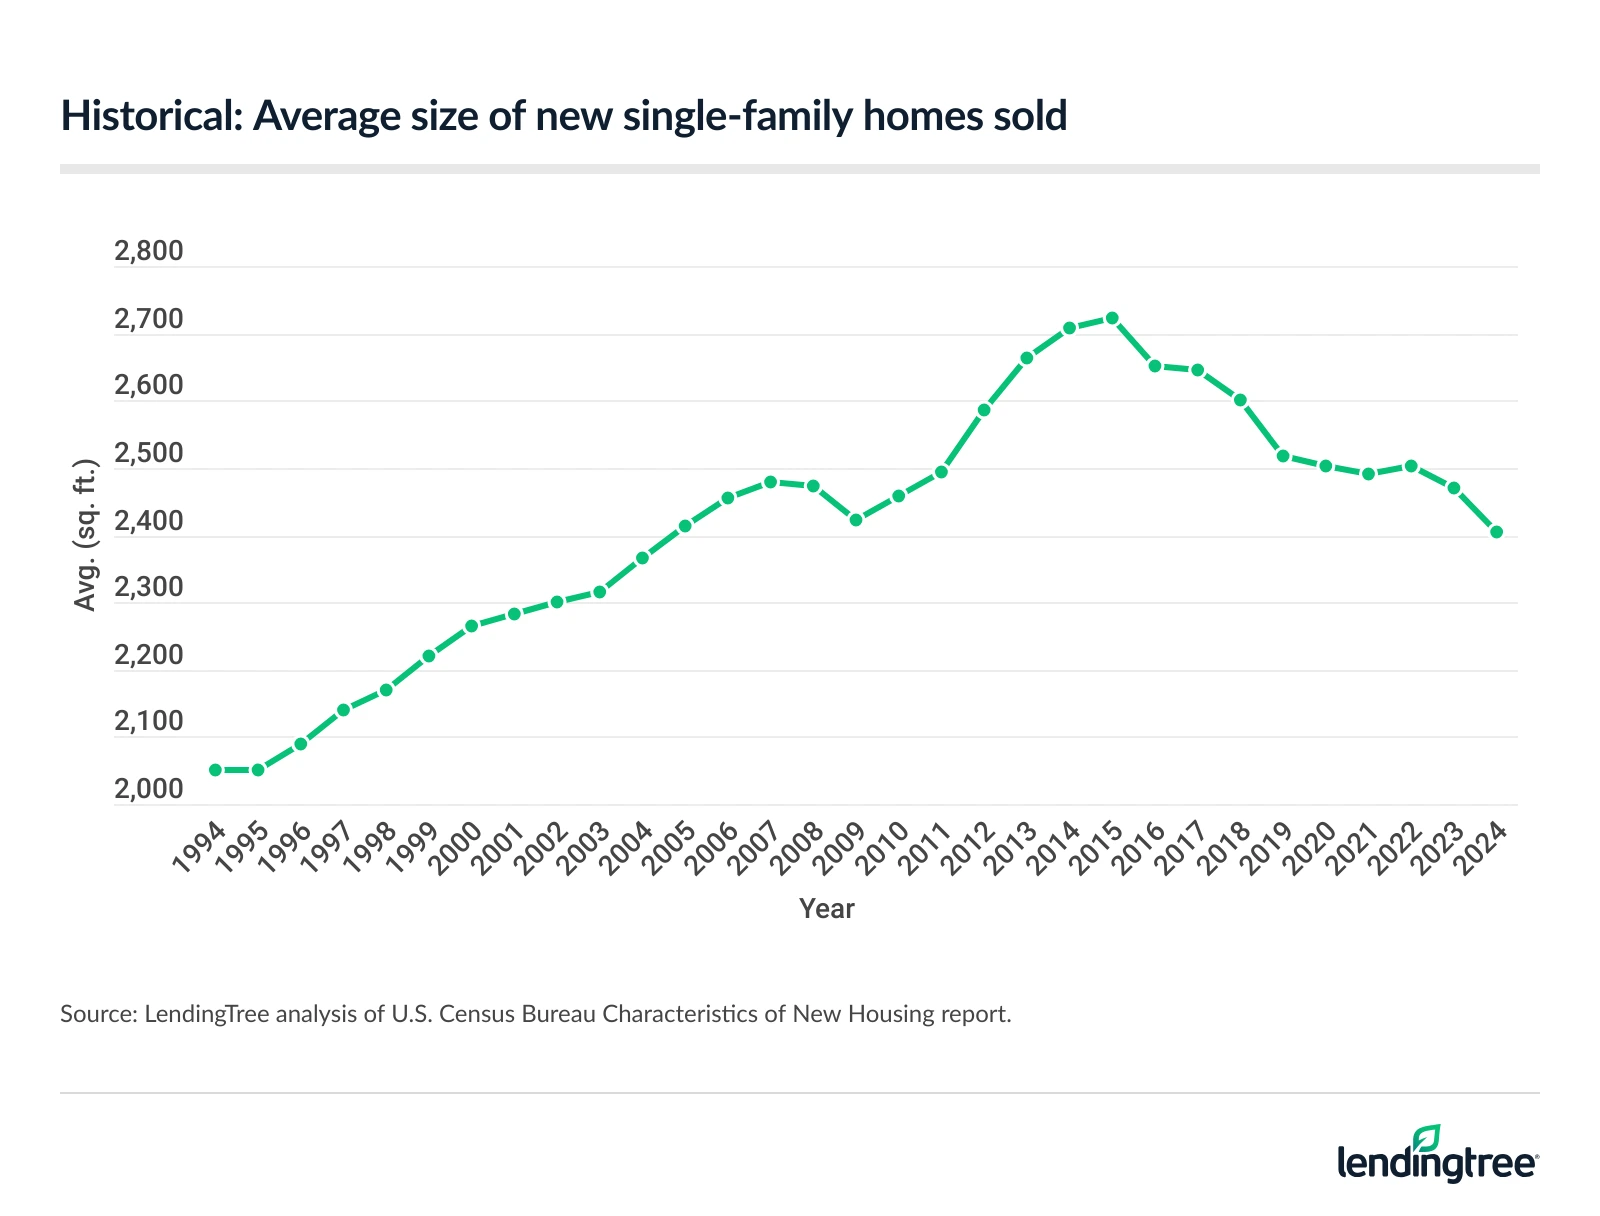
- New houses sold remain spacious by historical standards, despite recent declines. The average size of new single-family homes sold rose 17.3% from 1994 (2,050 square feet) to 2024 (2,404). Home sizes peaked in 2015 at 2,724 square feet. While there was a brief uptick in 2022, they declined in 2023 and 2024. Regionally, Northeast homes sold are the largest, averaging 2,723 square feet, while those in the Midwest are the smallest, averaging 2,281.
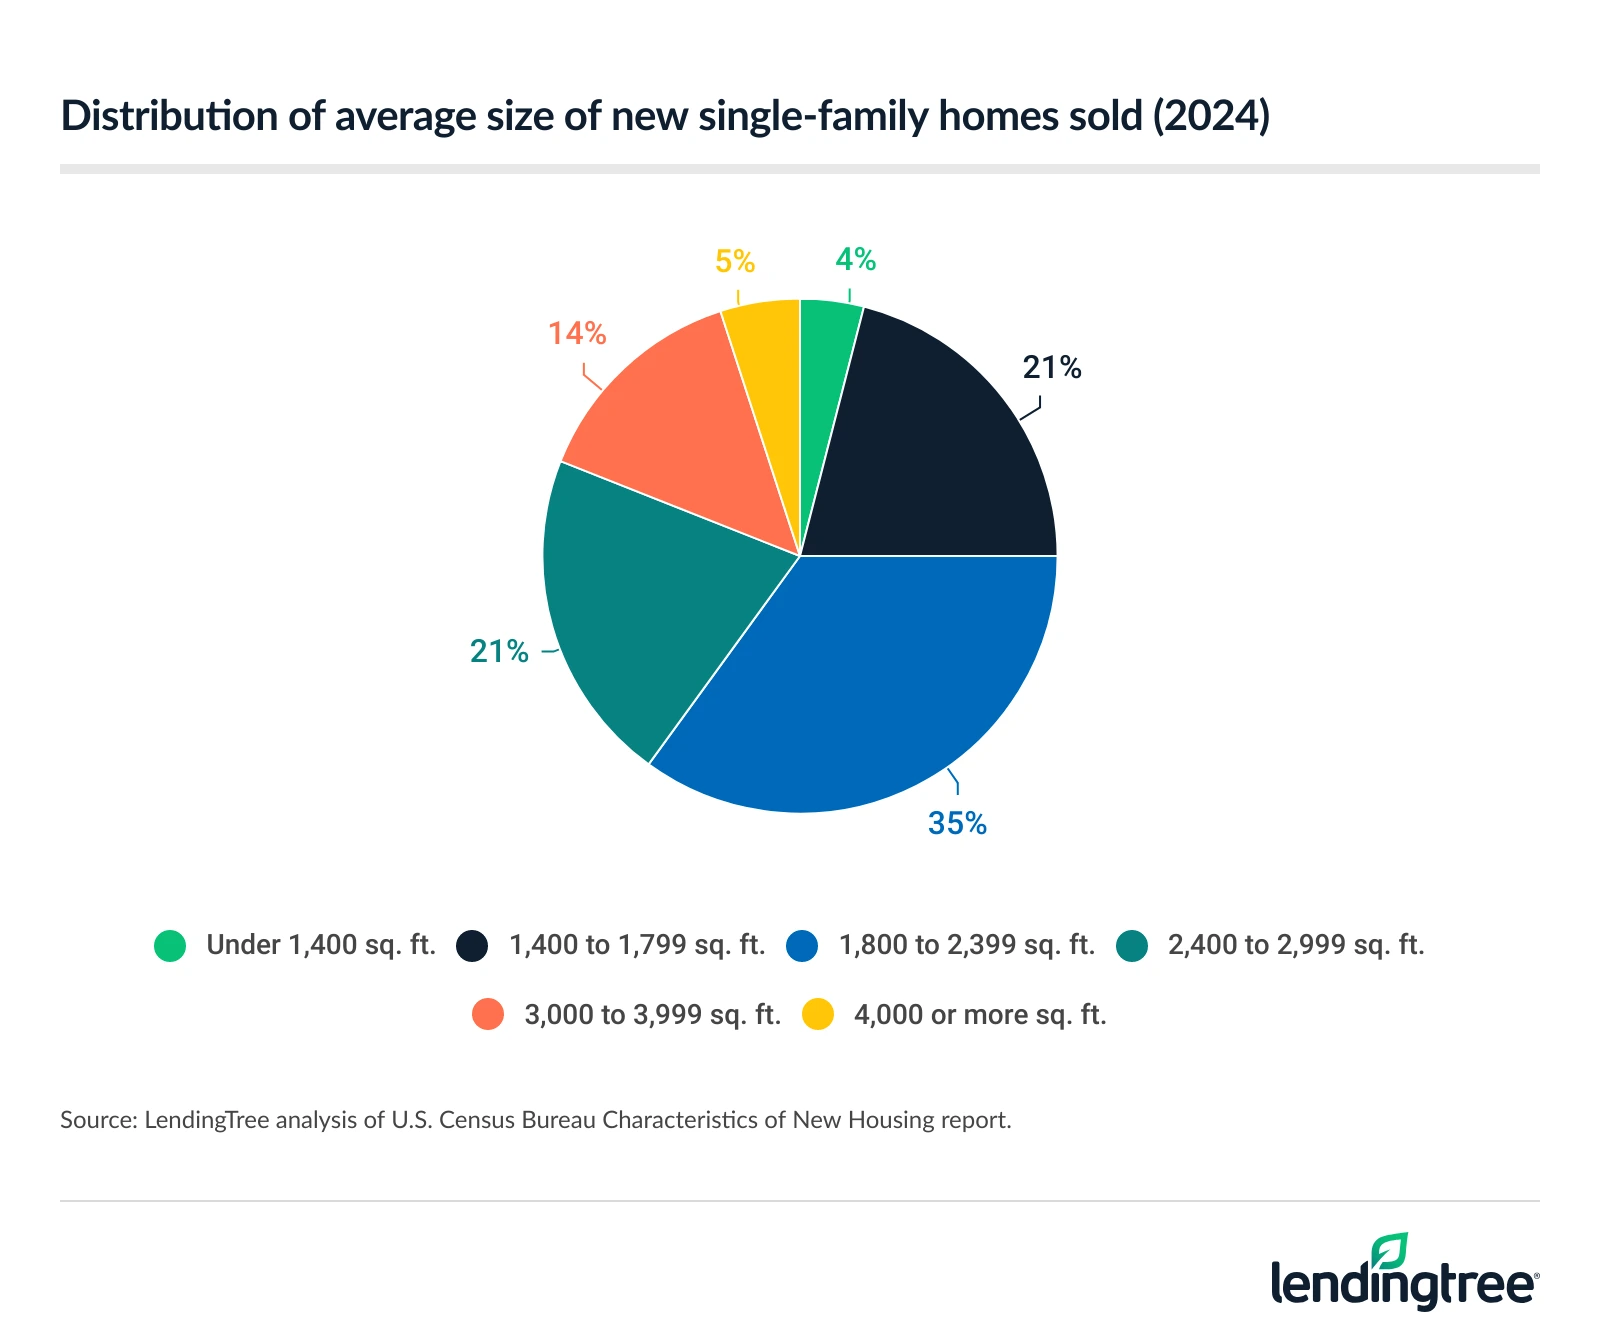
- Smaller homes are making a comeback, but not everywhere. In 2024, 1 in 4 new single-family homes sold were under 1,800 square feet, up significantly from 17% in 2014. Meanwhile, the share of large homes (3,000 square feet or more) dropped from 33% in 2014 to 19% in 2024. In the Midwest, 32% of new homes were under 1,800 square feet in 2024, compared with 14% in the Northeast. The South and West had 23% and 30%, respectively.
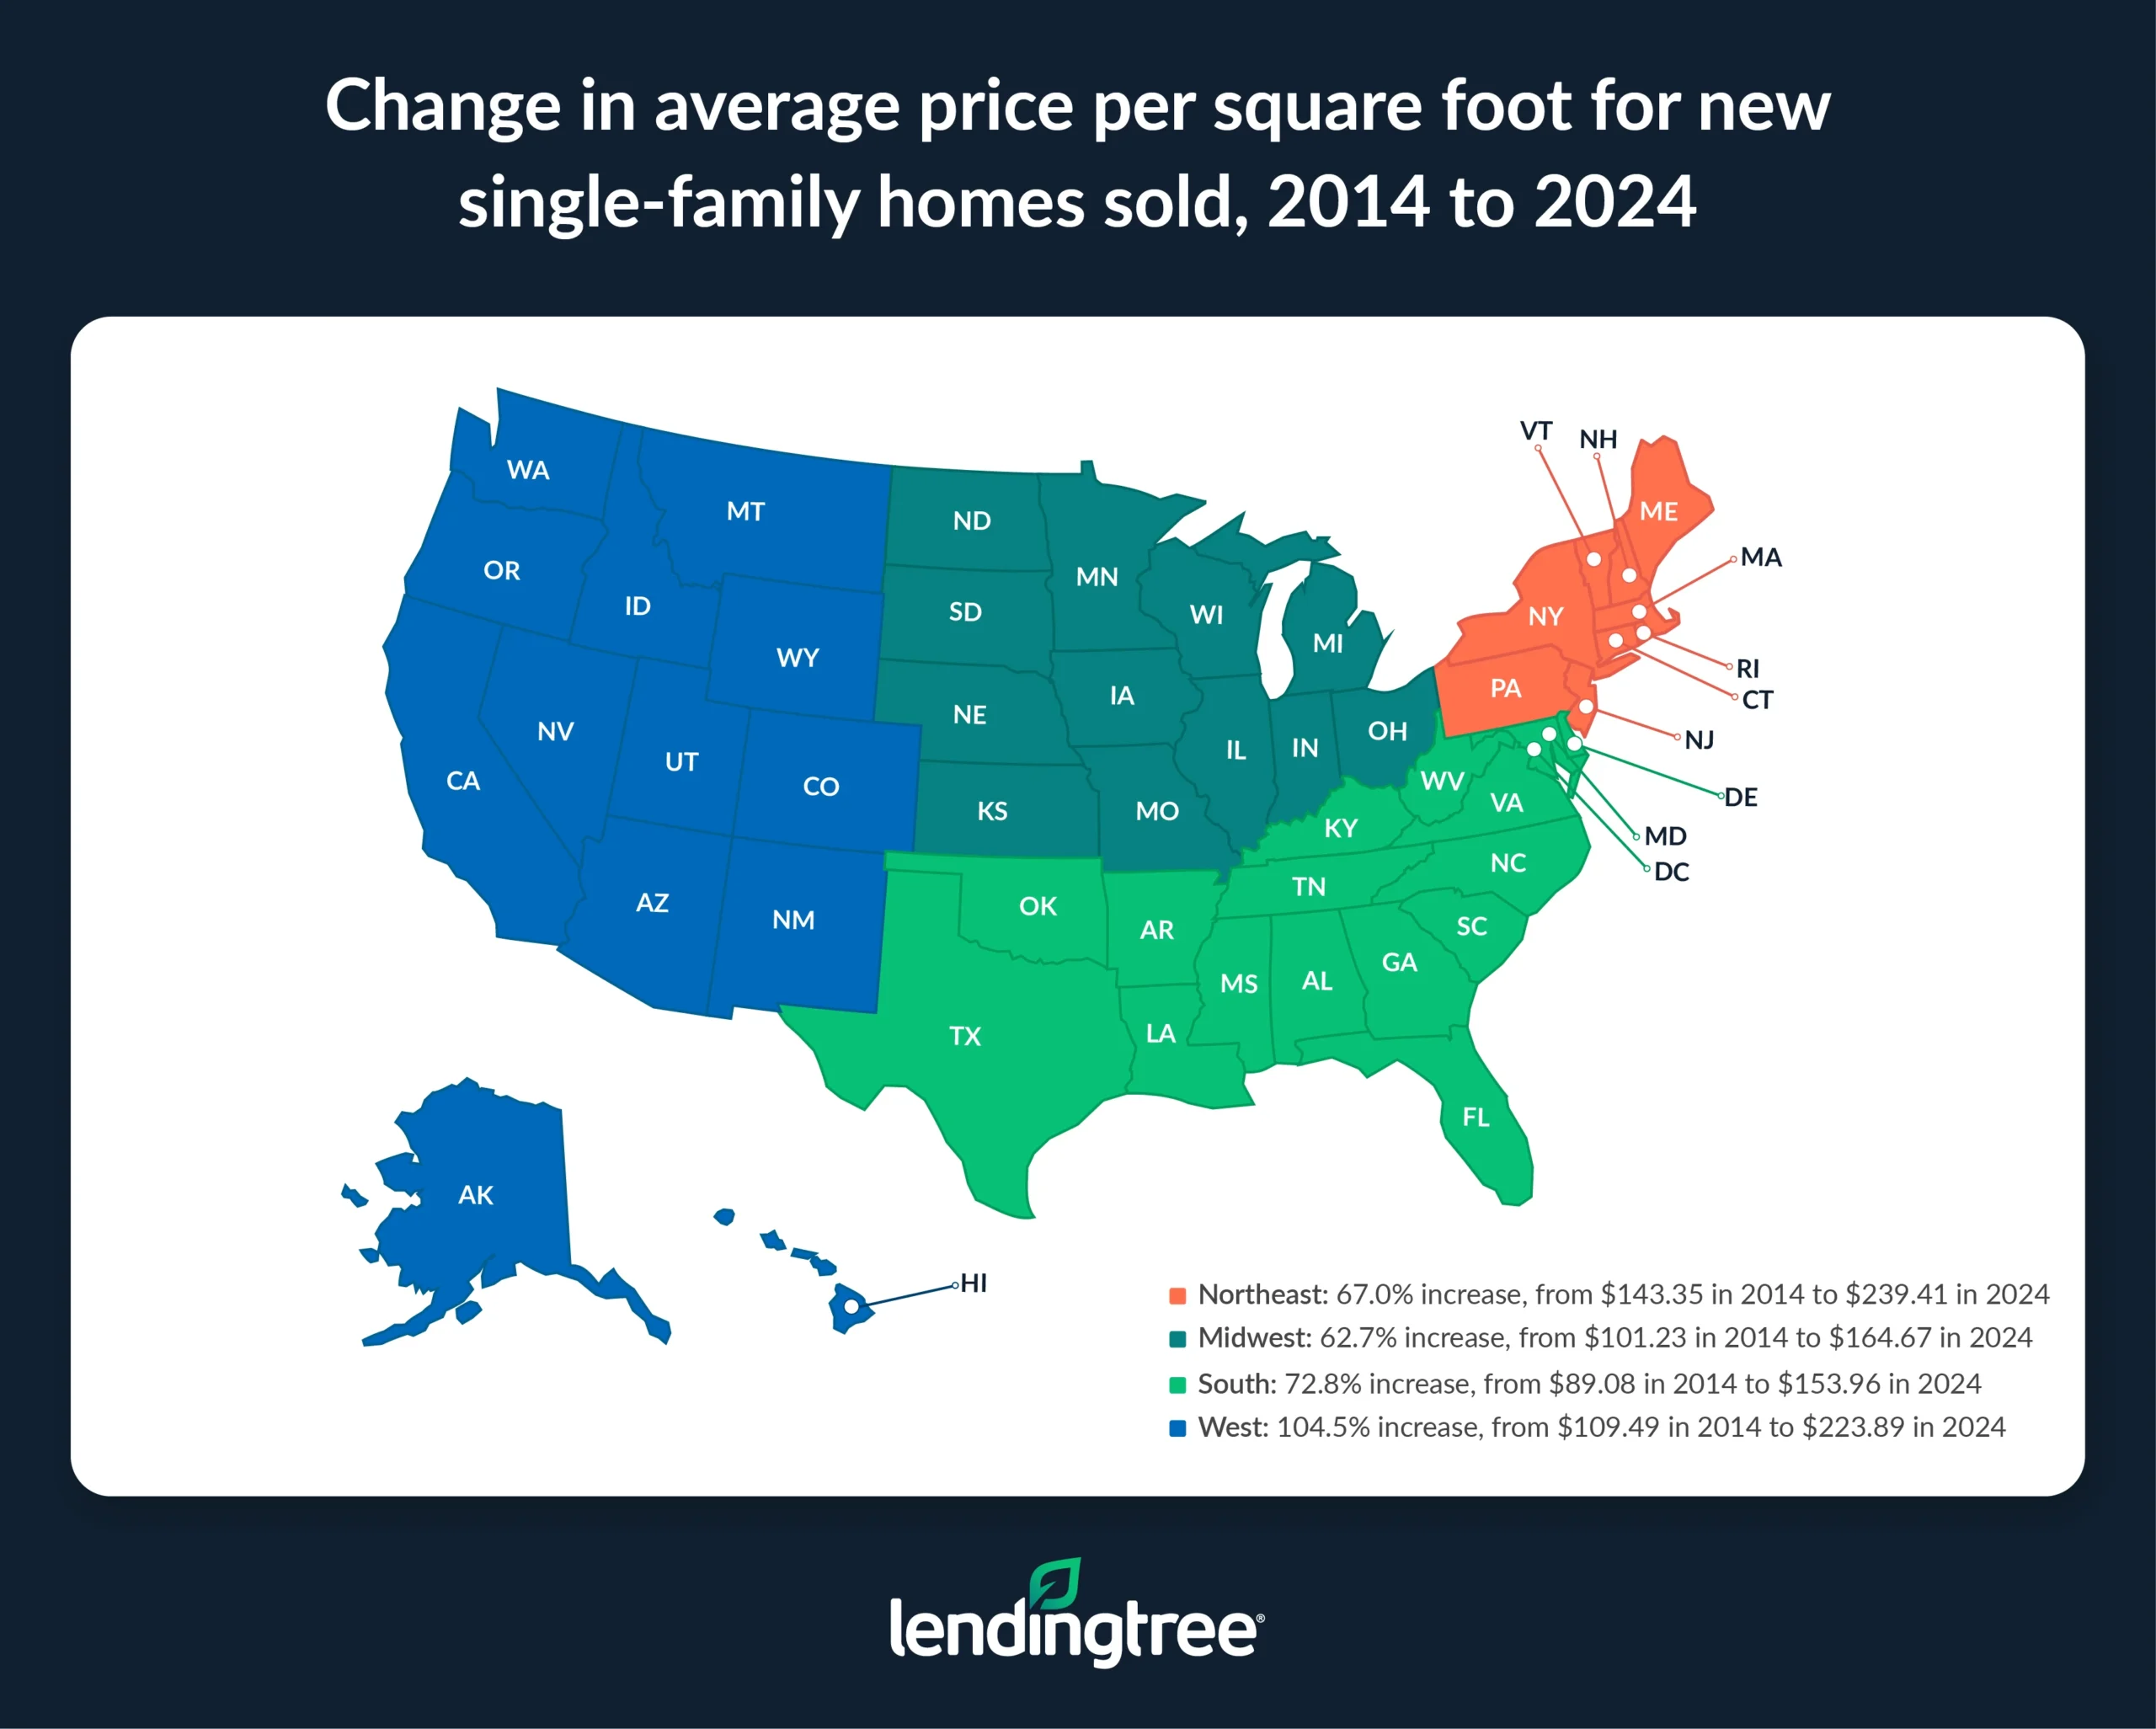
- The average price per square foot of a new house has surged over the past decade. From 2014 to 2024, the average price per square foot for new single-family homes sold in the U.S. rose by 73.6% from $97.25 to $168.86. The West saw the biggest jump (104.5%), followed by the South (72.8%), Northeast (67.0%) and Midwest (62.7%).
New-home sizes have shrunk over past decade, except in Northeast
The average new single-family home sold in the U.S. in 2024 was 2,404 square feet. That’s down 11.2% from 2014, when the average was 2,707.
We don’t have data breaking that down by state, but we can highlight averages regionally. Three of the four regions — the Midwest, South and West — saw double-digit decreases in average new-home size, while the size in the Northeast grew.
The decrease was biggest in the South, where new-home sizes fell by 13.2%.
Historical: Average size of new single-family homes sold
| Key details | U.S. | Northeast | Midwest | South | West |
|---|---|---|---|---|---|
| 2024 | 2,404 | 2,723 | 2,281 | 2,428 | 2,338 |
| 2014 | 2,707 | 2,668 | 2,535 | 2,796 | 2,608 |
| 2004 | 2,366 | 2,610 | 2,215 | 2,412 | 2,322 |
| 1994 | 2,050 | 2,210 | 1,950 | 2,110 | 1,960 |
| Change, 2014 to 2024 | -11.2% | 2.1% | -10.0% | -13.2% | -10.4% |
| Change, 2004 to 2024 | 1.6% | 4.3% | 3.0% | 0.7% | 0.7% |
| Change, 1994 to 2024 | 17.3% | 23.2% | 17.0% | 15.1% | 19.3% |
New houses sold remain spacious by historical standards, despite recent declines
The average size of a new home is 17.3% bigger than 30 years ago. In 1994, the average new single-family home sold was 2,050 square feet, compared with 2,404 in 2024.
Home sizes reached their peak in 2015 at 2,724 square feet — a massive 32.9% increase from 1994.
New-home square footage in 2024 was highest in the Northeast at 2,723. The smallest new homes were in the Midwest at 2,281.
Historical: Average size of new single-family homes sold
| Year | U.S. | Northeast | Midwest | South | West |
|---|---|---|---|---|---|
| 2024 | 2,404 | 2,723 | 2,281 | 2,428 | 2,338 |
| 2023 | 2,470 | 2,572 | 2,356 | 2,515 | 2,377 |
| 2022 | 2,503 | 2,705 | 2,353 | 2,543 | 2,420 |
| 2021 | 2,492 | 2,768 | 2,328 | 2,527 | 2,432 |
| 2020 | 2,502 | 2,679 | 2,408 | 2,544 | 2,420 |
| 2019 | 2,518 | 2,765 | 2,363 | 2,548 | 2,469 |
| 2018 | 2,602 | 2,831 | 2,478 | 2,649 | 2,512 |
| 2017 | 2,645 | 2,933 | 2,474 | 2,696 | 2,540 |
| 2016 | 2,650 | 2,684 | 2,520 | 2,704 | 2,581 |
| 2015 | 2,724 | 2,836 | 2,575 | 2,794 | 2,614 |
| 2014 | 2,707 | 2,668 | 2,535 | 2,796 | 2,608 |
| 2013 | 2,662 | 2,645 | 2,557 | 2,751 | 2,534 |
| 2012 | 2,585 | 2,552 | 2,446 | 2,697 | 2,438 |
| 2011 | 2,494 | 2,572 | 2,274 | 2,594 | 2,380 |
| 2010 | 2,457 | 2,635 | 2,235 | 2,553 | 2,303 |
| 2009 | 2,422 | 2,529 | 2,203 | 2,502 | 2,339 |
| 2008 | 2,473 | 2,753 | 2,267 | 2,517 | 2,422 |
| 2007 | 2,479 | 2,582 | 2,257 | 2,538 | 2,456 |
| 2006 | 2,456 | 2,571 | 2,261 | 2,503 | 2,449 |
| 2005 | 2,414 | 2,601 | 2,262 | 2,436 | 2,422 |
| 2004 | 2,366 | 2,610 | 2,215 | 2,412 | 2,322 |
| 2003 | 2,315 | 2,444 | 2,153 | 2,336 | 2,345 |
| 2002 | 2,301 | 2,487 | 2,132 | 2,324 | 2,333 |
| 2001 | 2,282 | 2,486 | 2,144 | 2,309 | 2,272 |
| 2000 | 2,265 | 2,469 | 2,148 | 2,287 | 2,245 |
| 1999 | 2,221 | 2,340 | 2,097 | 2,278 | 2,178 |
| 1998 | 2,170 | 2,310 | 2,070 | 2,210 | 2,120 |
| 1997 | 2,140 | 2,280 | 2,050 | 2,170 | 2,090 |
| 1996 | 2,090 | 2,290 | 1,970 | 2,140 | 2,020 |
| 1995 | 2,050 | 2,190 | 1,940 | 2,130 | 1,950 |
| 1994 | 2,050 | 2,210 | 1,950 | 2,110 | 1,960 |
Smaller homes making comeback, but not everywhere
In 2014, about 1 in 6 (17%) new single-family homes sold in the U.S. were under 1,800 square feet. A third (33%) were 3,000 square feet or more.
In the past decade, we’ve seen that shift dramatically. In 2024, 25% of new single-family homes sold were under 1,800 square feet, while just 19% were 3,000 square feet or larger.
Historical: Distribution of average size of new single-family homes sold
| Size | Distribution, 2024 | Distribution, 2014 | Distribution, 2004 |
|---|---|---|---|
| Under 1,400 | 4% | 4% | 10% |
| 1,400 to 1,799 | 21% | 13% | 21% |
| 1,800 to 2,399 | 35% | 28% | 29% |
| 2,400 to 2,999 | 21% | 22% | 19% |
| 3,000 to 3,999 | 14% | 23% | 15% |
| 4,000 or more | 5% | 10% | 6% |
The shift has been the most pronounced in the West. In 2014, 19% of new single-family homes in the West were under 1,800 square feet. In 2024, it was 30% — 11 points higher. That percentage grew by eight points in the South (from 15% to 23%) and five points in the Midwest (from 27% to 32%). It only declined in the Northeast, where 14% of new single-family homes were under 1,800 square feet in 2024, compared with 16% in 2014.
Average price per square foot of new house has surged
While the size of new homes has shrunk in the past 10 years, the cost per square foot hasn’t. Among new homes sold in the past decade, the average price per square foot has ballooned a staggering 73.6% from $97.25 to $168.86.
In the West, the average price per square foot more than doubled, growing 104.5% from $109.49 in 2014 to $223.89 in 2024. That’s by far the largest increase, but that doesn’t mean other regions didn’t see enormous growth as well. Per-square-foot prices rose 72.8% in the South, 67.0% in the Northeast and 62.7% in the Midwest.
Not surprisingly, the further back you look, the greater the growth. The average price per square foot for new single-family homes has risen 98.4% over the past 20 years, from $85.13 in 2004 to $168.86 in 2024. Over 30 years, since 1994, the rise is 180.5%.
Average price per square foot of new single-family homes sold
| Key details | U.S. | Northeast | Midwest | South | West |
|---|---|---|---|---|---|
| 2024 | $168.86 | $239.41 | $164.67 | $153.96 | $223.89 |
| 2014 | $97.25 | $143.35 | $101.23 | $89.08 | $109.49 |
| 2004 | $85.13 | $106.92 | $86.82 | $72.50 | $102.26 |
| 1994 | $60.21 | $67.84 | $63.91 | $53.16 | $67.08 |
| Change, 2014 to 2024 | 73.6% | 67.0% | 62.7% | 72.8% | 104.5% |
| Change, 2004 to 2024 | 98.4% | 123.9% | 89.7% | 112.4% | 118.9% |
| Change, 1994 to 2024 | 180.5% | 252.9% | 157.7% | 189.6% | 233.8% |
To combat rising prices, control what you can control
Smaller homes and higher prices are just a few of the reasons why homeownership feels like a pipe dream for many Americans. Stubbornly high interest rates don’t help either.
Here are a few tips to help you keep your costs down when shopping for a new home.
- Shop around for your best mortgage rates. It’s old advice, but it’s among the best. Comparison shopping works, and it can be especially impactful with mortgages. Even a fraction of a percentage point decrease in a mortgage rate can mean tens of thousands of dollars saved over the life of that loan.
- Remember that new doesn’t always mean better. A newly built home can be appealing, but that doesn’t mean you shouldn’t consider an existing home. One big reason: Existing homes typically cost less than new homes. That isn’t always the case, but it often is — and that matters.
- Be flexible with location. Our report clearly shows there can be huge differences in house prices in different parts of the country. However, you don’t have to move across the country to find lower prices. Housing costs can vary dramatically within the same city or ZIP code. Of course, price isn’t the only location consideration — commute time, school systems and other factors can be equally or more important. But you’re doing yourself and your family a disservice if you don’t at least consider it.
- Consider different types of mortgages. A 30-year fixed-rate mortgage is the most common type of mortgage, but it’s far from the only one. A 15-year fixed-rate mortgage can bring you a lower interest rate, though it typically comes with a higher monthly payment. An adjustable-rate mortgage can also provide a lower rate, but it doesn’t last forever, which can be a problem down the road if you’re planning to stay in the house for the long haul. Federal Housing Administration (FHA), Veterans Affairs (VA) and U.S. Department of Agriculture (USDA) loans can be viable alternatives for those who qualify.
Methodology
LendingTree researchers analyzed the latest U.S. Census Bureau Characteristics of New Housing report, released in June 2025, which contains data for 2024 and earlier.
This analysis includes:
- The average square footage of new single-family homes sold
- The share of homes sold by square footage category (e.g., under 1,400 square feet), calculated as a percentage of total new homes sold
- The average price per square foot of floor area in new single-family houses sold
Findings are presented nationally and by region (Northeast, Midwest, South and West).
The states in each region are as follows:
- Northeast: Connecticut, Maine, Massachusetts, New Hampshire, New Jersey, New York, Pennsylvania, Rhode Island and Vermont.
- Midwest: Illinois, Indiana, Iowa, Kansas, Michigan, Minnesota, Missouri, Nebraska, North Dakota, Ohio, South Dakota and Wisconsin.
- South: Alabama, Arkansas, Delaware, District of Columbia, Florida, Georgia, Kentucky, Louisiana, Maryland, Mississippi, North Carolina, Oklahoma, South Carolina, Tennessee, Texas, Virginia and West Virginia.
- West: Alaska, Arizona, California, Colorado, Hawaii, Idaho, Montana, Nevada, New Mexico, Oregon, Utah, Washington and Wyoming.
View mortgage loan offers from up to 5 lenders in minutes