Average Age of Used Cars Sought Across US is 5.5


By now, everyone has heard about the significant value a new car can lose when driven off the lot, which is perhaps one reason many have turned to buying used cars. (It probably doesn’t help that the average new-car sticker price is above $49,000, according to Kelley Blue Book.)
A LendingTree analysis reveals that Americans shopping for used cars typically look for vehicles between 4.8 and 6.4 years old on average, although specifics vary by state and metro. Below, find the full breakdown, as well as the implications of the used-car-buying trend on car insurance prices and more.
- Western and Midwest shoppers look for the oldest used cars. Idaho ranks first, with its residents seeking used cars that are an average of 6.4 years old. South Dakota follows at 6.3, with Wyoming, Iowa and Montana all at 6.2.
- Northeast and Southern shoppers seek the youngest used vehicles. Shoppers in four states — New Jersey, Florida, New York and the District of Columbia — seek the youngest used cars, at an average age of 4.8.
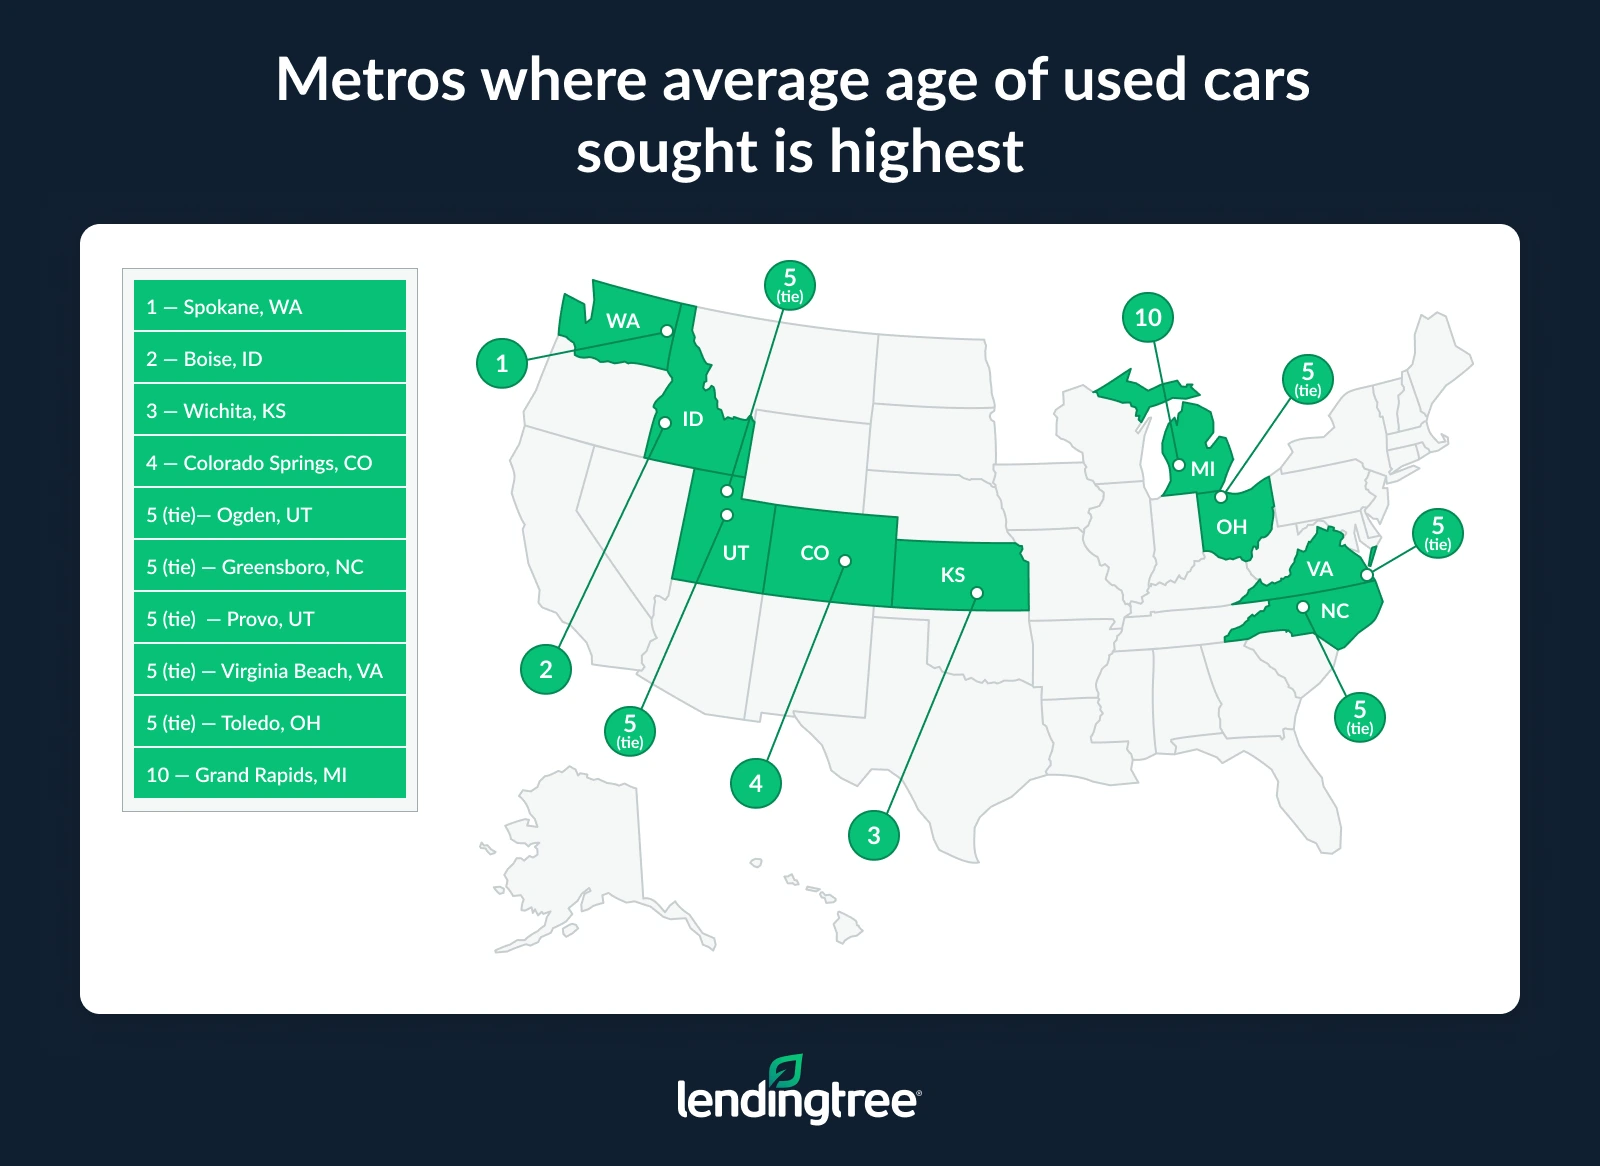
- Just four metros seek used cars that are more than 6 years old. Spokane, Wash., leads at 6.7, ahead of Boise, Idaho (6.3), Wichita, Kan. (6.2), and Colorado Springs, Colo. (6.1).
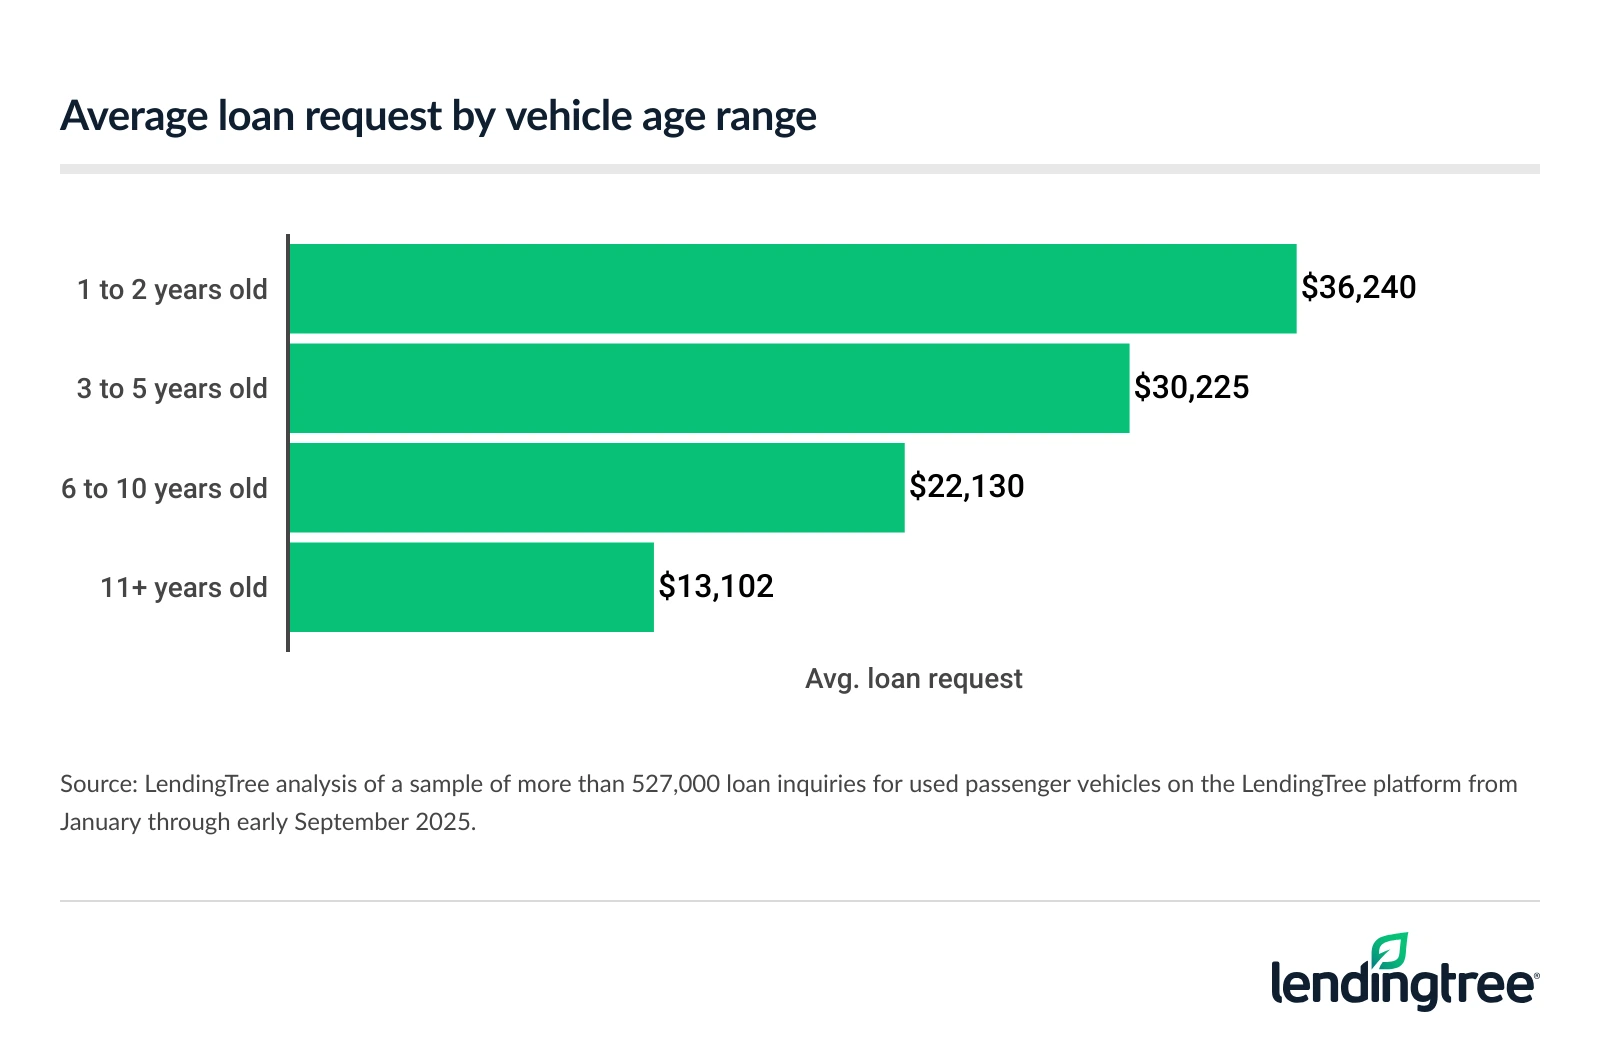
- Loan amounts decline sharply as vehicles get older. Consumers request an average of $36,240 to finance cars that are 1 to 2 years old, versus $13,102 for models that are more than a decade old. Meanwhile, average insurance costs for a Honda Civic LX decrease with age, from $2,999 annually for a 2024 model to $2,131 for a 2009 model.
- Luxury brands have the largest differences in average loan request amounts between newer and older models. Land Rover leads, with 2024 model shoppers seeking $52,259 more for those models ($67,955) than for 2014 models ($15,697). Porsche, Mercedes-Benz and Cadillac follow with differences above $40,000.
Western, Midwest shoppers look for oldest used cars
While the average age of used vehicles sought across the 50 states and the District of Columbia is 5.5, some shoppers are willing to buy older models than others. Specifically, Western and Midwestern residents tend to go for cars with more years on them. Idaho leads the pack, with used cars sought averaging 6.4 years old.
South Dakota is second at 6.3, while there’s a three-way tie at 6.2 among Wyoming, Iowa and Montana.
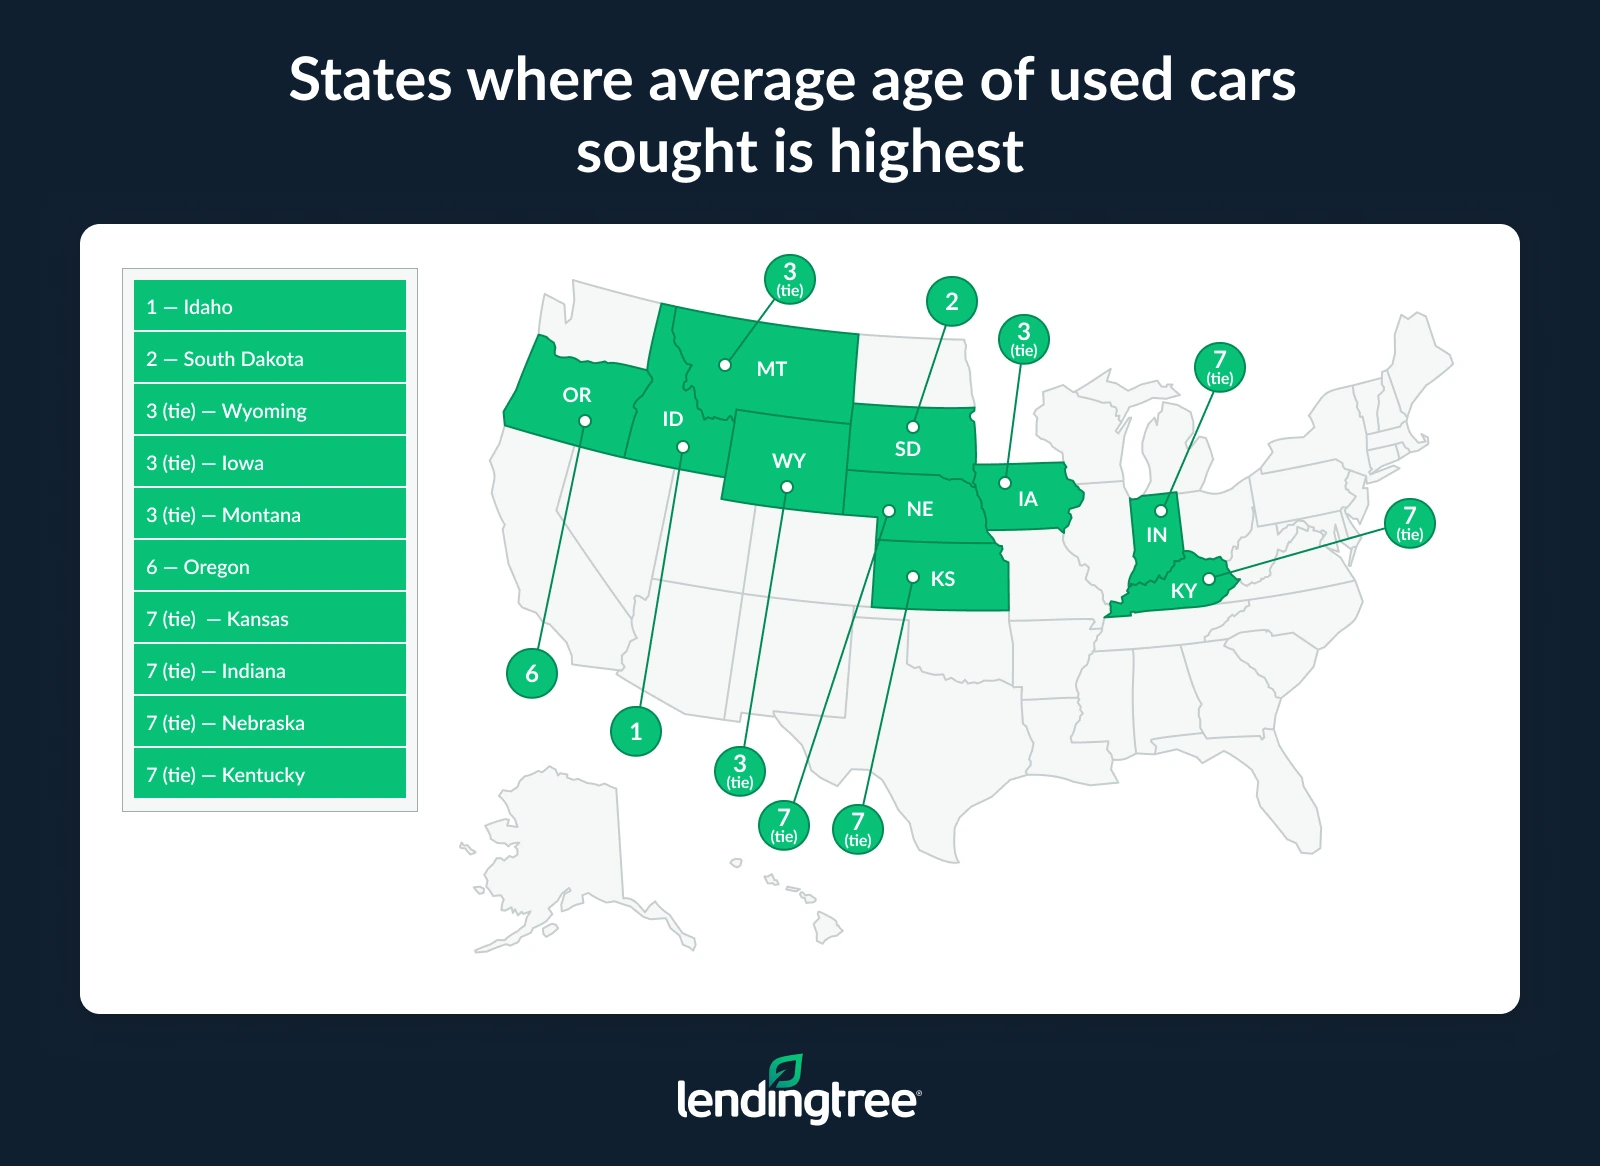
Nearly every state among the 10 that seek the oldest used cars is in the West or Midwest, with Kentucky in the South the only exception. Many of these states have lower-than-average median household incomes, which may encourage locals to shop for older, more affordable models.
Meanwhile, states that prefer the youngest used vehicles tend to be clustered in the Northeast and South. There’s a four-way tie among New Jersey, Florida, New York and the District of Columbia, where the average age of used cars sought is 4.8. That’s below Texas and Massachusetts (4.9) and Rhode Island, California and New Hampshire (5.0). (Maryland finishes the 10 youngest at 5.1.)
Many of these states are home to large metros — Miami, New York and Boston, for example — where some residents may have higher incomes and a desire to drive a more showy vehicle. (Keep in mind, too, that car insurance rates vary by state.)
Full rankings: Avg. age of used cars sought (by state)
| Rank | State | Avg. |
|---|---|---|
| 1 | Idaho | 6.4 |
| 2 | South Dakota | 6.3 |
| 3 | Wyoming | 6.2 |
| 3 | Iowa | 6.2 |
| 3 | Montana | 6.2 |
| 6 | Oregon | 6.1 |
| 7 | Kansas | 6.0 |
| 7 | Indiana | 6.0 |
| 7 | Nebraska | 6.0 |
| 7 | Kentucky | 6.0 |
| 11 | Missouri | 5.9 |
| 12 | North Dakota | 5.8 |
| 12 | Utah | 5.8 |
| 12 | Washington | 5.8 |
| 12 | Alaska | 5.8 |
| 12 | Michigan | 5.8 |
| 17 | Oklahoma | 5.7 |
| 17 | Tennessee | 5.7 |
| 17 | Wisconsin | 5.7 |
| 17 | Alabama | 5.7 |
| 21 | Virginia | 5.6 |
| 21 | Arkansas | 5.6 |
| 21 | Ohio | 5.6 |
| 21 | Colorado | 5.6 |
| 21 | Minnesota | 5.6 |
| 21 | Mississippi | 5.6 |
| 21 | North Carolina | 5.6 |
| 28 | South Carolina | 5.5 |
| 28 | Pennsylvania | 5.5 |
| 28 | West Virginia | 5.5 |
| 31 | Maine | 5.4 |
| 31 | New Mexico | 5.4 |
| 31 | Arizona | 5.4 |
| 34 | Hawaii | 5.3 |
| 34 | Illinois | 5.3 |
| 34 | Georgia | 5.3 |
| 34 | Nevada | 5.3 |
| 34 | Vermont | 5.3 |
| 34 | Louisiana | 5.3 |
| 40 | Connecticut | 5.2 |
| 40 | Delaware | 5.2 |
| 42 | Maryland | 5.1 |
| 43 | New Hampshire | 5.0 |
| 43 | California | 5.0 |
| 43 | Rhode Island | 5.0 |
| 46 | Massachusetts | 4.9 |
| 46 | Texas | 4.9 |
| 48 | District of Columbia | 4.8 |
| 48 | New York | 4.8 |
| 48 | Florida | 4.8 |
| 48 | New Jersey | 4.8 |
While older cars often tend to be less expensive than newer vehicles, insuring them isn’t always cheaper, LendingTree auto insurance expert and former auto insurance agent Lindsay Bishop says. “While it may cost an insurance company less to fully replace your car if it’s totaled in a wreck,” she explains, “the cost to repair it after a fender bender doesn’t necessarily go down with age. In fact, older cars may cost more to fix because parts may become harder to find.”
Plus, “Older cars may have fewer safety features,” she warns. “That means it’s more likely you and your passengers could get injured in an accident.” Along with the obvious downside of potentially getting seriously hurt, this can also increase the price of insurance, as medical bills are costly.
In one metro, shoppers look at used cars averaging 6.7 years old
Along with state-by-state data, our analysis also examined the 100 largest metros by population. Here, too, not all shopping habits are created equally: Residents of Spokane, Wash., were most willing to go old, seeking used cars with an average age of 6.7.
There were only three other metros where shoppers were willing to consider cars more than 6 years old on average: Boise, Idaho (6.3), Wichita, Kan. (6.2), and Colorado Springs, Colo. (6.1). After that, it’s a five-way tie at 6.0: Ogden, Utah; Greensboro, N.C.; Provo, Utah; Virginia Beach, Va.; and Toledo, Ohio.
Generally, carrying full auto insurance coverage — which includes comprehensive and collision along with state-required liability — is considered a smart financial move that can cover your assets in the event of an unexpected accident. But according to Bishop, some of these buyers may soon find themselves in a situation where it might not be cost-effective to fully cover their cars.
“Full coverage typically isn’t a good deal if your car is more than 8 years old,” she explains — when it might be more expensive than it would be to simply replace the vehicle out-of-pocket if something happened.
“However,” she goes on, “it’s more important to consider the car’s value than its age. For example, full coverage may still make sense if you own an older luxury vehicle, as it could still be quite expensive to replace. In general, you should consider dropping full coverage insurance if your car is worth less than $5,000.”
Full rankings: Avg. age of used cars sought (by metro)
| Rank | Metro | Avg. |
|---|---|---|
| 1 | Spokane, WA | 6.7 |
| 2 | Boise, ID | 6.3 |
| 3 | Wichita, KS | 6.2 |
| 4 | Colorado Springs, CO | 6.1 |
| 5 | Ogden, UT | 6.0 |
| 5 | Greensboro, NC | 6.0 |
| 5 | Provo, UT | 6.0 |
| 5 | Virginia Beach, VA | 6.0 |
| 5 | Toledo, OH | 6.0 |
| 10 | Grand Rapids, MI | 5.9 |
| 11 | Tucson, AZ | 5.8 |
| 11 | Chattanooga, TN | 5.8 |
| 11 | Indianapolis, IN | 5.8 |
| 11 | Tulsa, OK | 5.8 |
| 11 | Knoxville, TN | 5.8 |
| 11 | Des Moines, IA | 5.8 |
| 11 | Louisville, KY | 5.8 |
| 11 | Harrisburg, PA | 5.8 |
| 11 | Augusta, GA | 5.8 |
| 20 | Kansas City, MO | 5.7 |
| 20 | Portland, OR | 5.7 |
| 20 | Chicago, IL | 5.7 |
| 20 | Richmond, VA | 5.7 |
| 20 | Greenville, SC | 5.7 |
| 20 | Winston-Salem, NC | 5.7 |
| 26 | Dayton, OH | 5.6 |
| 26 | Jackson, MS | 5.6 |
| 26 | Columbia, SC | 5.6 |
| 26 | Akron, OH | 5.6 |
| 26 | Little Rock, AR | 5.6 |
| 26 | Omaha, NE | 5.6 |
| 26 | Albuquerque, NM | 5.6 |
| 26 | New Haven, CT | 5.6 |
| 26 | Scranton, PA | 5.6 |
| 26 | Allentown, PA | 5.6 |
| 26 | Cincinnati, OH | 5.6 |
| 37 | Birmingham, AL | 5.5 |
| 37 | Salt Lake City, UT | 5.5 |
| 37 | Durham, NC | 5.5 |
| 40 | Seattle, WA | 5.4 |
| 40 | St. Louis, MO | 5.4 |
| 40 | Columbus, OH | 5.4 |
| 40 | Sacramento, CA | 5.4 |
| 40 | Oklahoma City, OK | 5.4 |
| 40 | Hartford, CT | 5.4 |
| 46 | Milwaukee, WI | 5.3 |
| 46 | Bakersfield, CA | 5.3 |
| 46 | Denver, CO | 5.3 |
| 46 | Detroit, MI | 5.3 |
| 46 | Madison, WI | 5.3 |
| 46 | Rochester, NY | 5.3 |
| 46 | Fresno, CA | 5.3 |
| 46 | Nashville, TN | 5.3 |
| 46 | Honolulu, HI | 5.3 |
| 46 | Syracuse, NY | 5.3 |
| 46 | Minneapolis, MN | 5.3 |
| 46 | Pittsburgh, PA | 5.3 |
| 58 | Baton Rouge, LA | 5.2 |
| 58 | Memphis, TN | 5.2 |
| 58 | Worcester, MA | 5.2 |
| 58 | Cleveland, OH | 5.2 |
| 58 | Phoenix, AZ | 5.2 |
| 58 | Charlotte, NC | 5.2 |
| 58 | Jacksonville, FL | 5.2 |
| 58 | El Paso, TX | 5.2 |
| 66 | San Diego, CA | 5.1 |
| 66 | Albany, NY | 5.1 |
| 66 | Atlanta, GA | 5.1 |
| 66 | Stockton, CA | 5.1 |
| 66 | Providence, RI | 5.1 |
| 66 | Las Vegas, NV | 5.1 |
| 66 | Raleigh, NC | 5.1 |
| 66 | Baltimore, MD | 5.1 |
| 74 | New Orleans, LA | 5.0 |
| 74 | Charleston, SC | 5.0 |
| 74 | Philadelphia, PA | 5.0 |
| 74 | Lakeland, FL | 5.0 |
| 74 | San Antonio, TX | 5.0 |
| 74 | Riverside, CA | 5.0 |
| 80 | Honolulu, HI | 4.9 |
| 80 | Buffalo, NY | 4.9 |
| 80 | Daytona Beach, FL | 4.9 |
| 80 | Poughkeepsie, NY | 4.9 |
| 80 | Washington, DC | 4.9 |
| 80 | Fort Myers, FL | 4.9 |
| 80 | Los Angeles, CA | 4.9 |
| 87 | Orlando, FL | 4.8 |
| 87 | Boston, MA | 4.8 |
| 87 | Tampa, FL | 4.8 |
| 87 | Ventura, CA | 4.8 |
| 91 | Dallas, TX | 4.7 |
| 91 | San Francisco, CA | 4.7 |
| 91 | Houston, TX | 4.7 |
| 91 | Austin, TX | 4.7 |
| 91 | Sarasota, FL | 4.7 |
| 96 | New York, NY | 4.5 |
| 96 | San Jose, CA | 4.5 |
| 96 | Bridgeport, CT | 4.5 |
| 99 | Miami, FL | 4.4 |
| 100 | McAllen, TX | 4.0 |
Meanwhile, there are metros where used-car shoppers are hoping to find younger vehicles. McAllen, Texas, leads, with used-car shoppers looking for vehicles at an average age of 4.0. McAllen often ranks first in our auto loan debt studies — especially among millennials — suggesting that some buyers there may opt for more expensive car purchases than they can comfortably afford.
- Americans in 100 largest metros carry median of $18,762 in nonmortgage debt — here’s a breakdown by generation
- Where millennials owe the most on their cars
Miami is the second-youngest, with an average age of 4.4, followed by a three-way tie among Bridgeport, Conn., San Jose, Calif., and New York at 4.5. Again, many of these metros have higher-than-average median household incomes, which may give buyers more leeway to purchase newer, nicer vehicles.
Loan amounts, insurance costs decline as cars get older
While older cars aren’t perfect and sometimes lack the more advanced safety features of newer vehicles, the debt people go into to buy them tends to be lower.
Case in point: In 2025, the average loan request for a 1-to-2-year-old vehicle was $36,240, which drops precipitously as used vehicles get older. (A 6-to-10-year-old vehicle can be financed for an average of $22,130, in contrast, while a vehicle more than a decade old sees an average loan of just $13,102.)
Along with financing prices, insurance premium rates also tend to drop as vehicles get older: In our analysis, a 2024 Honda Civic LX saw an annual insurance rate of $2,999, while a 2019 model’s rate dropped to $2,575. (A 2014 model’s rate was $2,272, and a 2009 model’s rate was just $2,131.)
Avg. annual insurance costs by model year for Honda Civic LX
| Model year | Avg. |
|---|---|
| 2024 | $2,999 |
| 2019 | $2,575 |
| 2014 | $2,272 |
| 2009 | $2,131 |
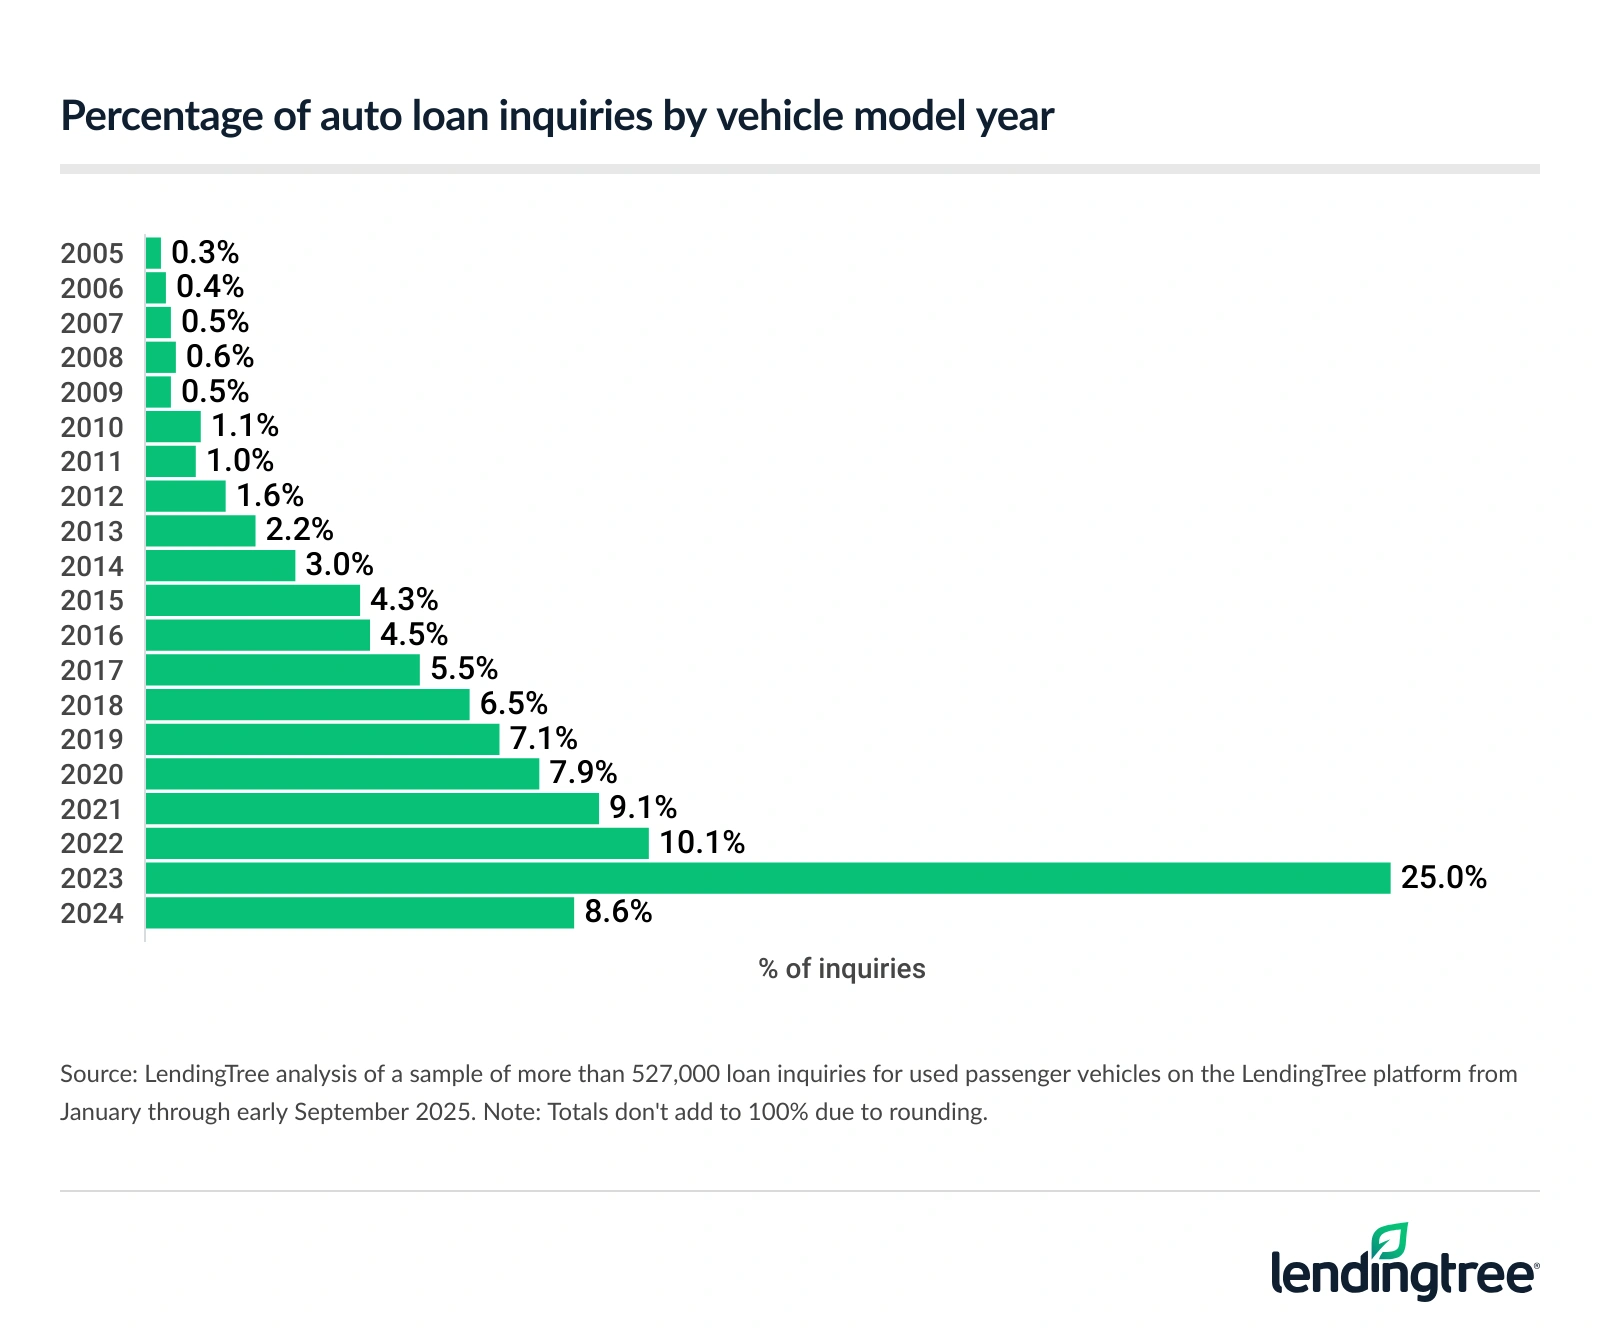
We also analyzed which model years tend to dominate used car inquiries — and our findings indicate that many prefer to shop newer vehicles, even if they don’t buy them. Vehicles from 2023 alone made up a quarter of used car inquiries (25.0%), while 2022 model-year vehicles accounted for 10.1%. By contrast, model years from 2011 or earlier each represent just about 1.0% or less of total inquiries.
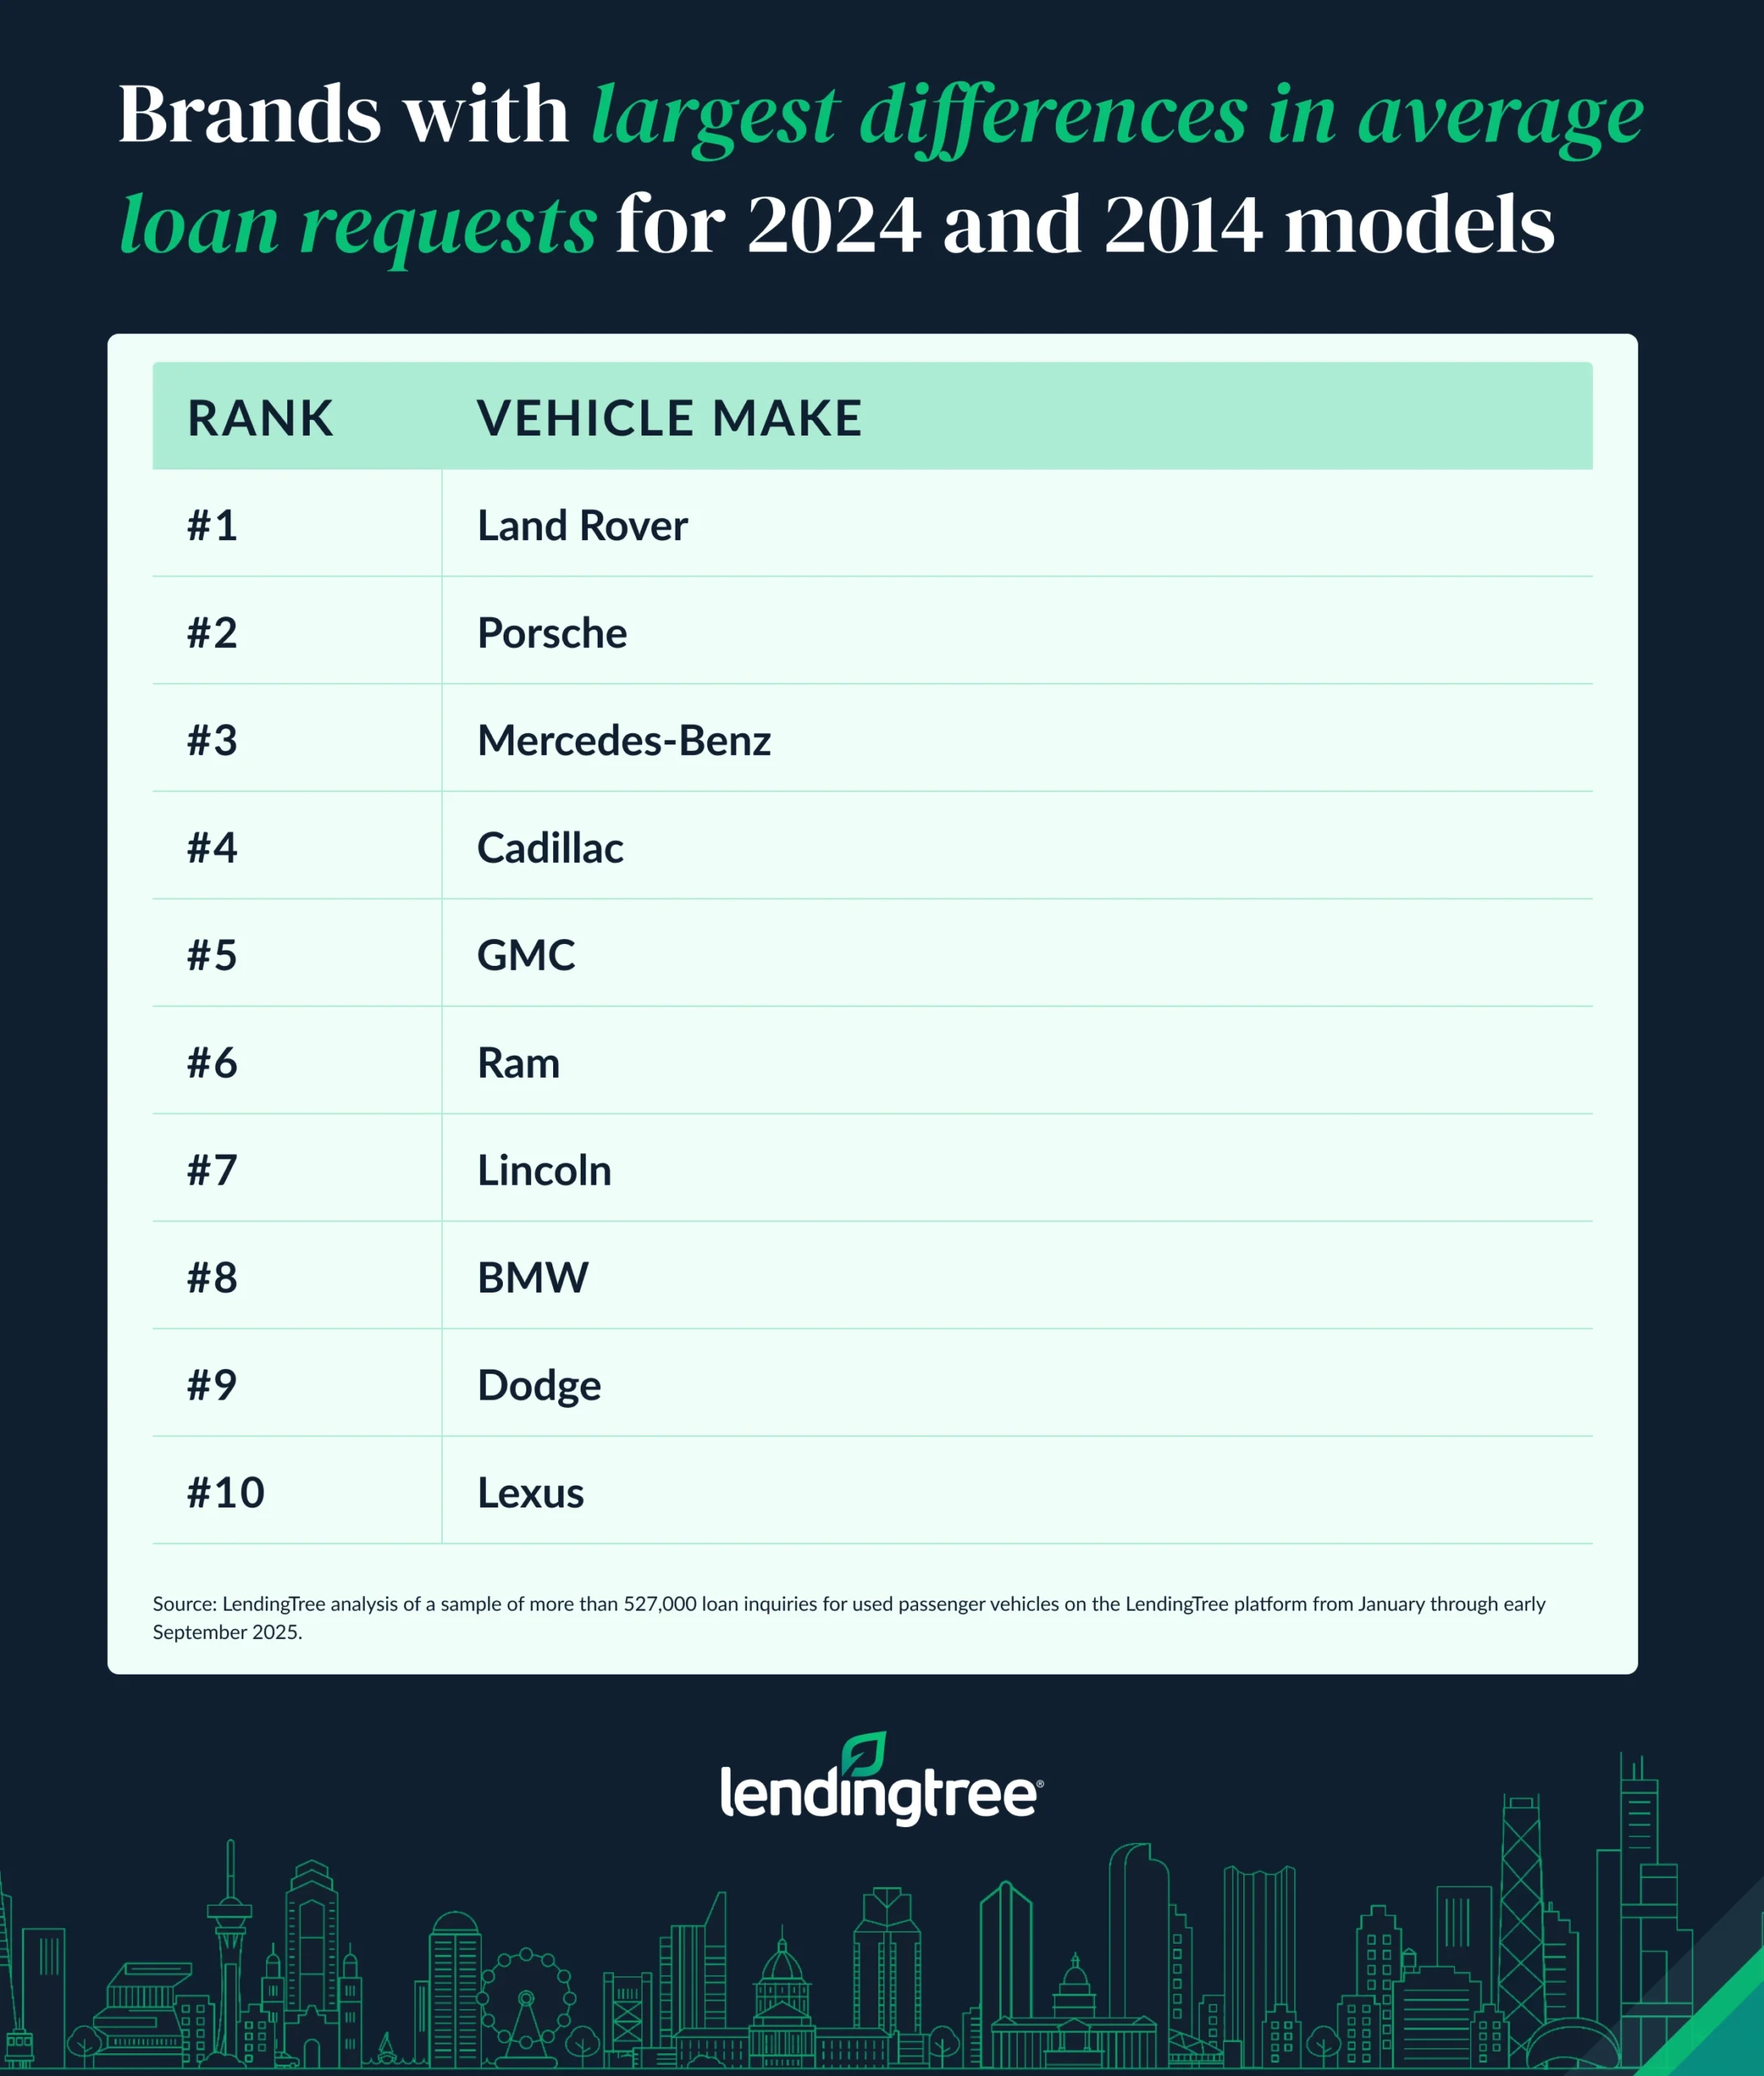
Luxury brands have biggest differences in loan requests
While loan amounts differ for most vehicles depending on the model year, luxury brands see the largest discrepancies based on the age of the car. For example, the average loan amount requested for a 2024 Land Rover was $67,955, while the average amount for a 2014 model was $15,697 — a significant difference of $52,259 (or more than the average cost of a brand-new car).
Other brands at the top of this list include Porsche (a $45,797 discrepancy between 2024 and 2014 models), Mercedes-Benz ($42,003) and Cadillac ($40,897).
Meanwhile, the lowest-ranking brands include Japanese brands Mitsubishi ($16,015 discrepancy), Subaru ($16,340) and Mazda ($16,927). Some non-Japanese brands, including Mini ($17,122) and Buick ($17,681), also saw the lowest loan differences. (Note: This analysis looked at the 30 makes with the most inquiries in the analyzed period.)
Because luxury cars tend to cost significantly more, it makes sense that their depreciation values would also be substantial. If you lose 10% of a new car’s value just driving it off the lot, that adds up to a lot more on a car that costs $70,000 than one that costs $30,000.
Additionally, luxury vehicle-buyers, who’ve already demonstrated a willingness to pay more for quality, may also be drawn to the flashy new features that only the latest models offer. This can drive up demand for newer models and more quickly depreciate the prices of older ones.
Full rankings: Difference in avg. loan amount requests for 2024, 2014 models (by vehicle make)
| Rank | Vehicle make | Avg., 2024 models | Avg., 2014 models | $ difference |
|---|---|---|---|---|
| 1 | Land Rover | $67,955 | $15,697 | $52,259 |
| 2 | Porsche | $80,629 | $34,832 | $45,797 |
| 3 | Mercedes-Benz | $57,636 | $15,633 | $42,003 |
| 4 | Cadillac | $54,684 | $13,788 | $40,897 |
| 5 | GMC | $54,372 | $15,156 | $39,216 |
| 6 | Ram | $56,045 | $18,599 | $37,446 |
| 7 | Lincoln | $46,284 | $11,287 | $34,997 |
| 8 | BMW | $48,963 | $15,868 | $33,095 |
| 9 | Dodge | $45,502 | $12,991 | $32,511 |
| 10 | Lexus | $47,333 | $16,026 | $31,308 |
| 11 | Ford | $45,916 | $14,690 | $31,226 |
| 12 | Jeep | $44,423 | $15,003 | $29,420 |
| 13 | Chevrolet | $42,767 | $15,014 | $27,753 |
| 14 | Audi | $43,276 | $16,330 | $26,946 |
| 15 | Infiniti | $39,761 | $13,492 | $26,270 |
| 16 | Volvo | $36,072 | $10,079 | $25,994 |
| 17 | Tesla | $42,923 | $17,534 | $25,389 |
| 18 | Chrysler | $36,476 | $11,100 | $25,375 |
| 19 | Acura | $35,973 | $12,645 | $23,328 |
| 20 | Toyota | $37,081 | $14,305 | $22,776 |
| 21 | Volkswagen | $32,622 | $10,631 | $21,991 |
| 22 | Kia | $32,986 | $11,066 | $21,920 |
| 23 | Hyundai | $31,134 | $9,715 | $21,419 |
| 24 | Nissan | $30,362 | $12,001 | $18,361 |
| 25 | Honda | $30,648 | $12,781 | $17,868 |
| 26 | Buick | $28,523 | $10,841 | $17,681 |
| 27 | Mini | $28,650 | $11,528 | $17,122 |
| 28 | Mazda | $27,689 | $10,763 | $16,927 |
| 29 | Subaru | $28,489 | $12,149 | $16,340 |
| 30 | Mitsubishi | $30,691 | $14,676 | $16,015 |
Shopping around for an older car: Top expert tips
Shopping around for an older car can be a tried-and-true way to save money on your vehicle purchase, but doing so smartly is a skill. Here are our top expert tips to help steer you in the right direction on your used-car-buying journey and help you avoid any lemons.
- Get a prepurchase inspection (PPI). At a used car dealership (or especially in a private sale), a test drive and even the CARFAX don’t tell you everything. Insist on a prepurchase inspection with a mechanic you trust. Although most dealerships have their own mechanic on site, you should be able to work with your own if you want to — and you may be able to work out a nonbinding purchase offer and refundable deposit pending the inspection.
- Consider certified preowned (CPO). Certified preowned vehicles undergo a thorough inspection and repair protocol, and may also come with options for extended manufacturer warranties. That can make them a safer option, but at a slightly higher price: They tend to cost about 2% more than their noncertified counterparts.
- Get an insurance quote up front. “When you’re shopping for a used car,” says Bishop, “you should get some insurance quotes to make sure you can afford the monthly payment before committing.”
- Make and model matter. “If you’re concerned about finding an affordable policy,” Bishop goes on, “consider cars that are typically cheaper to insure, such as a Honda CR-V or Mazda CX-5. Avoid cars with expensive technology and hybrid options. They usually cost more to insure because their high-tech parts make them expensive to fix after an accident.”
- Yes, switching can help you save. According to another LendingTree study, a whopping 92% of Americans who switched auto insurance carriers saved money. That’s well worth a phone call.
Methodology
LendingTree analysts used a sample of more than 527,000 loan inquiries for used passenger vehicles on the LendingTree platform from January through Sept. 5, 2025. We used this to determine the average age of used vehicles sought by state and among the 100 largest metros.
Vehicle age was calculated by subtracting the model year from 2025, analyzing 2005 through 2024.
Additionally, vehicles were grouped into age ranges: 1 to 2 years, 3 to 5 years, 6 to 10 years and 11 years and older. The average loan amount was calculated for each of these ranges.
To determine auto insurance rates by model years, researchers analyzed auto insurance data, pulled in September 2025, from Quadrant Information Services. Quotes were for a Honda Civic LX with 2024, 2019, 2014 and 2009 model years driven by a 30-year-old man with a clean record and good credit. Researchers used Illinois because it’s most representative of what an average state’s rates will look like.
These rates were publicly sourced from insurer filings and should be used for comparative purposes only. Your quotes will likely differ. Full coverage policies include coverage limits above minimum requirements.
Finally, analysts calculated the average requested loan amount for 30 vehicle makes in 2024 and 2014, then measured the difference between the model years. This analyzed the 30 makes with the most used car inquiries in the studied period.
Get auto loan offers from up to 5 lenders in minutes