US Gas Prices Soar Nearly 30% Nationwide — Every State Hit With Double-Digit Increases


Gas prices are climbing sharply across the U.S., leaving no state untouched.
The national average hit $4.11 per gallon on April 15, 2026 — a steep 29.5% jump from a year ago — with double-digit increases in every state and metro.
After rapid increases in recent months, drivers are now seeing some of the highest prices in years, with costs nearing $6.00 per gallon in California and surging by more than 40.0% in some states.
Here are our findings.
- The average U.S. gas price on April 15, 2026, was $4.11 per gallon — up a significant 29.5% from $3.17 one year earlier.
- Average monthly gas prices surged to $3.64 per gallon in March 2026. The average was $2.91 in February and $2.81 in January.
- The highest average gas prices are in California ($5.88 per gallon), followed by Hawaii ($5.65) and Washington ($5.39).
- Oklahoma has the lowest average gas price ($3.44 per gallon), ahead of Kansas ($3.51) and North Dakota ($3.62).
- Average gas prices saw double-digit increases in every state between April 15, 2025, and April 15, 2026. They rose the most in Kentucky (42.5%), Tennessee (42.2%) and New Hampshire (38.8%).
- Average gas prices increased the least between April 15, 2025, and April 15, 2026, in Nebraska (18.4%), North Dakota (18.6%) and South Dakota and Minnesota (both at 19.5%).
- Similarly, average gas prices jumped in every metro in the same period. They increased the most in Elizabethtown-Fort Knox, Ky. (50.9%), Cleveland, Tenn. (48.9%), and Bowling Green, Ky. (48.3%).
- By metro, average gas prices jumped the least in Rapid City, S.D. (11.9%), Fargo-Moorhead, N.D. (13.1%), and North Platte, Neb. (13.9%).
How much have average gas prices increased?
On April 15, 2026, the average U.S. gas price was $4.11 per gallon. That’s up a substantial 29.5% from $3.17 on April 15, 2025.
The average monthly price per gallon rose significantly to $3.64 in March 2026 after being at $2.91 in February and $2.81 in January. The last time monthly gas prices were higher was in September 2023, when they were $3.84.
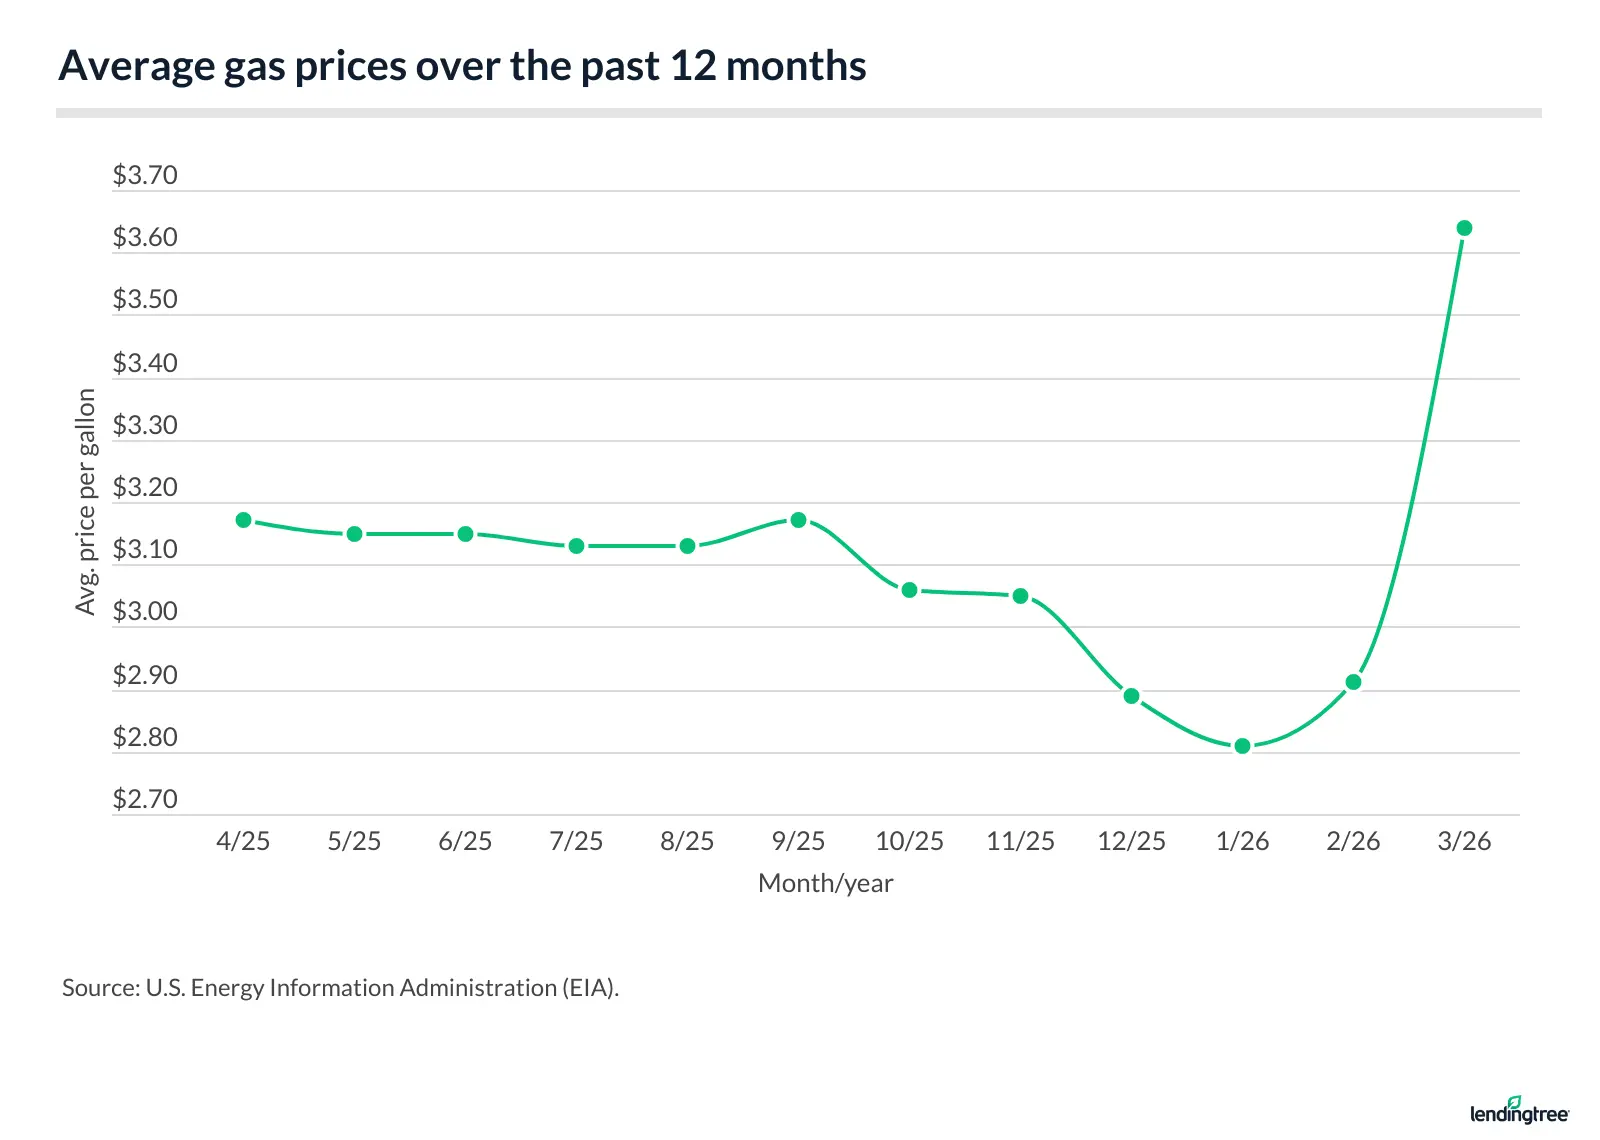
Average gas prices over the past 12 months
| Month | Avg. price per gallon |
|---|---|
| March 2026 | $3.64 |
| February 2026 | $2.91 |
| January 2026 | $2.81 |
| December 2025 | $2.89 |
| November 2025 | $3.05 |
| October 2025 | $3.06 |
| September 2025 | $3.17 |
| August 2025 | $3.13 |
| July 2025 | $3.13 |
| June 2025 | $3.15 |
| May 2025 | $3.15 |
| April 2025 | $3.17 |
Six of the 10 months with the highest average gas prices, dating back to 1992, occurred in 2022 — including the top five. Notably, the only other months where average gas prices reached over $4.00 a gallon were June and July 2008, when demand was high but global oil production was low. The March 2026 average of $3.64 is inching closer to the bottom of the top-10 list.
Highest gas prices (historical)
| Rank | Month | Avg. price per gallon |
|---|---|---|
| 1 | June 2022 | $4.93 |
| 2 | July 2022 | $4.56 |
| 3 | May 2022 | $4.44 |
| 4 | March 2022 | $4.22 |
| 5 | April 2022 | $4.11 |
| 6 | July 2008 | $4.06 |
| 7 | June 2008 | $4.05 |
| 8 | August 2022 | $3.98 |
| 9 | May 2011 | $3.91 |
| 10 | April 2012 | $3.90 |
Still, 2022 wasn’t the worst year for gas prices. After adjusting for inflation, 2012 had the highest average gas price at $5.07 per gallon. On an unadjusted basis, it was $3.62 per gallon.
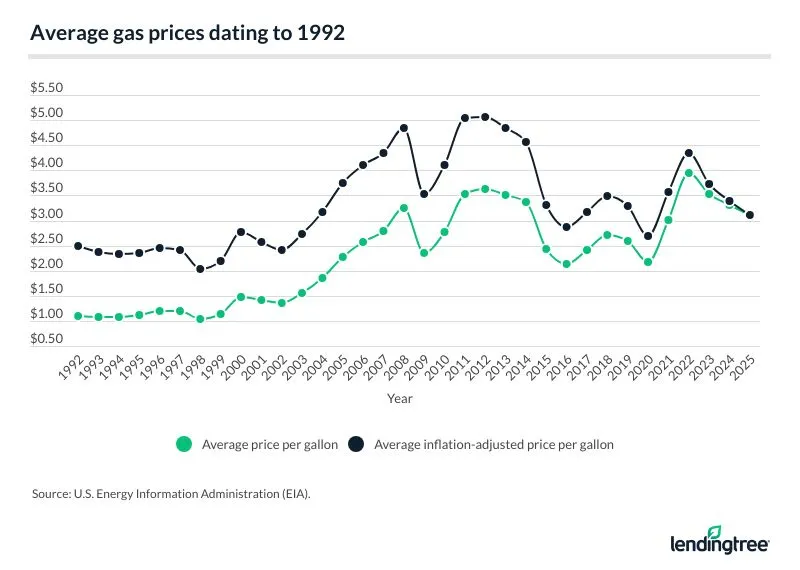
Avg. gas prices dating to 1992
| Year | Avg. price per gallon | Avg. inflation-adjusted price per gallon |
|---|---|---|
| 2025 | $3.10 | $3.10 |
| 2024 | $3.30 | $3.39 |
| 2023 | $3.52 | $3.72 |
| 2022 | $3.95 | $4.35 |
| 2021 | $3.01 | $3.57 |
| 2020 | $2.17 | $2.70 |
| 2019 | $2.60 | $3.28 |
| 2018 | $2.72 | $3.49 |
| 2017 | $2.42 | $3.17 |
| 2016 | $2.14 | $2.87 |
| 2015 | $2.43 | $3.30 |
| 2014 | $3.36 | $4.57 |
| 2013 | $3.51 | $4.84 |
| 2012 | $3.62 | $5.07 |
| 2011 | $3.52 | $5.04 |
| 2010 | $2.78 | $4.11 |
| 2009 | $2.35 | $3.53 |
| 2008 | $3.25 | $4.85 |
| 2007 | $2.80 | $4.34 |
| 2006 | $2.57 | $4.11 |
| 2005 | $2.27 | $3.74 |
| 2004 | $1.85 | $3.16 |
| 2003 | $1.56 | $2.73 |
| 2002 | $1.35 | $2.41 |
| 2001 | $1.42 | $2.58 |
| 2000 | $1.48 | $2.77 |
| 1999 | $1.14 | $2.20 |
| 1998 | $1.03 | $2.03 |
| 1997 | $1.20 | $2.41 |
| 1996 | $1.20 | $2.46 |
| 1995 | $1.11 | $2.35 |
| 1994 | $1.08 | $2.34 |
| 1993 | $1.07 | $2.38 |
| 1992 | $1.09 | $2.49 |
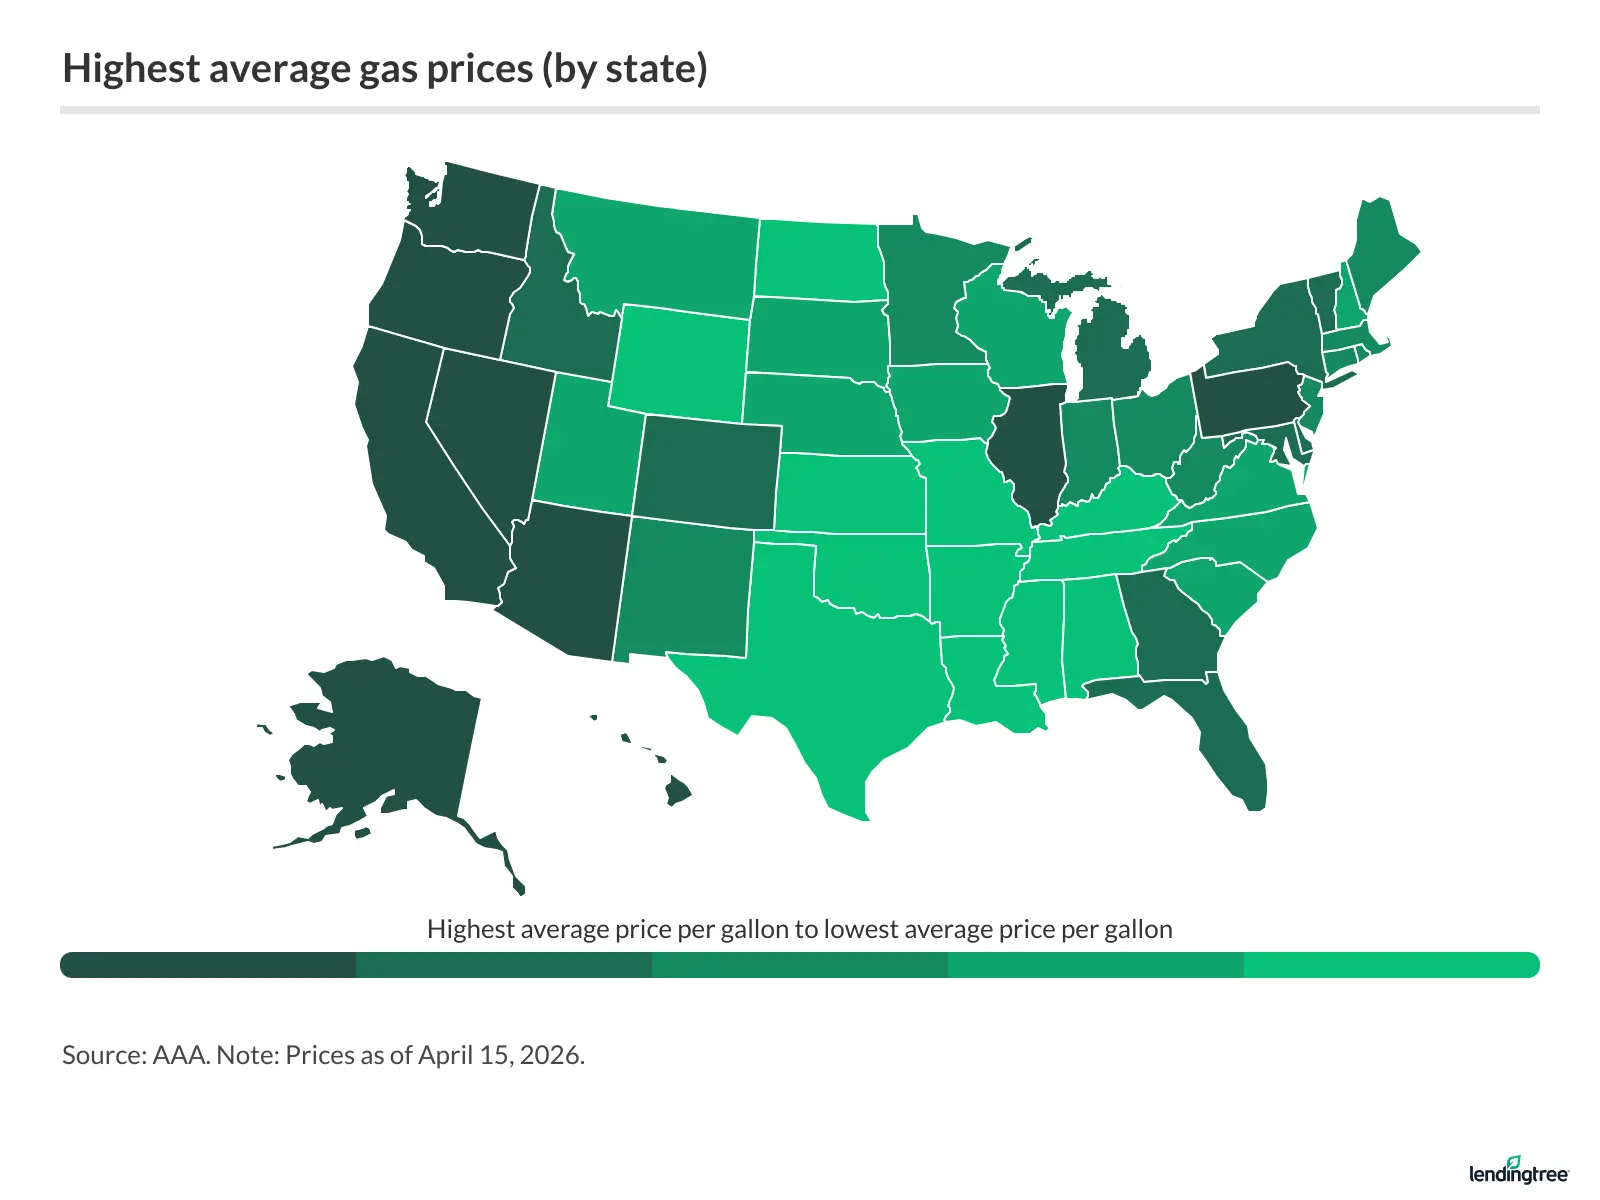
Where are average gas prices highest and lowest?
As of April 15, 2026, the highest average gas price nationwide is in California ($5.88 per gallon), followed by Hawaii ($5.65) and Washington ($5.39). One other state, Oregon, is also at $5.00 per gallon.
States with the highest average gas prices
| Rank | State | Avg. price per gallon |
|---|---|---|
| 1 | California | $5.88 |
| 2 | Hawaii | $5.65 |
| 3 | Washington | $5.39 |
| 4 | Oregon | $5.00 |
| 5 | Nevada | $4.96 |
Conversely, Oklahoma has the lowest average gas price at $3.44 per gallon, followed by Kansas ($3.51) and North Dakota ($3.62).
To highlight the rapid increase, only six states had average prices above $3.44 in our March report.
States with the lowest average gas prices
| Rank | State | Avg. price per gallon |
|---|---|---|
| 1 | Oklahoma | $3.44 |
| 2 | Kansas | $3.51 |
| 3 | North Dakota | $3.62 |
| 4 | Nebraska | $3.63 |
| 5 | Iowa | $3.65 |
| 5 | Arkansas | $3.65 |
Full rankings
Highest average gas prices (by state)
| Rank | State | Avg. price per gallon | % difference from avg. U.S. gas price |
|---|---|---|---|
| 1 | California | $5.88 | 43.1% |
| 2 | Hawaii | $5.65 | 37.5% |
| 3 | Washington | $5.39 | 31.2% |
| 4 | Oregon | $5.00 | 21.7% |
| 5 | Nevada | $4.96 | 20.7% |
| 6 | Arizona | $4.66 | 13.4% |
| 7 | Alaska | $4.64 | 13.0% |
| 8 | Illinois | $4.36 | 6.1% |
| 9 | Idaho | $4.34 | 5.6% |
| 10 | District of Columbia | $4.29 | 4.4% |
| 11 | Utah | $4.21 | 2.5% |
| 12 | Florida | $4.15 | 1.0% |
| 13 | Pennsylvania | $4.13 | 0.5% |
| 13 | New York | $4.13 | 0.5% |
| 15 | Maryland | $4.10 | -0.2% |
| 16 | Vermont | $4.09 | -0.4% |
| 17 | Connecticut | $4.08 | -0.7% |
| 18 | Maine | $4.02 | -2.1% |
| 19 | New Jersey | $4.00 | -2.6% |
| 20 | Kentucky | $3.98 | -3.1% |
| 21 | Delaware | $3.97 | -3.4% |
| 21 | Massachusetts | $3.97 | -3.4% |
| 21 | Rhode Island | $3.97 | -3.4% |
| 21 | Virginia | $3.97 | -3.4% |
| 25 | Colorado | $3.96 | -3.6% |
| 25 | New Mexico | $3.96 | -3.6% |
| 25 | New Hampshire | $3.96 | -3.6% |
| 28 | West Virginia | $3.93 | -4.3% |
| 29 | Michigan | $3.92 | -4.6% |
| 30 | Montana | $3.90 | -5.1% |
| 31 | Wyoming | $3.89 | -5.3% |
| 32 | Indiana | $3.88 | -5.6% |
| 33 | North Carolina | $3.86 | -6.0% |
| 33 | Tennessee | $3.86 | -6.0% |
| 35 | Alabama | $3.84 | -6.5% |
| 36 | Ohio | $3.80 | -7.5% |
| 37 | South Carolina | $3.79 | -7.7% |
| 38 | Wisconsin | $3.78 | -8.0% |
| 39 | Texas | $3.77 | -8.2% |
| 40 | Louisiana | $3.75 | -8.7% |
| 41 | Mississippi | $3.74 | -9.0% |
| 42 | Minnesota | $3.71 | -9.7% |
| 43 | Georgia | $3.68 | -10.4% |
| 43 | South Dakota | $3.68 | -10.4% |
| 45 | Missouri | $3.67 | -10.7% |
| 46 | Iowa | $3.65 | -11.1% |
| 46 | Arkansas | $3.65 | -11.1% |
| 48 | Nebraska | $3.63 | -11.6% |
| 49 | North Dakota | $3.62 | -11.9% |
| 50 | Kansas | $3.51 | -14.6% |
| 51 | Oklahoma | $3.44 | -16.3% |
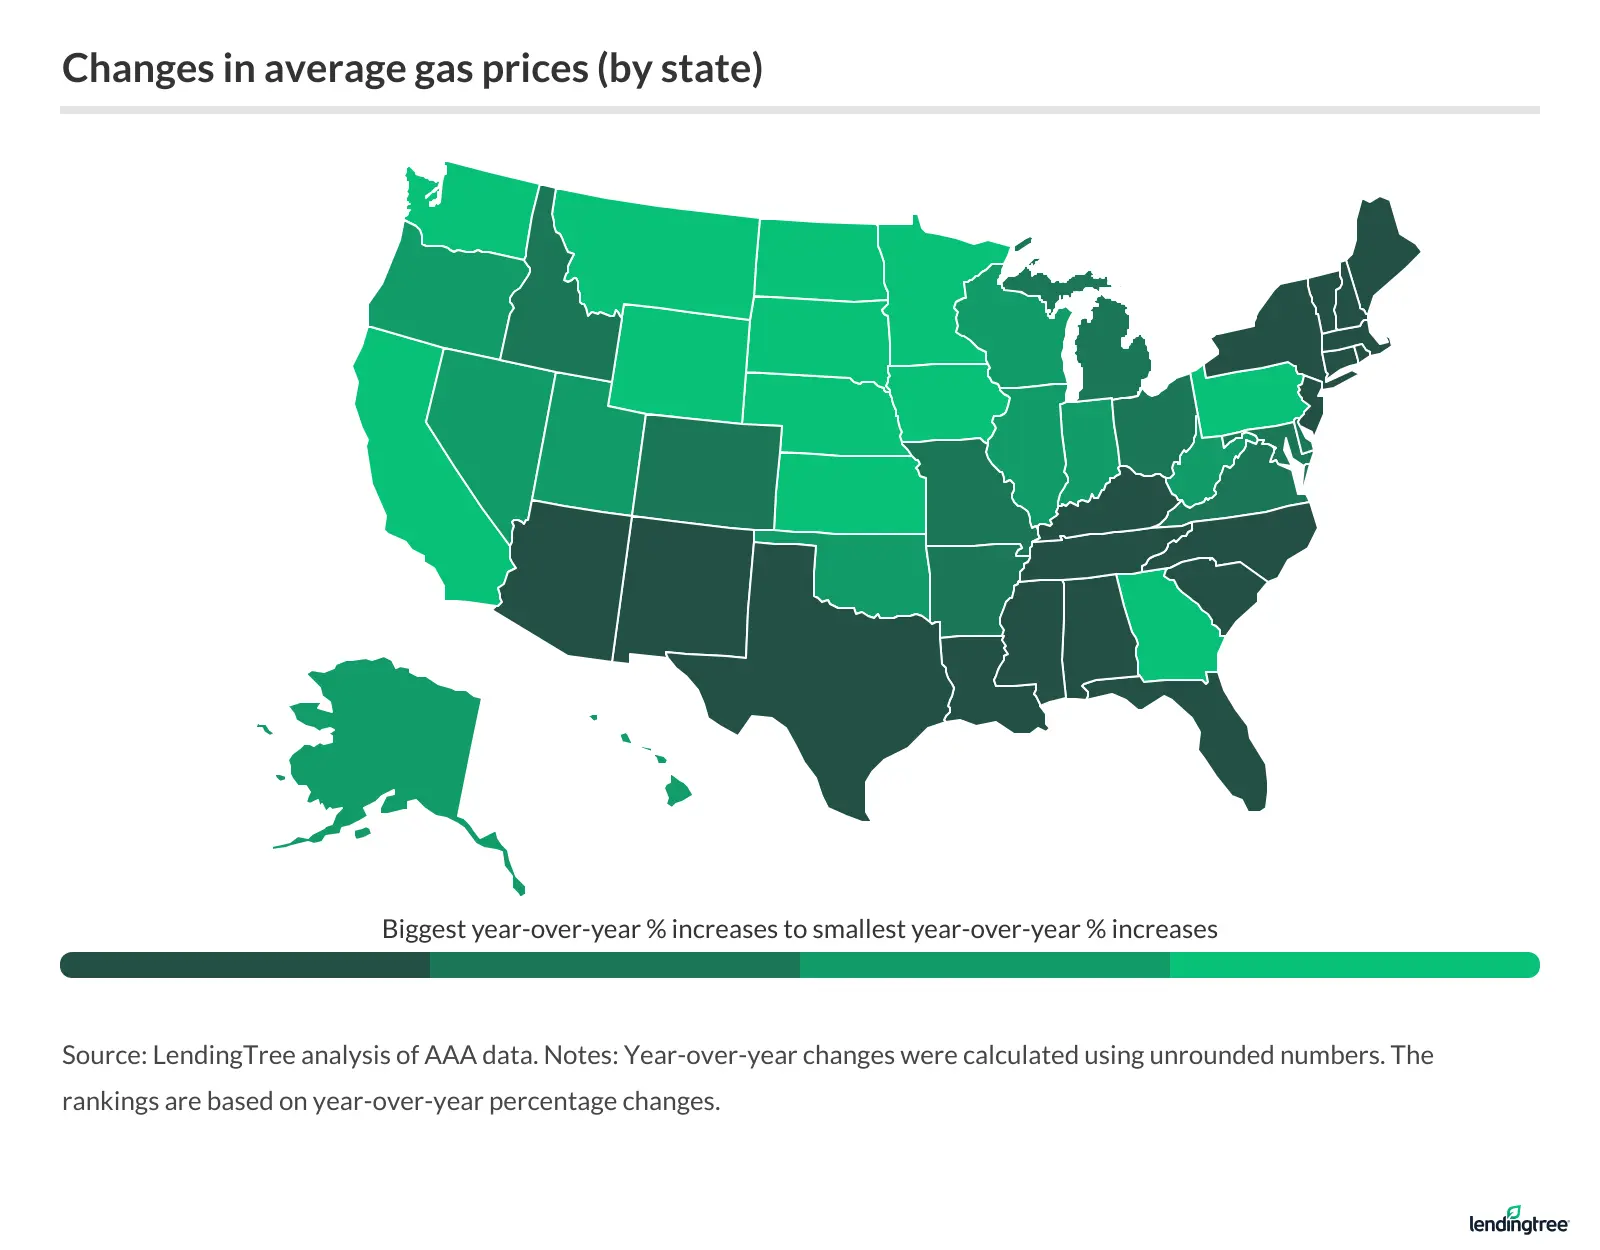
Where have average gas prices increased the most?
Not surprisingly, average gas prices increased by double digits in every state between April 15, 2025, and April 15, 2026.
The average gas price increased in Kentucky by 42.5% from $2.80 to $3.98 per gallon, followed by Tennessee (42.2%, from $2.72 to $3.86) and New Hampshire (38.8% from $2.85 to $3.96).
States with the biggest increases in average gas prices
| Rank | State | Avg. gas price, April 15, 2026 | Avg. gas price, April 15, 2025 | YoY % change | YoY $ change |
|---|---|---|---|---|---|
| 1 | Kentucky | $3.98 | $2.80 | 42.5% | $1.19 |
| 2 | Tennessee | $3.86 | $2.72 | 42.2% | $1.15 |
| 3 | New Hampshire | $3.96 | $2.85 | 38.8% | $1.11 |
| 4 | Mississippi | $3.74 | $2.71 | 38.2% | $1.03 |
| 5 | Arizona | $4.66 | $3.38 | 38.1% | $1.29 |
Meanwhile, average gas prices increased the least in Nebraska between April 15, 2025, and April 15, 2026 — though the change was still significant. There, gas prices rose 18.4% from $3.06 to $3.63. North Dakota, where prices increased 18.6% from $3.05 to $3.62, and Minnesota and South Dakota, where prices rose 19.5% from $3.10 and $3.08 to $3.71 and $3.68, followed.
States with the smallest increases in average gas prices
| Rank | State | Avg. gas price, April 15, 2026 | Avg. gas price, April 15, 2025 | YoY % change | YoY $ change |
|---|---|---|---|---|---|
| 1 | Nebraska | $3.63 | $3.06 | 18.4% | $0.56 |
| 2 | North Dakota | $3.62 | $3.05 | 18.6% | $0.57 |
| 3 | Minnesota | $3.71 | $3.10 | 19.5% | $0.61 |
| 3 | South Dakota | $3.68 | $3.08 | 19.5% | $0.60 |
| 5 | California | $5.88 | $4.88 | 20.5% | $1.00 |
Full rankings
Changes in average gas prices (by state)
| Rank | State | Avg. gas price, April 15, 2026 | Avg. gas price, April 15, 2025 | YoY % change | YoY $ change |
|---|---|---|---|---|---|
| 1 | Kentucky | $3.98 | $2.80 | 42.5% | $1.19 |
| 2 | Tennessee | $3.86 | $2.72 | 42.2% | $1.15 |
| 3 | New Hampshire | $3.96 | $2.85 | 38.8% | $1.11 |
| 4 | Mississippi | $3.74 | $2.71 | 38.2% | $1.03 |
| 5 | Arizona | $4.66 | $3.38 | 38.1% | $1.29 |
| 6 | South Carolina | $3.79 | $2.76 | 37.4% | $1.03 |
| 7 | Alabama | $3.84 | $2.81 | 36.8% | $1.03 |
| 8 | Texas | $3.77 | $2.76 | 36.7% | $1.01 |
| 9 | New Mexico | $3.96 | $2.91 | 35.9% | $1.05 |
| 10 | Maine | $4.02 | $2.97 | 35.7% | $1.06 |
| 11 | Florida | $4.15 | $3.07 | 35.2% | $1.08 |
| 11 | Rhode Island | $3.97 | $2.94 | 35.2% | $1.03 |
| 13 | Louisiana | $3.75 | $2.78 | 34.8% | $0.97 |
| 14 | Massachusetts | $3.97 | $2.95 | 34.3% | $1.01 |
| 15 | Connecticut | $4.08 | $3.04 | 34.1% | $1.04 |
| 16 | New Jersey | $4.00 | $2.99 | 33.8% | $1.01 |
| 17 | North Carolina | $3.86 | $2.89 | 33.7% | $0.97 |
| 18 | New York | $4.13 | $3.10 | 33.0% | $1.02 |
| 19 | Vermont | $4.09 | $3.09 | 32.2% | $1.00 |
| 20 | District of Columbia | $4.29 | $3.25 | 32.0% | $1.04 |
| 21 | Virginia | $3.97 | $3.03 | 31.2% | $0.94 |
| 22 | Delaware | $3.97 | $3.05 | 30.4% | $0.93 |
| 23 | Colorado | $3.96 | $3.05 | 30.0% | $0.91 |
| 24 | Arkansas | $3.65 | $2.81 | 29.9% | $0.84 |
| 25 | Idaho | $4.34 | $3.36 | 29.2% | $0.98 |
| 26 | Ohio | $3.80 | $2.95 | 28.9% | $0.85 |
| 27 | Maryland | $4.10 | $3.19 | 28.8% | $0.92 |
| 28 | Michigan | $3.92 | $3.05 | 28.4% | $0.87 |
| 29 | Missouri | $3.67 | $2.87 | 28.1% | $0.81 |
| 30 | Illinois | $4.36 | $3.42 | 27.8% | $0.95 |
| 31 | West Virginia | $3.93 | $3.09 | 27.4% | $0.85 |
| 32 | Alaska | $4.64 | $3.65 | 27.3% | $1.00 |
| 33 | Utah | $4.21 | $3.32 | 26.8% | $0.89 |
| 34 | Oklahoma | $3.44 | $2.72 | 26.7% | $0.73 |
| 35 | Nevada | $4.96 | $3.93 | 26.4% | $1.04 |
| 36 | Indiana | $3.88 | $3.09 | 25.8% | $0.80 |
| 37 | Oregon | $5.00 | $3.98 | 25.5% | $1.01 |
| 37 | Wisconsin | $3.78 | $3.01 | 25.5% | $0.77 |
| 39 | Hawaii | $5.65 | $4.52 | 25.0% | $1.13 |
| 40 | Georgia | $3.68 | $2.97 | 24.2% | $0.72 |
| 41 | Washington | $5.39 | $4.36 | 23.6% | $1.03 |
| 42 | Montana | $3.90 | $3.16 | 23.5% | $0.74 |
| 43 | Pennsylvania | $4.13 | $3.36 | 23.0% | $0.77 |
| 44 | Kansas | $3.51 | $2.85 | 22.9% | $0.65 |
| 45 | Wyoming | $3.89 | $3.18 | 22.6% | $0.72 |
| 46 | Iowa | $3.65 | $2.99 | 22.1% | $0.66 |
| 47 | California | $5.88 | $4.88 | 20.5% | $1.00 |
| 48 | Minnesota | $3.71 | $3.10 | 19.5% | $0.61 |
| 48 | South Dakota | $3.68 | $3.08 | 19.5% | $0.60 |
| 50 | North Dakota | $3.62 | $3.05 | 18.6% | $0.57 |
| 51 | Nebraska | $3.63 | $3.06 | 18.4% | $0.56 |
Biggest metro increases in Kentucky and Tennessee
Similarly, average gas prices increased in every tracked metro (as designated by AAA).
Elizabethtown-Fort Knox, Ky., saw the largest increase, with gas prices rising by 50.9% from $2.64 to $3.98. This was followed by Cleveland, Tenn., where prices increased by 48.9%, from $2.58 to $3.84, and Bowling Green, Ky., with a 48.3% increase from $2.68 to $3.98.
Metros with the biggest increases in average gas prices
| Rank | Metro | Avg. gas price, April 15, 2026 | Avg. gas price, April 15, 2025 | YoY % change | YoY $ change |
|---|---|---|---|---|---|
| 1 | Elizabethtown-Fort Knox, KY | $3.98 | $2.64 | 50.9% | $1.34 |
| 2 | Cleveland, TN | $3.84 | $2.58 | 48.9% | $1.26 |
| 3 | Bowling Green, KY | $3.98 | $2.68 | 48.3% | $1.30 |
| 4 | San Angelo, TX | $3.96 | $2.68 | 47.9% | $1.28 |
| 5 | Tucson, AZ | $4.51 | $3.08 | 46.4% | $1.43 |
| 6 | Clarksville-Hopkinsville (TN only), TN | $3.86 | $2.64 | 46.3% | $1.22 |
| 7 | Victoria, TX | $3.87 | $2.65 | 46.2% | $1.22 |
| 8 | Pima County, AZ | $4.50 | $3.09 | 45.9% | $1.41 |
| 8 | Chattanooga (TN only), TN | $3.80 | $2.60 | 45.9% | $1.20 |
| 10 | Abilene, TX | $3.74 | $2.57 | 45.7% | $1.17 |
Meanwhile, Rapid City, S.D., saw average gas prices rise the least, by 11.9% from $3.39 to $3.79. Rounding out the top three lowest increases are Fargo-Moorhead, N.D., where prices rose by 13.1% from $3.01 to $3.40, and North Platte, Neb., where prices increased by 13.9% from $3.24 to $3.69.
Metros with the smallest increases in average gas prices
| Rank | Metro | Avg. gas price, April 15, 2026 | Avg. gas price, April 15, 2025 | YoY % change | YoY $ change |
|---|---|---|---|---|---|
| 1 | Rapid City, SD | $3.79 | $3.39 | 11.9% | $0.40 |
| 2 | Fargo-Moorhead (ND only), ND | $3.40 | $3.01 | 13.1% | $0.39 |
| 3 | North Platte, NE | $3.69 | $3.24 | 13.9% | $0.45 |
| 4 | Mercer County, PA | $4.11 | $3.60 | 14.1% | $0.51 |
| 5 | Santa Cruz-Watsonville, CA | $5.85 | $5.10 | 14.8% | $0.75 |
| 6 | Napa, CA | $6.04 | $5.22 | 15.7% | $0.82 |
| 6 | Salinas, CA | $6.00 | $5.19 | 15.7% | $0.81 |
| 8 | Pittsburgh, PA | $4.16 | $3.60 | 15.8% | $0.56 |
| 9 | Ames, IA | $3.71 | $3.20 | 16.1% | $0.51 |
| 9 | Superior, WI | $3.67 | $3.16 | 16.1% | $0.51 |
How can I utilize credit cards for cash back at the gas station?
The U.S. Energy Information Administration (EIA) forecasts gas prices to be $3.70 per gallon in 2026 before coming down to $3.46 per gallon in 2027.
LendingTree chief consumer finance analyst Matt Schulz says drivers can take a few steps to save on gas at the pump. First, he recommends shopping around.
“It doesn’t make sense to drive across town to save 3 cents a gallon, but gas prices can vary quite a bit even in a small area,” he says. “Driving an extra few blocks for a lower gas price can add up over a year, especially for drivers who fill up frequently.”
Next, Schulz advises leveraging credit cards with the best gas station rewards.
“Whether you’re loyal to one specific gas station chain or just looking to save on gas prices no matter where you fill up, plenty of credit cards can help you,” he says. “Just know that gas station-specific cards tend to have higher-than-average APRs, so make sure you pay them off in full every month if you’re going to use them. Otherwise, the amount you save on gas can quickly be outweighed by how much you accrue in interest.”
Methodology
LendingTree researchers analyzed AAA data on average regular gas prices in states and metros. Prices are as of April 15, 2026, and are compared to those on April 15, 2025.
U.S. Energy Information Administration (EIA) data was used to calculate average historical prices of regular gas per gallon.