Average Car Payment and Auto Loan Statistics: 2026
The average new car payment reached a record $767 a month in the fourth quarter of 2025, up 2.8% from Q4 2024. Average used and leased car payments increased by a similar 1.7% and 1.5% over the same period.
LendingTree looked at payments, originations, term lengths, delinquencies and more to get a full picture of U.S. auto loan debt and trends. Here’s our 2026 roundup of auto loan statistics.
- Average payments for new, used and leased vehicles rose year over year. Average new car payments increased by 2.8%, according to Q4 2025 Experian data. In the same period, average used and leased car payments increased by 1.7% and 1.5%. That puts average monthly payments at $767, $537 and $613, respectively.
- The price of new cars increased, while used cars and trucks saw a decrease. New vehicle prices are up 0.5% year over year, according to the March 2026 U.S. Bureau of Labor Statistics (BLS) consumer price index (CPI), while used cars and trucks dropped 3.2%. Americans borrow an average of $43,582 for new vehicles and $27,528 for used vehicles, according to Experian.
- Auto loan debt is the second-largest category behind mortgages. Overall, Americans owe $1.667 trillion in auto loan debt, according to the Federal Reserve Bank of New York, accounting for 8.9% of American consumer debt.
- Americans took out $180.8 billion in new auto loans in Q4 2025. By age, Americans ages 18 to 49 took out $108.1 billion in auto debt during the quarter, according to the New York Fed, compared with $72.3 billion among those 50 and older.
- Americans are taking many years to pay back their auto loans. The average auto loan term is 68.9 months for new cars, 67.7 months for used cars and 36.1 months for leased vehicles, according to Experian.
- 90-day auto loan delinquency rates are up from last year. 5.2% of outstanding auto debt was at least 90 days late in Q4 2025, according to the New York Fed, up 7.7% from Q4 2024. Meanwhile, the percentage of auto loans that fell to 30 days past due was 7.7% in Q4 2025, a 4.7% drop from Q4 2024.
- Borrowers with prime or super-prime credit scores are responsible for the majority of retail vehicle financing. Borrowers with credit scores of 661 and higher account for 69.2% of retail vehicle financing, according to Experian, versus 15.3% for subprime or deep subprime borrowers with credit scores of 600 or lower.
- The most popular vehicle models consumers considered buying on the LendingTree platform in Q4 2025 were the Ford F-150, Chevrolet Silverado 1500 and Toyota Camry. The F-150 finished No. 1 after trailing the Silverado 1500 in Q3 2025.
Average monthly car payments for all vehicles increase year over year
The average new car payment is $767 a month, according to Q4 2025 Experian data — up 2.8% year over year. The average used monthly car payment is $537, up 1.7% over the same period. Meanwhile, new lease payments average $613, a 1.5% year-over-year increase.
Annual changes in average monthly car payments
| Vehicle purchase type | 2024 avg. | 2025 avg. | Difference ($) | Difference (%) |
|---|---|---|---|---|
| New vehicle | $746 | $767 | $21 | 2.8% |
| Used vehicle | $528 | $537 | $9 | 1.7% |
| New vehicle lease | $604 | $613 | $9 | 1.5% |
Those with credit scores of 601 to 660 (in the nonprime or fair range) and 501 to 600 (in the subprime or poor and fair ranges) make the highest average monthly new vehicle payments, at $810 and $792, respectively.
Average monthly car payments by credit score range
| Credit score range | New vehicles | Used vehicles | New leased vehicles |
|---|---|---|---|
| All | $767 | $537 | $613 |
| 781 to 850 (super-prime) | $748 | $535 | $619 |
| 661 to 780 (prime) | $773 | $523 | $604 |
| 601 to 660 (nonprime) | $810 | $545 | $618 |
| 501 to 600 (subprime) | $792 | $557 | $616 |
| 300 to 500 (deep subprime) | $767 | $558 | Not available |
You can use the LendingTree auto loan calculator to estimate your monthly car payment.
New car prices increase, used car and truck prices decrease
New vehicle prices increased by 0.5% year over year, per the March 2026 BLS CPI. But the used car market was better for consumers, as used car and truck prices decreased by 3.2% year over year.
Average auto loan for new vehicles tops $43,000
Average auto loans reached $43,582 for new vehicles and $27,528 for used vehicles in Q4 2025, according to Experian. New vehicle loans rose from an average of $42,332 in the prior quarter, while used vehicle loans increased from $27,128.
New car buyers in the prime credit tier (661 to 780) take out the largest loans — $45,944, on average. Borrowers with credit scores in the highest tier — super-prime (781 to 850) — take out the most for used cars, $29,836, up from $29,172 the prior quarter.
Average auto loans by credit score range
| Credit score range | New vehicles | Used vehicles |
|---|---|---|
| All | $43,582 | $27,528 |
| 781 to 850 | $41,695 | $29,836 |
| 661 to 780 | $45,944 | $28,770 |
| 601 to 660 | $45,885 | $26,425 |
| 501 to 600 | $40,646 | $23,231 |
| 300 to 500 | $36,236 | $21,427 |
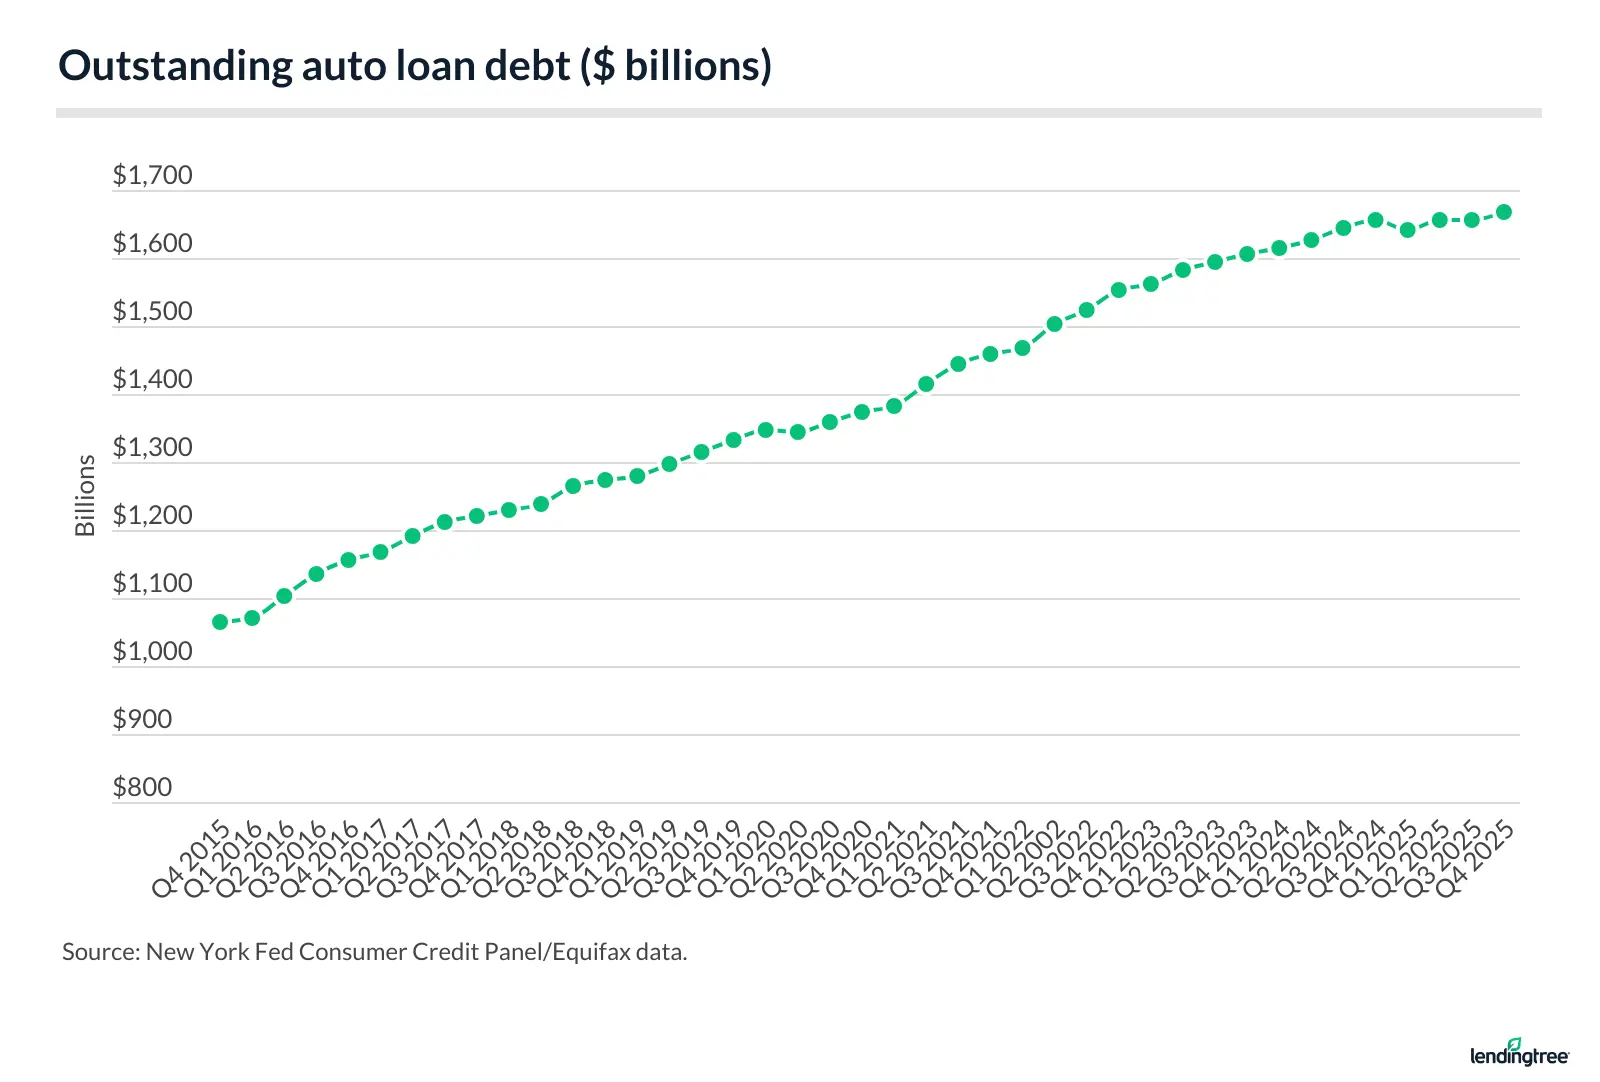
Americans owe $1.667 trillion in auto loan debt
Overall vehicle debt increased by 56.7% between Q4 2015 ($1.064 trillion) and Q4 2025 ($1.667 trillion), according to the Federal Reserve Bank of New York.
Until Q1 2025, the only dip in that period came in Q2 2020 — the first full quarter amid the pandemic. And then between Q2 and Q3 2025, overall vehicle debt didn’t change, before rising again in Q4 2025.
Outstanding auto debt
| Quarter | Outstanding auto debt (trillions) |
|---|---|
| Q4 2025 | $1.667 |
| Q3 2025 | $1.655 |
| Q2 2025 | $1.655 |
| Q1 2025 | $1.642 |
| Q4 2024 | $1.655 |
| Q3 2024 | $1.644 |
| Q2 2024 | $1.626 |
| Q1 2024 | $1.616 |
| Q4 2023 | $1.607 |
| Q3 2023 | $1.595 |
| Q2 2023 | $1.582 |
| Q1 2023 | $1.562 |
| Q4 2022 | $1.552 |
| Q3 2022 | $1.524 |
| Q2 2022 | $1.502 |
| Q1 2022 | $1.469 |
| Q4 2021 | $1.458 |
| Q3 2021 | $1.443 |
| Q2 2021 | $1.415 |
| Q1 2021 | $1.382 |
| Q4 2020 | $1.374 |
| Q3 2020 | $1.360 |
| Q2 2020 | $1.343 |
| Q1 2020 | $1.346 |
| Q4 2019 | $1.331 |
| Q3 2019 | $1.315 |
| Q2 2019 | $1.297 |
| Q1 2019 | $1.280 |
| Q4 2018 | $1.274 |
| Q3 2018 | $1.265 |
| Q2 2018 | $1.238 |
| Q1 2018 | $1.229 |
| Q4 2017 | $1.221 |
| Q3 2017 | $1.213 |
| Q2 2017 | $1.190 |
| Q1 2017 | $1.167 |
| Q4 2016 | $1.157 |
| Q3 2016 | $1.135 |
| Q2 2016 | $1.103 |
| Q1 2016 | $1.071 |
| Q4 2015 | $1.064 |
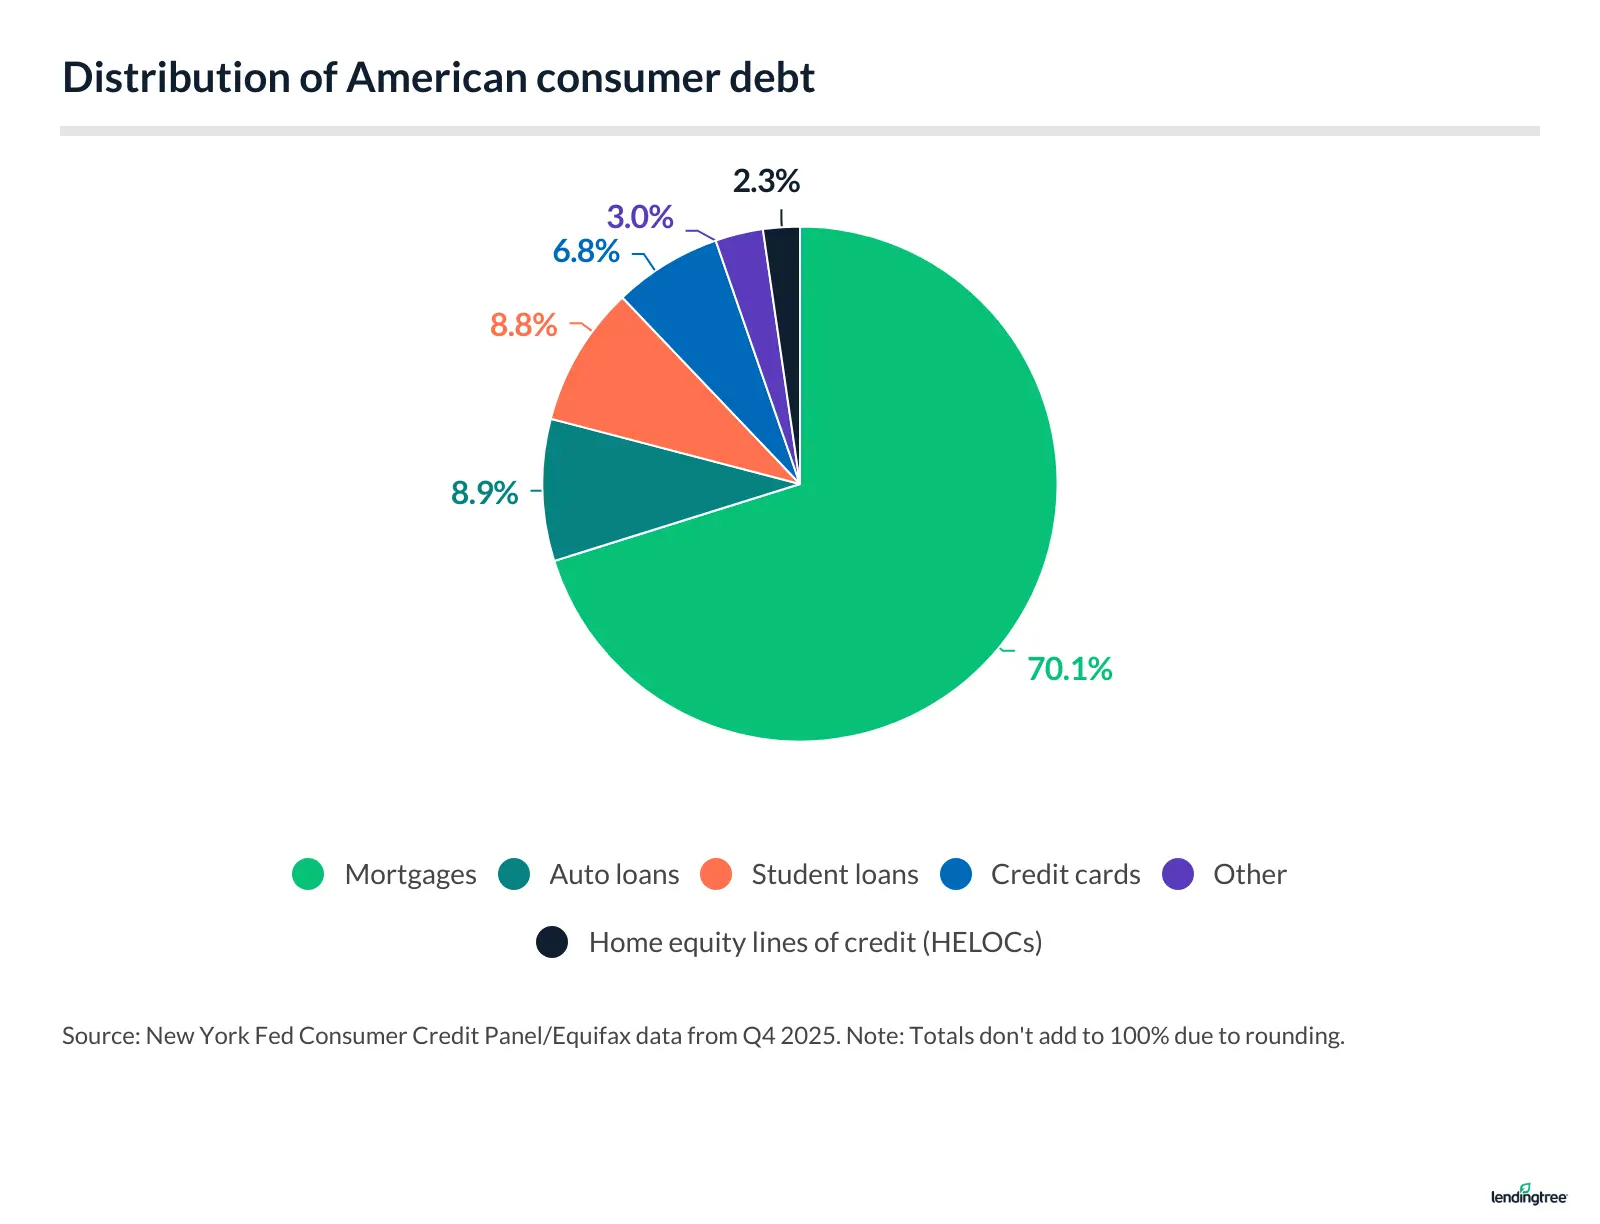
Auto loans account for 8.9% of American consumer debt
While mortgages take the lion’s share of American consumer debt at 70.1% — according to the New York Fed — auto loans account for 8.9%. Auto loan debt ($1.667 trillion) is slightly ahead of student loan debt ($1.664 trillion) as of Q4 2025.
Americans borrow $180.8 billion in Q4 2025
Americans took out $131.5 billion in auto loans in Q4 2015. Ten years later in Q4 2025, they borrowed far more: $180.8 billion, according to the New York Fed.
Here’s a quarterly look during this period:
Quarterly volume of auto loan originations
| Quarter | Auto loan originations (billions) |
|---|---|
| Q4 2025 | $180.8 |
| Q3 2025 | $183.9 |
| Q2 2025 | $187.9 |
| Q1 2025 | $165.6 |
| Q4 2024 | $175.1 |
| Q3 2024 | $184.2 |
| Q2 2024 | $179.1 |
| Q1 2024 | $165.5 |
| Q4 2023 | $164.9 |
| Q3 2023 | $179.3 |
| Q2 2023 | $179.0 |
| Q1 2023 | $161.7 |
| Q4 2022 | $186.2 |
| Q3 2022 | $185.4 |
| Q2 2022 | $198.8 |
| Q1 2022 | $176.6 |
| Q4 2021 | $180.5 |
| Q3 2021 | $198.8 |
| Q2 2021 | $201.9 |
| Q1 2021 | $152.7 |
| Q4 2020 | $161.6 |
| Q3 2020 | $168.2 |
| Q2 2020 | $135.9 |
| Q1 2020 | $150.3 |
| Q4 2019 | $158.6 |
| Q3 2019 | $159.1 |
| Q2 2019 | $155.6 |
| Q1 2019 | $139.1 |
| Q4 2018 | $144.3 |
| Q3 2018 | $157.6 |
| Q2 2018 | $151.2 |
| Q1 2018 | $130.9 |
| Q4 2017 | $137.2 |
| Q3 2017 | $150.6 |
| Q2 2017 | $148.4 |
| Q1 2017 | $132.4 |
| Q4 2016 | $142.0 |
| Q3 2016 | $149.8 |
| Q2 2016 | $148.9 |
| Q1 2016 | $123.9 |
| Q4 2015 | $131.5 |
Americans in their 30s, 40s take out the biggest auto loans
Americans in their 30s and 40s took out the largest auto loans in Q4 2025, according to the New York Fed, borrowing $39.4 billion and $41.0 billion, respectively.
Those in their 50s borrowed billions less ($33.3 billion), and those in their 60s borrowed $25.2 billion. Young adults 18 to 29 borrowed more ($27.7 billion) than consumers in their 60s.
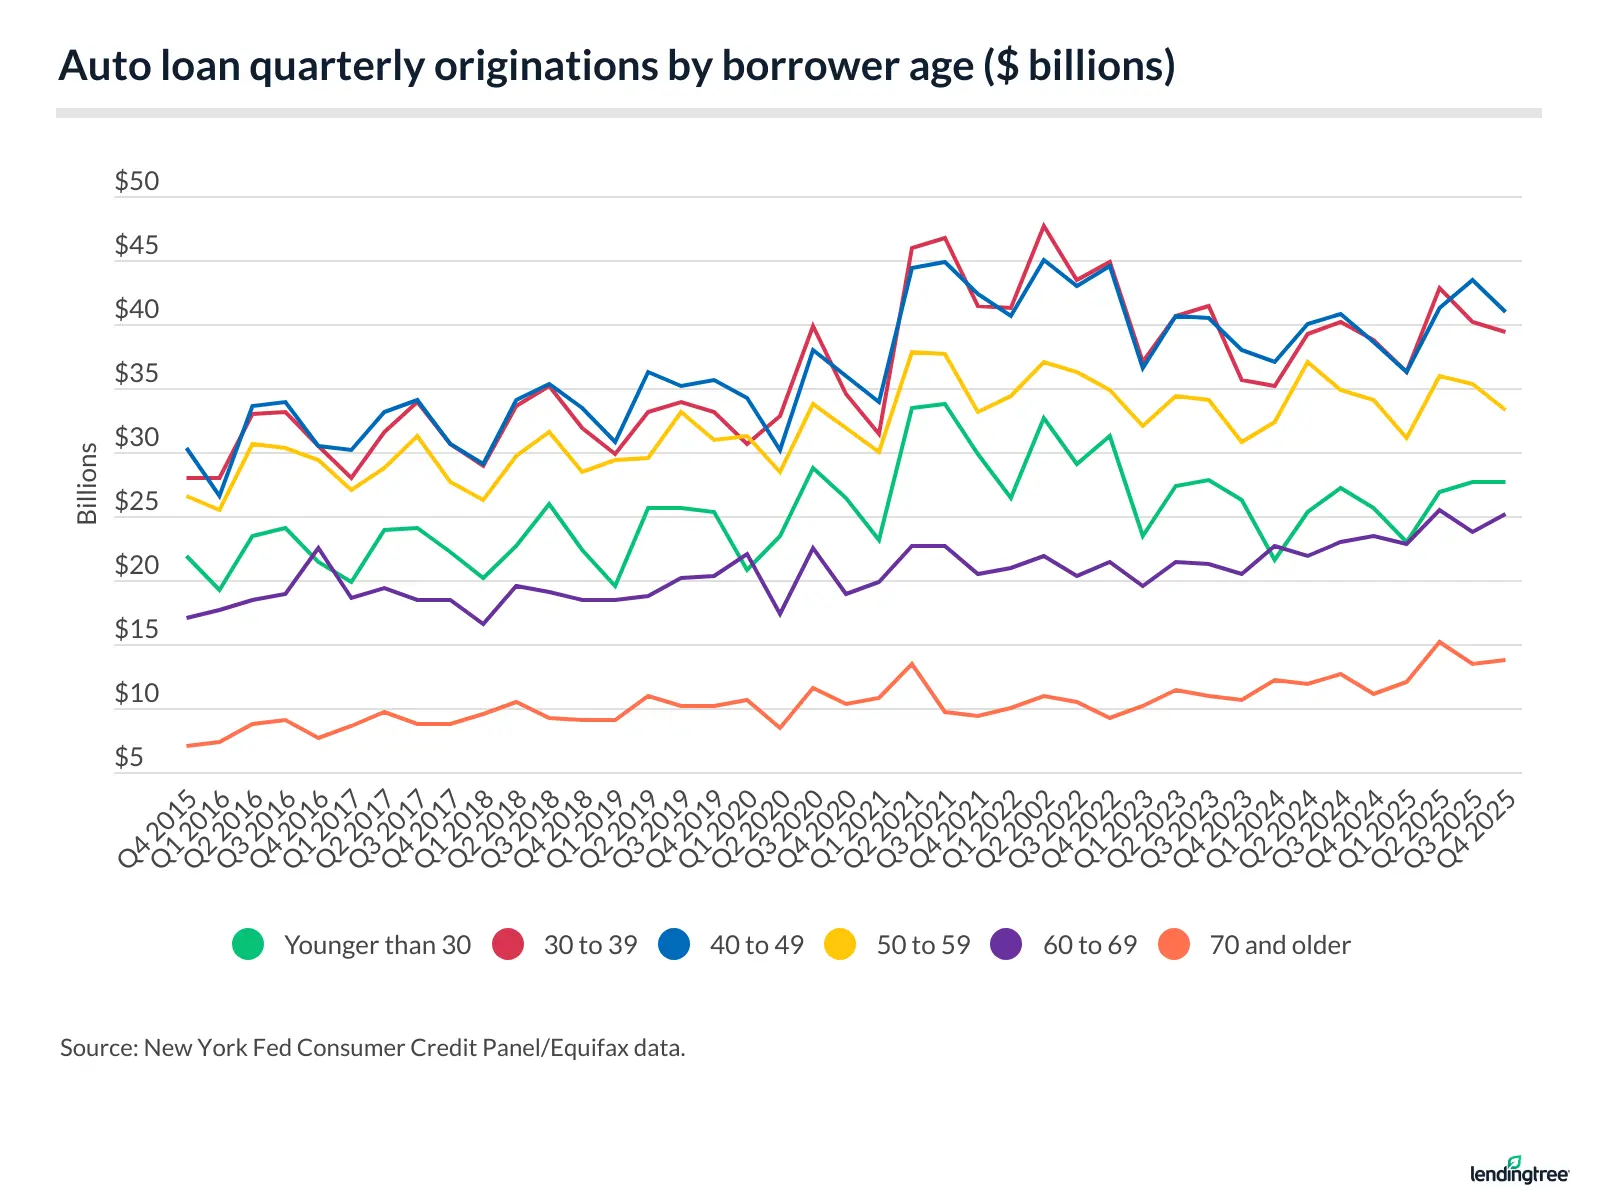
When combined, Americans ages 18 to 49 took out $108.1 billion in auto debt in Q4 2025. That compares with $72.3 billion for those 50 and older.
Americans with the highest credit scores take out the biggest auto loans
Meanwhile, those with the best credit scores borrow the most. In Q4 2025, borrowers with credit scores of at least 720 took out $94.3 billion in auto loan debt. The remaining credit tiers accounted for $86.6 billion combined, according to the New York Fed.
Auto loan originations by credit score
| Quarter | Less than 620 | 620 to 659 | 660 to 719 | 720 to 759 | 760+ |
|---|---|---|---|---|---|
| Q4 2024 | $28.3 billion | $17.2 billion | $36.2 billion | $27.7 billion | $65.7 billion |
| Q1 2025 | $25.7 billion | $14.0 billion | $32.9 billion | $24.8 billion | $68.1 billion |
| Q2 2025 | $30.4 billion | $17.7 billion | $36.1 billion | $28.6 billion | $75.1 billion |
| Q3 2025 | $27.6 billion | $17.5 billion | $35.8 billion | $29.6 billion | $73.4 billion |
| Q4 2025 | $31.8 billion | $17.5 billion | $37.3 billion | $26.2 billion | $68.1 billion |
Average auto loan terms show it’s taking time to pay back these loans
The average auto loan term for new vehicles is 68.9 months, or less than six years, according to Experian. Used car loans, despite being significantly smaller on average, are close behind at 67.7 months.
Average term lengths by credit score range
| Credit score range | New vehicle loans | Used vehicle loans | New leased vehicles |
|---|---|---|---|
| All | 68.9 | 67.7 | 36.1 |
| 781 to 850 | 64.5 | 66.0 | 35.6 |
| 661 to 780 | 72.0 | 68.8 | 36.4 |
| 601 to 660 | 75.1 | 68.6 | 37.1 |
| 501 to 600 | 74.3 | 66.9 | 37.0 |
| 300 to 500 | 73.1 | 65.3 | Not available |
But auto loans for new vehicles are stretching even longer — topping six years — for nonprime borrowers. Middle-tier credit borrowers with scores of 601 to 660 take out the longest new car loans, at an average of 75.1 months. Top-tier credit borrowers with scores of 781 to 850 have the shortest average new car loan term, at 64.5 months.
“That’s such a long time to be stuck paying for a depreciating asset,” LendingTree chief consumer finance analyst Matt Schulz says. “It can have an enormous impact on a family’s finances. That money going toward a car payment isn’t earning interest and funding your emergency savings, your retirement nest egg, a mortgage down payment or your kid’s college fund. Yes, our vehicles are important. In much of the country, you can’t get around without one. And, yes, we love fancy new cars, even new-to-us cars. They’re fun to drive and show off. However, once that initial glow wears off and you’re still making a big monthly payment on that vehicle after five-plus years, it may not seem worth it.”
The average new car lease term is 36.1 months.
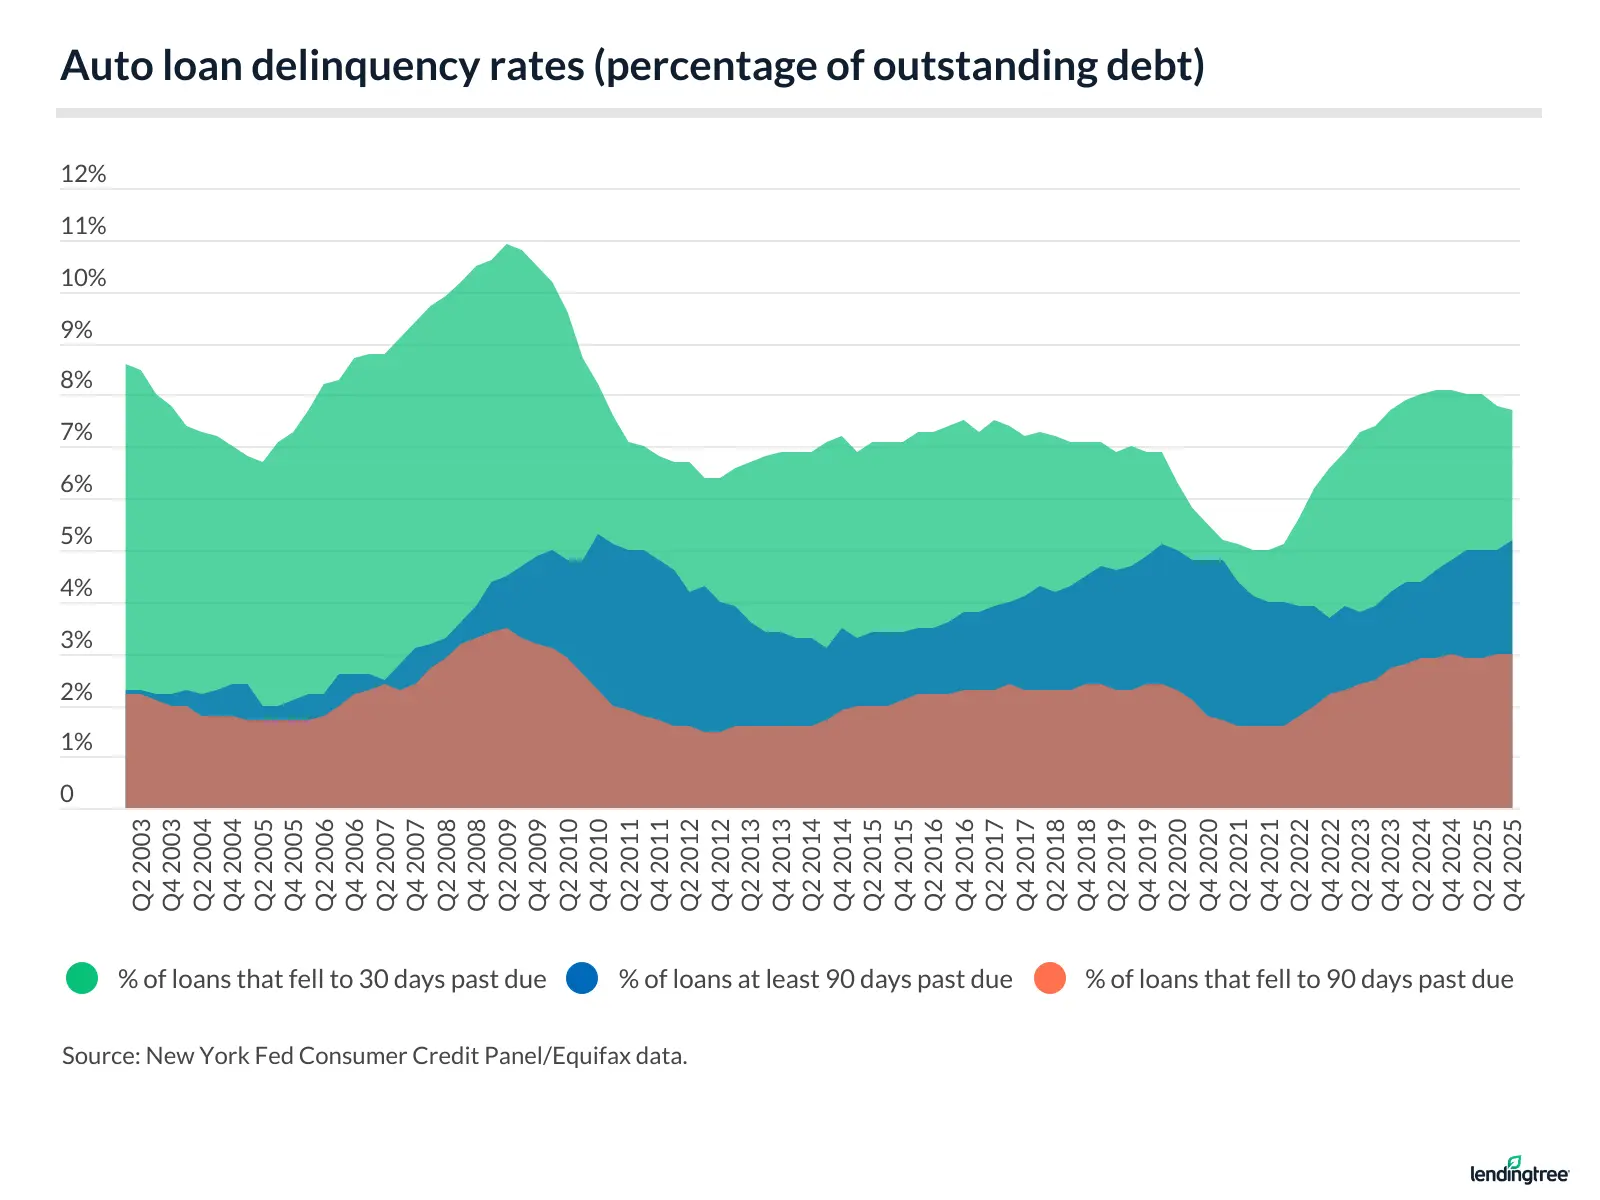
90-day auto loan delinquency rate still below peak — but barely
According to data from the New York Fed, 90-day delinquency rates on auto loans peaked in Q4 2010 at 5.3%. Delinquency rates are near that peak again, at 5.2% as of Q4 2025.
The percentage of auto loans that fell to 30 days past due spiked to 10.9% in Q2 2009. Dating to 2011, it remained at or below 8.0% until it rose to 8.1% in Q3 and Q4 2024, before falling back to 8.0% in Q1 and Q2 2025 and now 7.7% in Q4 2025.
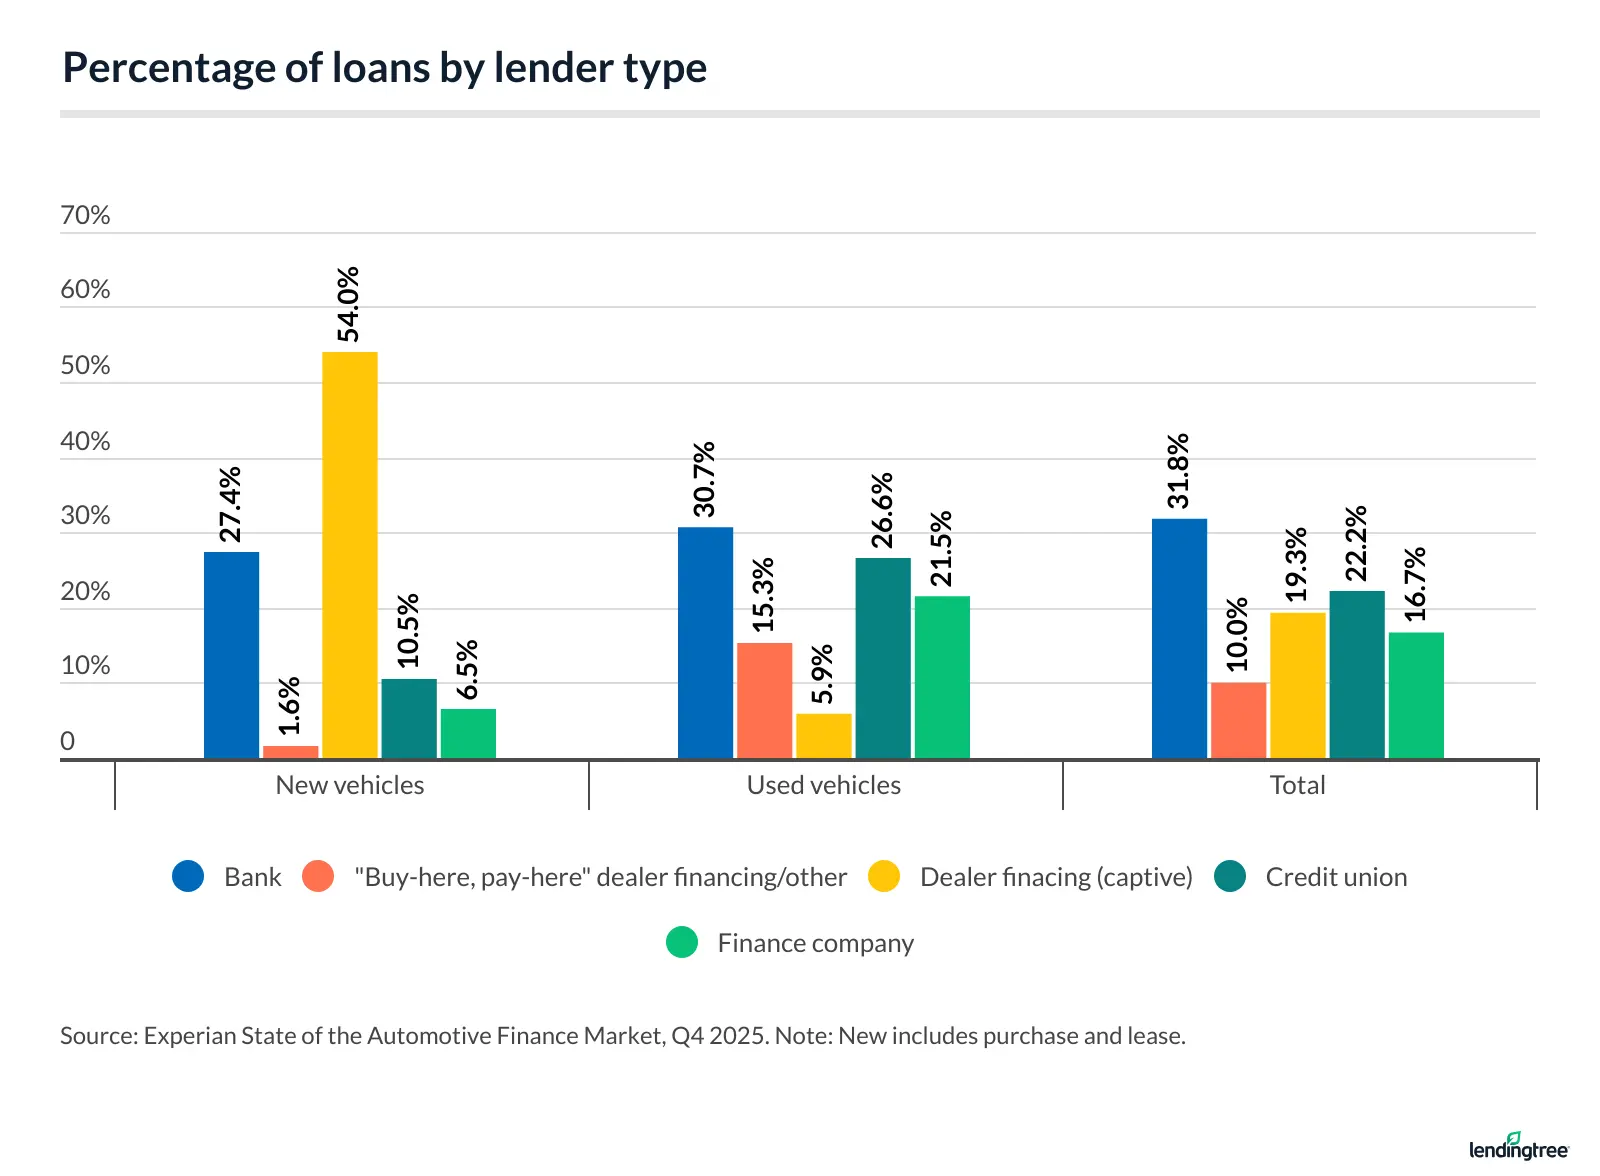
Buyers turn to banks, credit unions the most for auto financing
As of Q4 2025, banks hold the highest market share, at 31.8%, followed by credit unions at 22.2% and captive lenders (manufacturers’ financing arms) at 19.3%.
“Buy-here, pay-here” businesses, often known for predatory lending practices, capture up to 15.3% of the used car financing market. In the used car arena, captive lenders only claim 5.9%.
Schulz warns that buy-here, pay-here loans are dangerous. Not only can the sticker price be bigger, but the interest rates can look more like credit card rates than typical auto loan rates, and there may be extra fees. Also, there may be an unusual payment schedule requiring you to pay more often than the typical monthly payment. Some places might even require you to put a tracking device on the car to make it easier to take back if you fall behind on payments.
In short, these should be among the last options you’d consider, but your credit score plays a role in what options are available to you.
“Good credit means more good options, and that’s a big deal,” Schulz says. “You must shop around. If you finance through the car seller, you’re very likely to overpay. Use sites to compare auto loan offers easily. You could also visit multiple lenders online on your own — consider looking at credit unions if you do. Once you’ve found a deal you’re happy with, get preapproved by the lender. That preapproval gives you leverage over the car seller because they know you won’t be happy with a bad offer.”
Sources
- Experian
- U.S. Bureau of Labor Statistics
- Federal Reserve Bank of New York
- LendingTree
Get auto loan offers from up to 5 lenders in minutes