Nearly 1 in 10 Auto Loan Borrowers Have a $1,000 Car Payment


A four-figure monthly car payment may sound like a nightmare to some borrowers, but it’s an increasingly common reality for many across the U.S. According to LendingTree research, nearly 1 in 10 (9.6%) Americans with active auto loans in the fourth quarter of 2025 had at least one monthly payment of $1,000 or more — equivalent to 14.0% of the median household income of $7,147 a month.
We further analyzed high car payments by state and by generation. The full findings follow below.
- $1,000 car payments aren’t uncommon. In Q4 2025, 9.6% of Americans with active auto loans had at least one monthly payment of $1,000 or more. That’s equivalent to 14.0% of the median household income, which is $7,147 a month.
- High car payments are most common in Texas. In the Lone Star State, 14.9% of borrowers with active auto loans have at least one monthly payment that’s $1,000-plus. That’s ahead of Alaska at 13.3% and Wyoming at 12.2%. Overall, 16 states have shares of at least 10.0%.
- Four-figure car payments are least common in the Northeast and Midwest. Rhode Island has the lowest share of $1,000-plus monthly payments at 4.4%, followed by Maine at 5.7% and Pennsylvania at 6.0%. Most of the lowest-ranking states are clustered in these two regions.
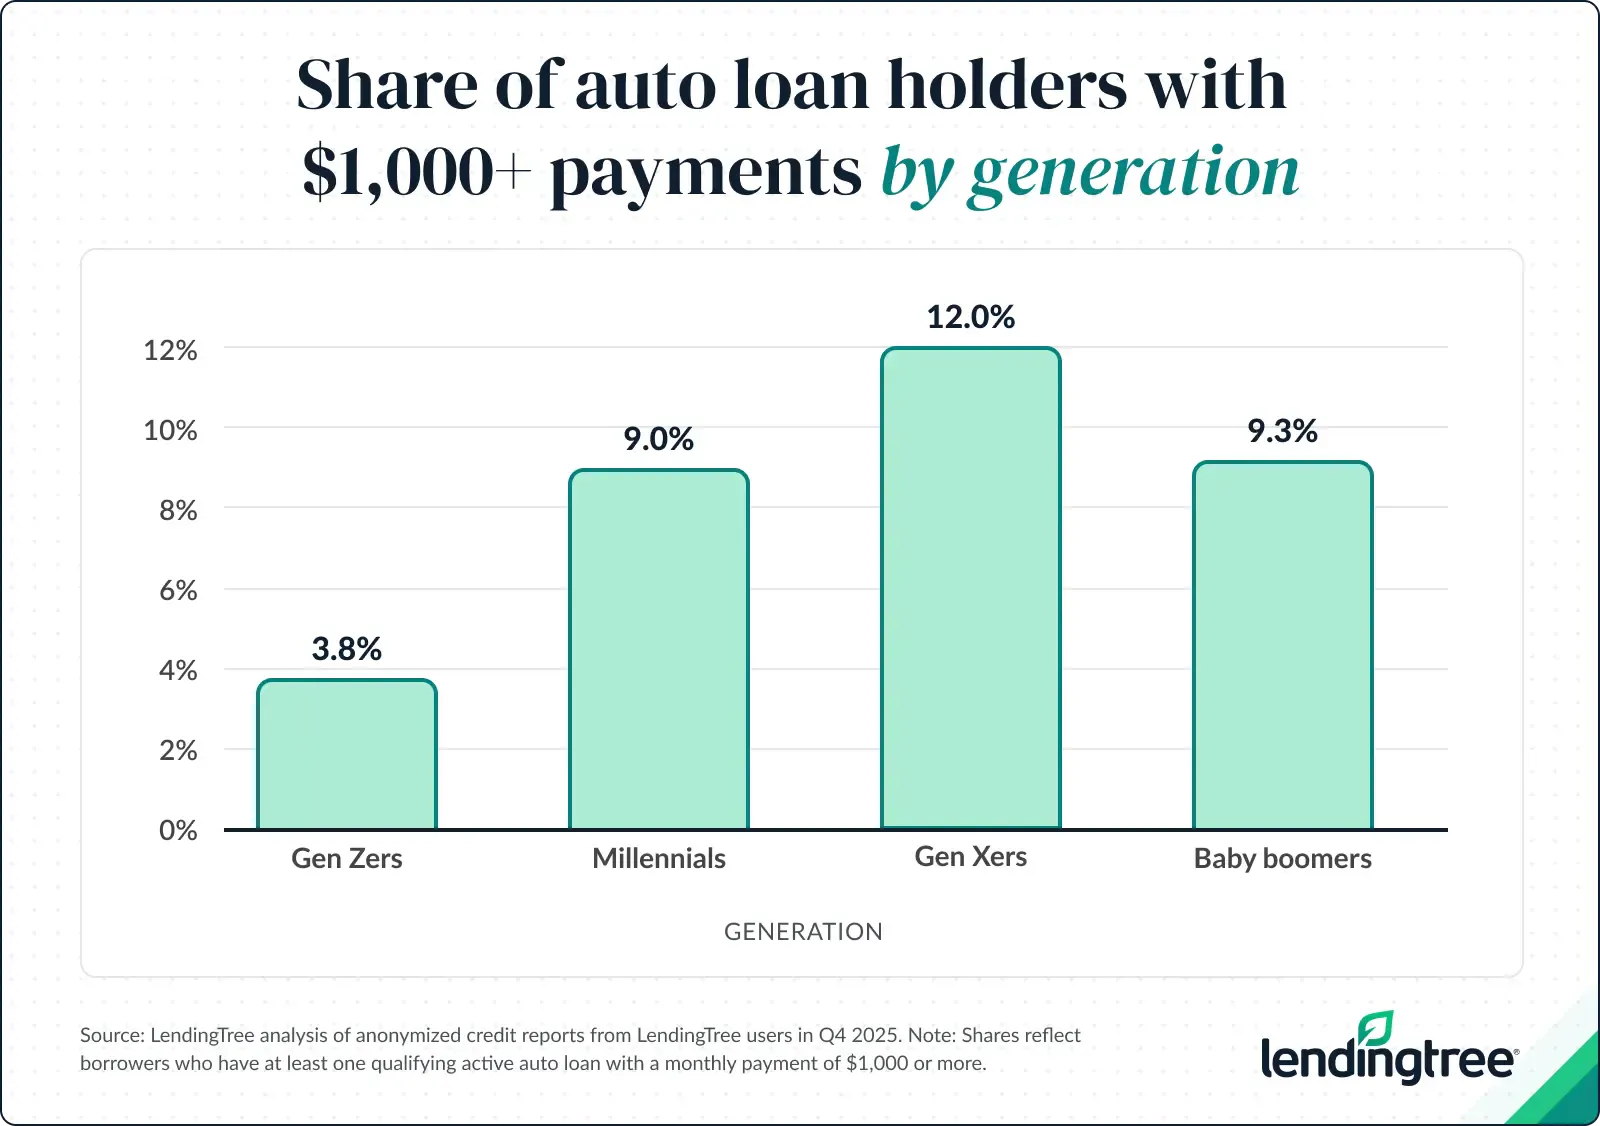
- Gen Xers are the generation most likely to have a $1,000 car payment. Among borrowers with active auto loans, 12.0% of Gen Xers have at least one monthly payment at that level. That compares with 9.3% of baby boomers, 9.0% of millennials and 3.8% of Gen Zers.
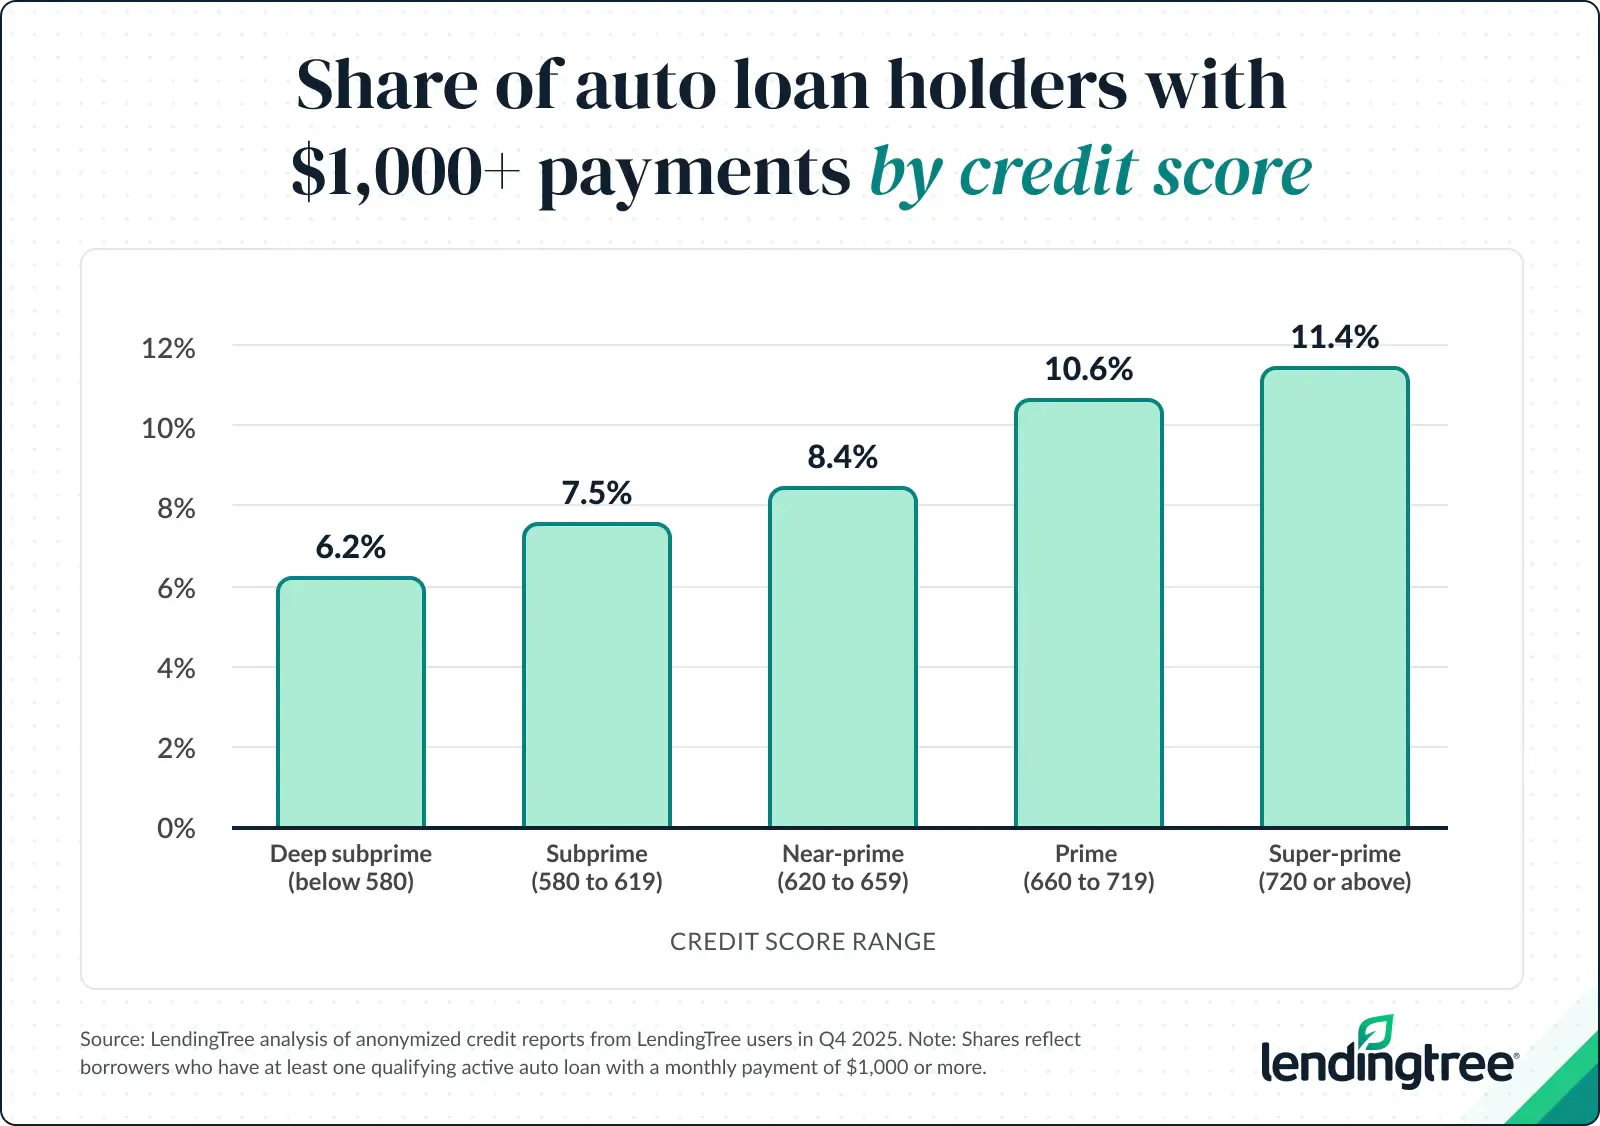
- Higher credit scores are linked to larger monthly auto payments. Borrowers with super-prime credit scores of 720 or higher are the most likely to have a $1,000-plus monthly payment, at 11.4%. That falls to 10.6% among prime borrowers with scores of 660 to 719 and to 6.2% among deep subprime borrowers with scores below 580.
9.6% of Americans with auto loans have $1,000 car payments
In the fourth quarter of 2025, almost a tenth of U.S. borrowers with active auto loans — 9.6% — carried at least one four-figure monthly car payment. That’s up from 8.6% of Americans in the first quarter of 2025.
Cars have been steadily getting more expensive for years, thanks to the increasing inclusion of complex computer technology in passenger vehicles, and — more recently — policy changes. At the end of Q1 2025, President Donald Trump imposed a 25% tariff on imported cars and certain imported car parts. Although the order was soon scaled back, automakers continue to feel the financial pinch.
Those factors may help explain why such staggering car payments are “probably only going to get more common,” says Matt Schulz, LendingTree chief consumer finance analyst and author of “Ask Questions, Save Money, Make More: How to Take Control of Your Financial Life.”
“A $1,000 car payment is really, really high, but many Americans are clearly willing to take them on,” he says. “In much of this country, you can’t get by without a vehicle.”
But preference is also at play, Schulz says. “This isn’t just about what people need. It’s also about what they want, and Americans love their vehicles. That passion for cars, trucks and SUVs drives a whole lot of spending, too.”
An auto payment of $1,000 represents 14.0% of the median household income of $7,147 a month. And that’s gross income, before accounting for taxes.
Texas has the highest rate of four-figure car payments
While high auto payments are on the rise across the country, they’re more common in some states than others. Leading the pack: the Lone Star State. In Texas, 14.9% of borrowers with active auto loans have at least one $1,000-plus monthly payment, followed by Alaska (13.3%) and Wyoming (12.2%).
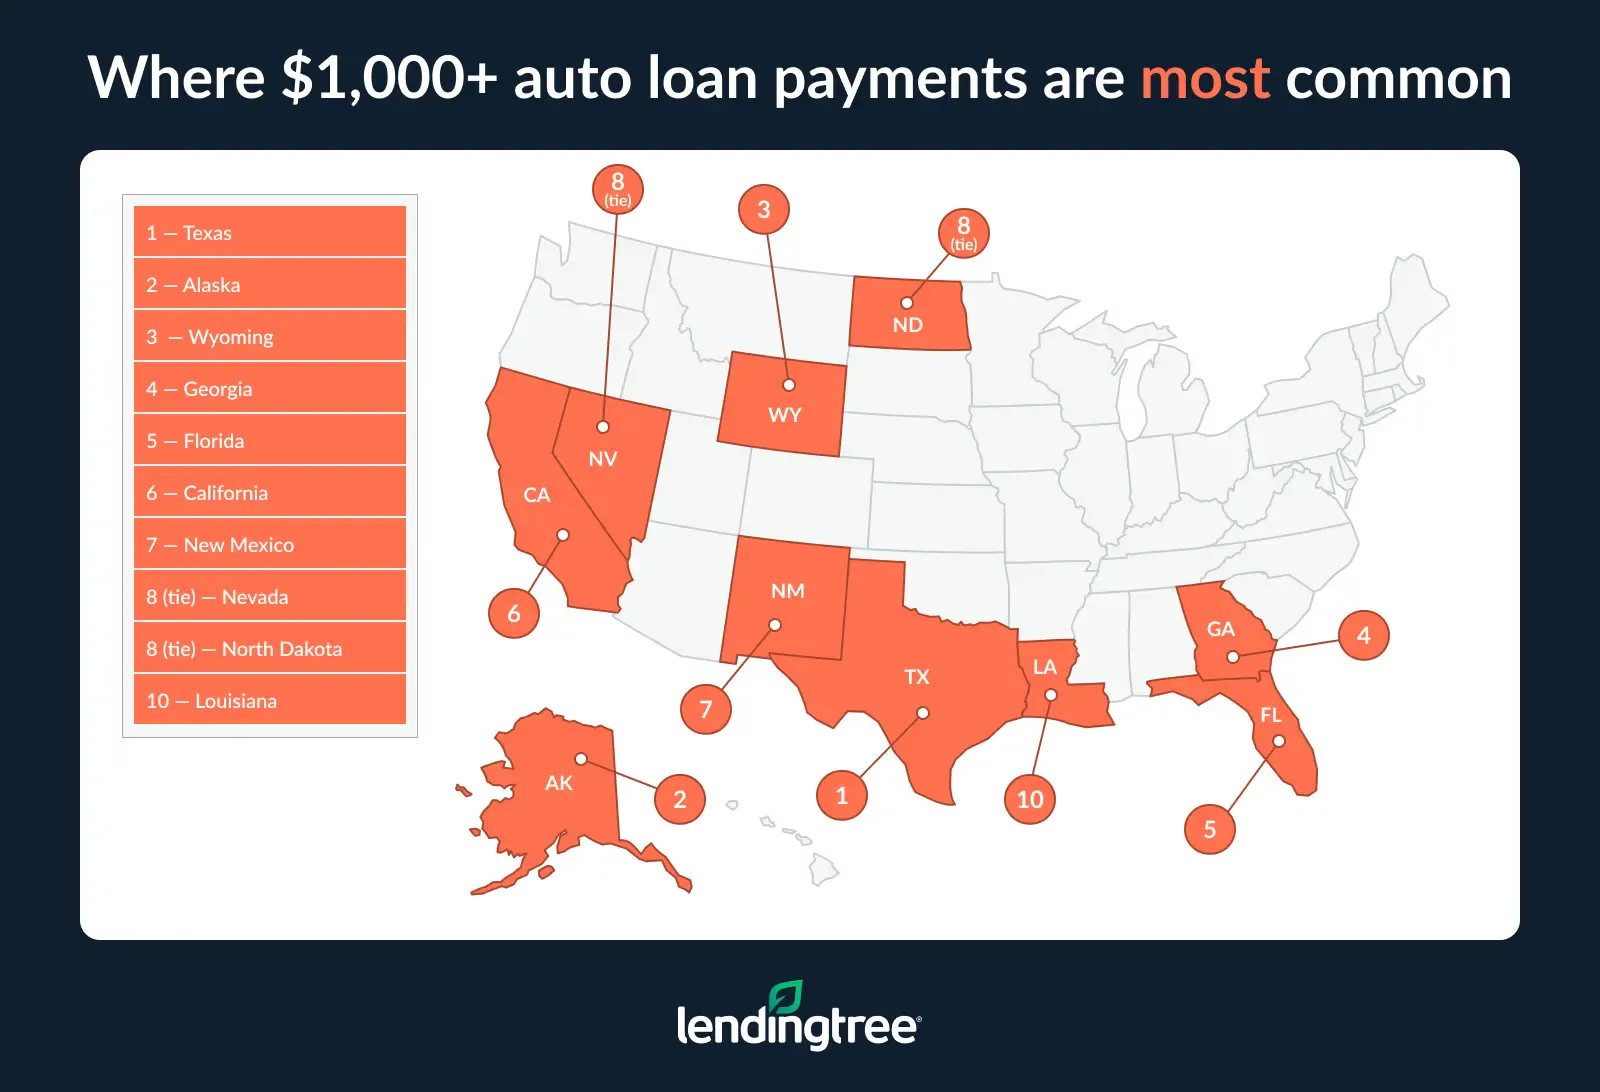
The geographic distribution of high rates of four-figure payments in the South and West may be due to the more rural nature of many of these states. It may make more sense to have a large pickup truck or SUV in Texas, Alaska or New Mexico, for example, than in New York City. Larger, more powerful vehicles also tend to cost more than sedans, with the exception of luxury brands. (Notably, Texas had the highest proportion of $1,000-plus auto loans in last year’s analysis, too, followed by Nevada and then Wyoming and Georgia, which tied for third.)
Additionally, $1,000 represents a different proportion of the median monthly household income in each state.
In Mississippi, the state with the lowest median monthly household income, that kind of payment would take the largest chunk out of a household’s income, at 19.3% of the median earnings of $5,187 a month. Still, though, 9.3% of borrowers in the state hold such high-payment auto loans.
Next is West Virginia, where a $1,000 monthly car payment accounts for 18.8% of the median $5,333 household income. That’s followed by Louisiana (18.7%, or $5,350).
These figures are “troubling,” says Schulz, especially since they don’t even factor in other car ownership costs like insurance, maintenance or fuel.
“If you’re putting that much of your income into a car payment, it means you’re likely not putting enough of your income toward building an emergency fund, investing for retirement, saving for a mortgage down payment or other long-term financial goals,” Schulz explains. “It shrinks your financial margin for error in a major way, and that’s the last thing people need today.”
Northeast and Midwest borrowers least likely to carry $1,000 car payments
Meanwhile, states where $1,000 car payments remain relatively uncommon seem to be clustered in the Northeast and Midwest.
Rhode Islanders are the least likely to carry such high car payments: Only 4.4% of active borrowers there do. Maine is second in this regard, with 5.7% of its active borrowers paying at least one $1,000 car payment per month, followed by Pennsylvania at 6.0%. (The same three states ranked in the same order for this metric during our last analysis, though only Rhode Island has seen a decrease from last year’s 4.8% figure.)
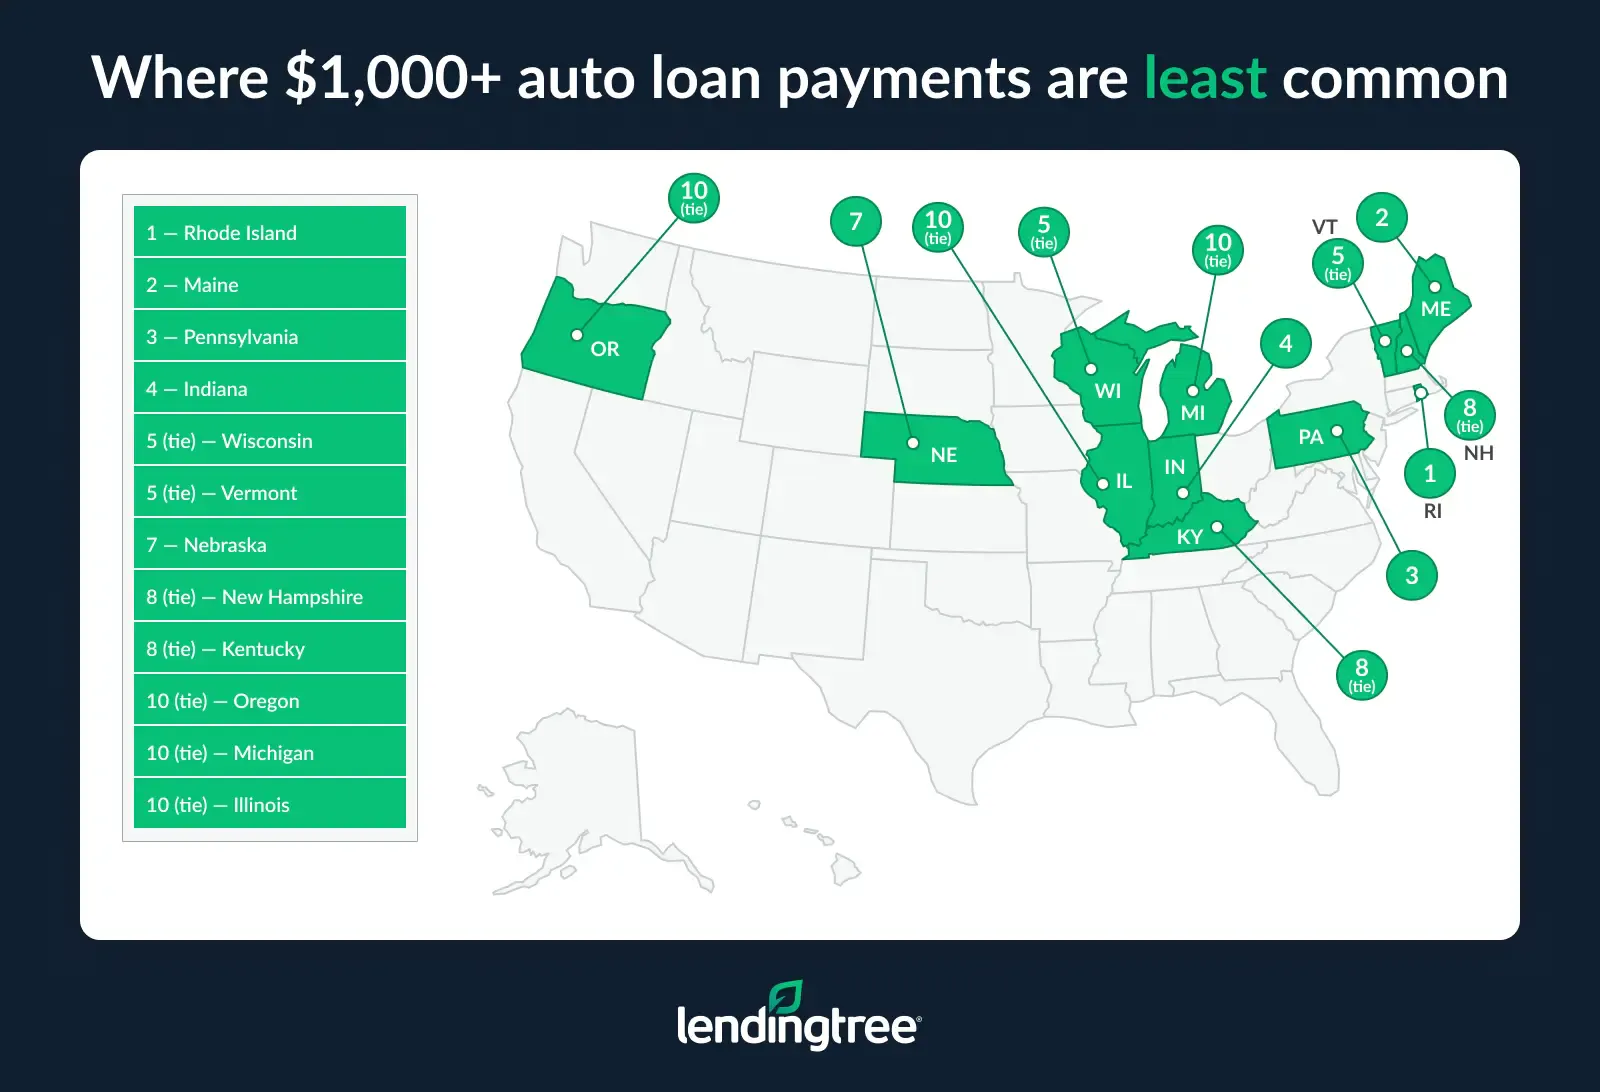
Given that Rhode Island is the smallest state in the country, it makes sense that its residents may simply not need to drive as far as often. And, again, Northeastern states tend to have population centers that are more closely clustered together than those in the South and West, where bigger and more luxurious (and therefore more expensive) vehicles may make longer or more rugged drives comfortable.
Many Northeastern states and territories also tend to have higher median monthly household incomes, which means sky-high car payments represent a smaller total slice of their budget. A $1,000 payment takes up the smallest share of median monthly household income in the District of Columbia, for example, at 10.4%, with New Jersey and Massachusetts tying for second at 10.9%.
Full rankings: Where $1,000+ auto loan payments are most/least common
| Rank | State | Share of auto loan holders |
|---|---|---|
| 1 | Texas | 14.9% |
| 2 | Alaska | 13.3% |
| 3 | Wyoming | 12.2% |
| 4 | Georgia | 12.0% |
| 5 | Florida | 11.9% |
| 6 | California | 11.5% |
| 7 | New Mexico | 11.2% |
| 8 | Nevada | 11.1% |
| 8 | North Dakota | 11.1% |
| 10 | Louisiana | 10.7% |
| 11 | Montana | 10.5% |
| 12 | Colorado | 10.4% |
| 13 | Maryland | 10.3% |
| 14 | Washington | 10.2% |
| 15 | Idaho | 10.1% |
| 16 | Utah | 10.0% |
| 17 | Arizona | 9.9% |
| 17 | Hawaii | 9.9% |
| 17 | New Jersey | 9.9% |
| 20 | Virginia | 9.4% |
| 21 | Mississippi | 9.3% |
| 21 | New York | 9.3% |
| 23 | Arkansas | 9.2% |
| 24 | Alabama | 8.9% |
| 25 | Tennessee | 8.6% |
| 26 | Iowa | 8.5% |
| 26 | North Carolina | 8.5% |
| 26 | Oklahoma | 8.5% |
| 29 | South Carolina | 8.4% |
| 30 | South Dakota | 8.3% |
| 31 | District of Columbia | 8.2% |
| 32 | West Virginia | 8.0% |
| 33 | Minnesota | 7.9% |
| 34 | Connecticut | 7.8% |
| 34 | Kansas | 7.8% |
| 34 | Missouri | 7.8% |
| 37 | Delaware | 7.6% |
| 38 | Ohio | 7.2% |
| 39 | Massachusetts | 7.1% |
| 40 | Illinois | 7.0% |
| 40 | Michigan | 7.0% |
| 40 | Oregon | 7.0% |
| 43 | Kentucky | 6.8% |
| 43 | New Hampshire | 6.8% |
| 45 | Nebraska | 6.5% |
| 46 | Vermont | 6.4% |
| 46 | Wisconsin | 6.4% |
| 48 | Indiana | 6.2% |
| 49 | Pennsylvania | 6.0% |
| 50 | Maine | 5.7% |
| 51 | Rhode Island | 4.4% |
Full rankings: States where a $1,000 monthly payment takes up the biggest/smallest share of monthly median household income
| Rank | State | Median household income | $1,000 payment as % of income |
|---|---|---|---|
| 1 | Mississippi | $5,187 | 19.3% |
| 2 | West Virginia | $5,333 | 18.8% |
| 3 | Louisiana | $5,350 | 18.7% |
| 4 | Arkansas | $5,448 | 18.4% |
| 5 | Kentucky | $5,660 | 17.7% |
| 6 | Oklahoma | $5,803 | 17.2% |
| 7 | Alabama | $5,848 | 17.1% |
| 8 | New Mexico | $5,949 | 16.8% |
| 9 | Missouri | $6,280 | 15.9% |
| 10 | Indiana | $6,312 | 15.8% |
| 10 | Tennessee | $6,316 | 15.8% |
| 10 | Ohio | $6,335 | 15.8% |
| 10 | South Carolina | $6,347 | 15.8% |
| 14 | Michigan | $6,350 | 15.7% |
| 15 | North Carolina | $6,488 | 15.4% |
| 16 | Montana | $6,609 | 15.1% |
| 16 | Iowa | $6,623 | 15.1% |
| 16 | Kansas | $6,624 | 15.1% |
| 16 | Wyoming | $6,626 | 15.1% |
| 20 | Nebraska | $6,700 | 14.9% |
| 20 | Maine | $6,706 | 14.9% |
| 22 | South Dakota | $6,744 | 14.8% |
| 23 | Wisconsin | $6,797 | 14.7% |
| 23 | Pennsylvania | $6,802 | 14.7% |
| 23 | Florida | $6,819 | 14.7% |
| 26 | North Dakota | $6,831 | 14.6% |
| 27 | Texas | $6,993 | 14.3% |
| 27 | Georgia | $7,017 | 14.3% |
| 29 | Nevada | $7,117 | 14.1% |
| 30 | Idaho | $7,120 | 14.0% |
| 30 | Arizona | $7,148 | 14.0% |
| 32 | Vermont | $7,257 | 13.8% |
| 33 | Illinois | $7,300 | 13.7% |
| 33 | Rhode Island | $7,325 | 13.7% |
| 35 | Oregon | $7,476 | 13.4% |
| 36 | New York | $7,528 | 13.3% |
| 37 | Minnesota | $7,642 | 13.1% |
| 38 | Delaware | $7,679 | 13.0% |
| 39 | Virginia | $8,078 | 12.4% |
| 40 | Alaska | $8,392 | 11.9% |
| 40 | Connecticut | $8,426 | 11.9% |
| 42 | Utah | $8,479 | 11.8% |
| 43 | Colorado | $8,519 | 11.7% |
| 44 | Washington | $8,719 | 11.5% |
| 45 | New Hampshire | $8,753 | 11.4% |
| 45 | California | $8,785 | 11.4% |
| 47 | Hawaii | $8,838 | 11.3% |
| 48 | Maryland | $9,027 | 11.1% |
| 49 | New Jersey | $9,149 | 10.9% |
| 49 | Massachusetts | $9,196 | 10.9% |
| 51 | District of Columbia | $9,624 | 10.4% |
Gen Xers, high credit score consumers most likely to have 4-figure car payments
Along with varying by state, the share of $1,000-plus car payments also varies by generation and credit score. Gen Xers ages 45 to 60 in 2025 are the age demographic most likely to have a $1,000 car payment: 12.0% of them do, followed by baby boomers ages 61 to 79 (9.3%), millennials ages 29 to 44 (9.0%) and Gen Zers ages 18 to 28 (3.8%). Again, this lineup is exactly the same as it was in last year’s analysis, though every single age category did see a slight increase in the proportion of ultra-high car payments.
But why does the overall pattern remain consistent?
“To get a pricey loan, you have to be able to qualify for that loan,” Schulz explains. “Gen Xers, who tend to have higher credit scores than their younger counterparts and be in their prime earning years, can usually do that.”
Younger borrowers may still be in the process of getting themselves financially established, which marks them as riskier to lenders.
“However,” Schulz cautions, “just because someone will lend you money doesn’t mean that you should take it or that you can afford it.” Even for well-established Gen X borrowers, “taking on a bigger loan than you can afford puts a real squeeze on your budget and makes it harder to reach other financial goals.”
Schulz’s explanation is supported by our fifth key finding, which links higher credit scores to larger monthly auto payments. The borrowers most likely to have a $1,000-plus monthly auto payment are those with super-prime credit scores of 720 or higher — 11.4% of them do. Meanwhile, only 10.6% of prime borrowers, whose scores hover between 660 and 719, have such high auto loan payments, followed by only 6.2% of deep subprime borrowers whose scores are under 580.
“The better your credit score, the more likely you are to get a loan,” Schulz says. “If you have great credit, you may have lenders falling all over themselves to lend you as much money as you’d like. That’s not always a great thing, though. It’s incredibly important that you crunch your own numbers before you start shopping for a new vehicle, so you can understand what you can afford, regardless of what some lender might tell you.”
4 tips for managing a high car payment
Even for careful buyers, with today’s prices, it can be hard to avoid a high car payment. Here are our top expert tips on how to manage a car loan — and hopefully keep that payment as low as possible (and pay less interest over time).
- Shop by price, not by payment. “Dealers love to ask you about your monthly payment goals because it makes it easier to hide a longer loan term or higher overall cost,” Schulz says. “Focus instead on the total price of the car, interest rate and loan length so you know what you’re paying over time.”
- Don’t be fooled by ultra-long loan terms. “A six- or seven-year loan can make a payment look manageable, but you’ll usually pay a lot more in interest and could end up owing more than the car is worth for years,” Schulz explains. “Shorter terms may mean a higher payment, but they can save you serious money in the long run.”
- Buy less than you think you can afford. “It’s not the flashy advice people want to hear, but it works,” Schulz advises. “Choosing a reliable used vehicle or a lower trim level can free up hundreds of dollars a month instead of locking you into a giant payment.”
- Remember, there are ways to mitigate a too-high monthly payment. “Refinancing to a lower rate, selling the car or trading down to something cheaper may feel painful in the short term, but it can create breathing room fast,” Schulz says. “The earlier you address the problem, the more options you typically have.”
Methodology
LendingTree researchers analyzed a sample of about 180,000 anonymized credit reports of LendingTree users from Oct. 1 to Dec. 31, 2025 — the fourth quarter of 2025.
The analysis focused on users with active auto loan debts, including both individual and joint accounts. We calculated the percentage of consumers with at least one monthly auto loan payment of $1,000 or more.
The analysis was conducted nationally and by state, generation and credit score. We defined generations based on the following age groups in 2025:
- Generation Z: 18 to 28
- Millennial: 29 to 44
- Generation X: 45 to 60
- Baby boomer: 61 to 79
We defined credit score groups based on the following ranges:
- Deep subprime: Below 580
- Subprime: 580 to 619
- Near-prime: 620 to 659
- Prime: 660 to 719
- Super-prime: 720 or above
LendingTree researchers used the U.S. Census Bureau 2024 American Community Survey with one-year estimates for household income by state. Those income figures were then projected to 2026 using Bureau of Economic Analysis (BEA) personal income data accessed through Federal Reserve Economic Data (FRED).
Projected annual median household income was divided by 12 to estimate monthly median household income in each state. Researchers then calculated what share of that monthly income a $1,000 car payment would represent and ranked states based on that percentage. U.S. figures were calculated separately and shown as a national comparison.
Get auto loan offers from up to 5 lenders in minutes