Nearly 1 in 11 Miles of US Roadways Are in Poor Condition
America’s roads and bridges are showing signs of strain. While there have been modest improvements in recent years, there are large disparities by state.
Nationally, 8.9% of road miles are in poor condition, though that figure varies from 1.8% in Alabama to 31.5% in Rhode Island. Here’s a closer look at which states have seen the biggest changes in road and bridge conditions, and how these factors can impact your auto insurance.
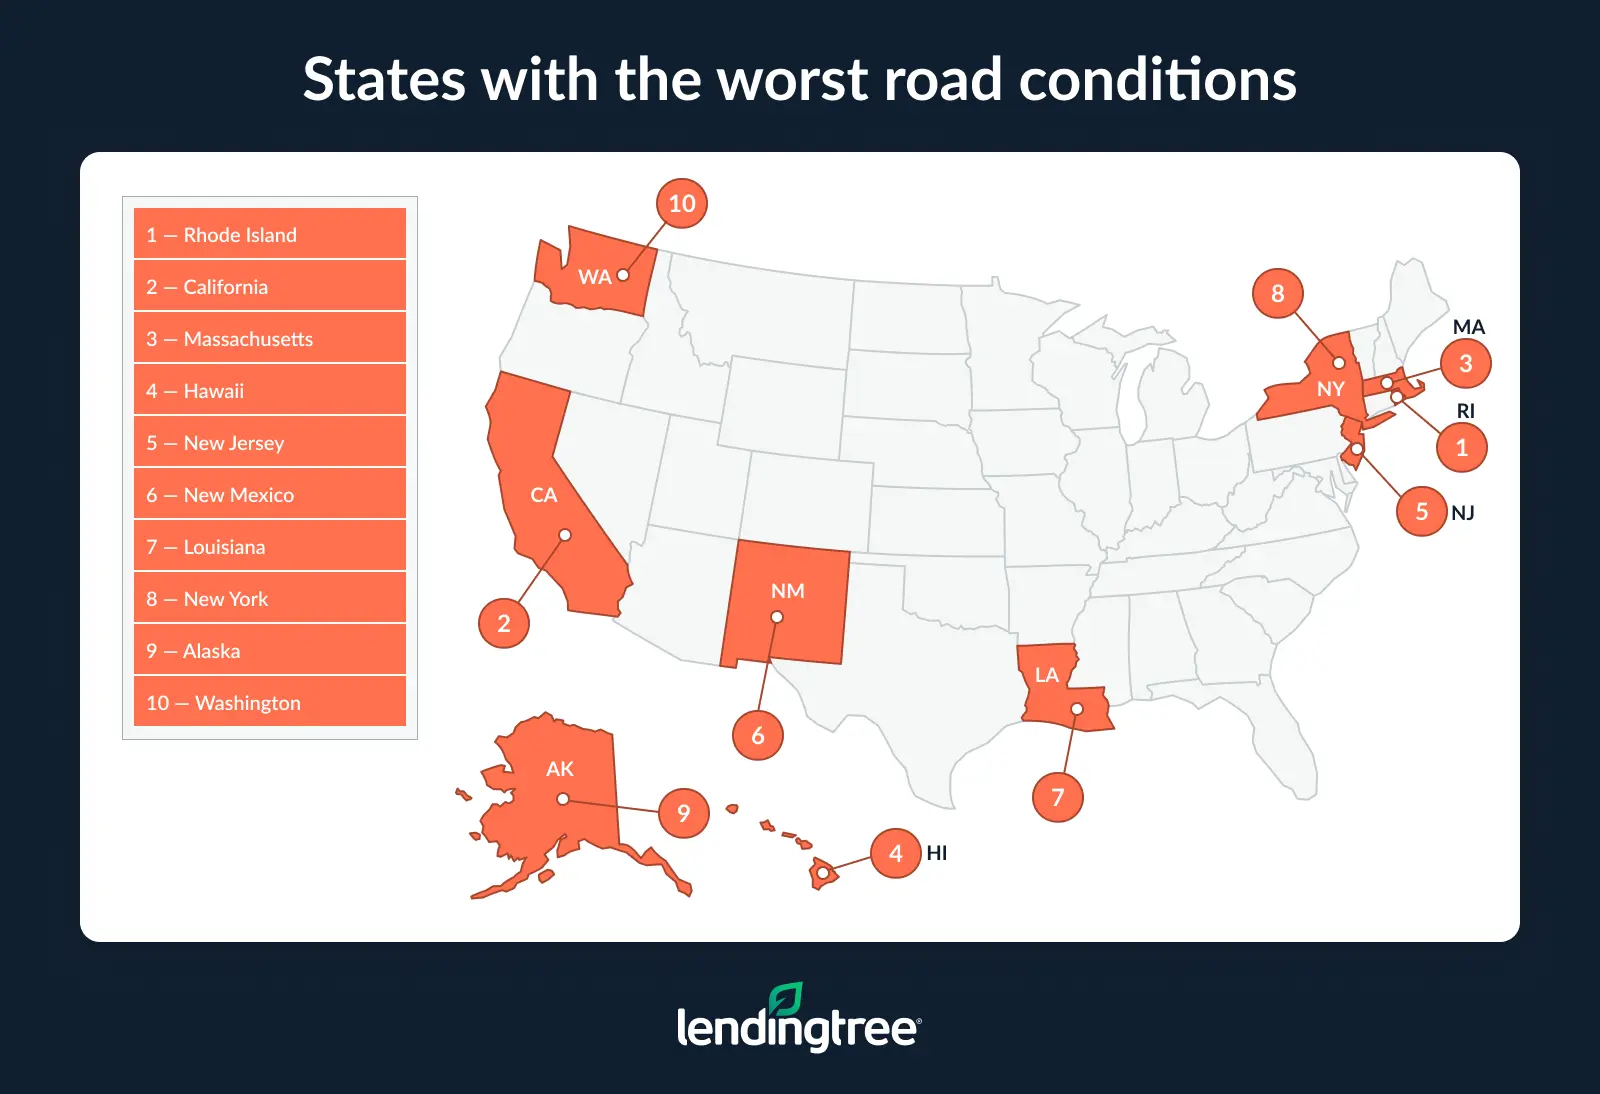
- Nearly 1 in 11 miles of U.S. roadways are in poor condition. Nationally, 8.9% of road miles are in poor condition, or 30,481 of 343,341 evaluated miles. Rhode Island is worst, with 31.5% of road miles in poor condition. California (27.0%) and Massachusetts (24.5%) follow.
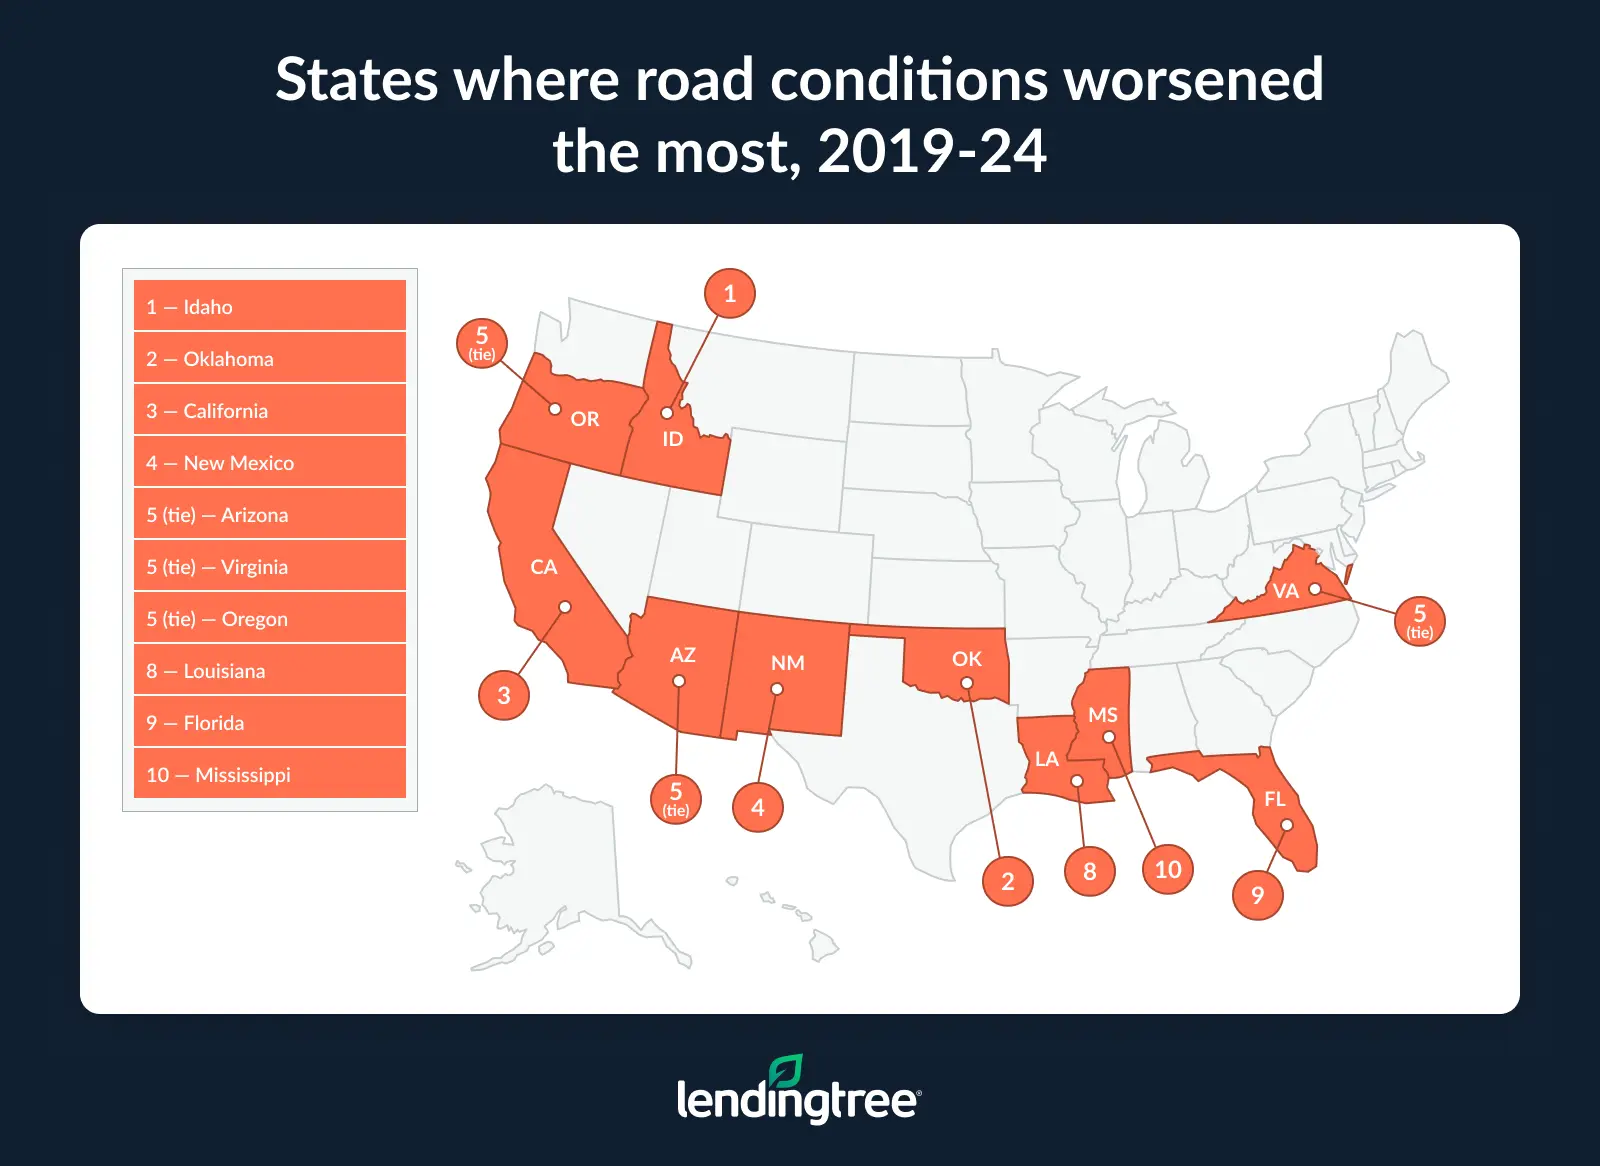
- Nationwide, road conditions improved slightly from 2019 to 2024, though some states worsened. The share of U.S. road miles in poor condition fell from 9.2% to 8.9%. However, Idaho saw road conditions worsen the most, with a 68.6% increase in the share of road miles in poor condition. Oklahoma (29.9%) and California (28.6%) saw the next largest increases.
- 4.9% of U.S. bridge area is in poor condition. West Virginia (12.9%), New York (12.3%) and Rhode Island (12.0%) have the highest shares of poor bridge area, each at more than double the national average.
- Bridge conditions improved nationwide from 2020 to 2025, but some states saw significant deterioration. Nationally, bridge area in poor condition declined from 5.2% to 4.9%. However, Utah saw the largest increase, with the share of bridge area in poor condition rising by 200.0%. New York (28.1%) and Maine (26.0%) followed.
- Some states rank poorly for both road and bridge conditions, while others differ across infrastructure types. Rhode Island ranks first for poor roads (31.5%) and third for poor bridges (12.0%). Meanwhile, California ranks second for roads (27.0%) but 22nd for bridges (5.6%).
8.9% of miles of U.S. roadways are considered poor
Nearly 1 in every 11 miles of roadway in the U.S. is considered to be in poor condition. In total, 8.9% of road miles — 30,481 out of 343,341 evaluated miles — are in poor condition. (Road miles data is as of 2024 — the most recent available.)
Conditions vary widely by state, though. Rhode Island ranks worst, with 31.5% of its road miles in poor condition, followed by California at 27.0% and Massachusetts at 24.5%.
Comprehensive data linking road conditions to accident rates is limited, but poor roadway quality can create safety challenges for drivers. An even bigger factor, says LendingTree auto insurance expert and licensed insurance agent Rob Bhatt, is road design.
“Newer roads and highways tend to be safer because they’re built for today’s traffic volumes and vehicles,” he says. “Older roads may have unsafe approaches or turn lanes, or they may not have enough capacity for current traffic loads.”
Conversely, Alabama has the lowest share of road miles in poor condition at just 1.8%, with Nevada and Georgia close behind, each at 2.2%.
Full rankings: States with the worst road conditions (2024)
| Rank | State | Road miles (poor condition) | Total road miles evaluated | % of road miles in poor condition |
|---|---|---|---|---|
| 1 | Rhode Island | 203 | 644 | 31.5% |
| 2 | California | 4,962 | 18,409 | 27.0% |
| 3 | Massachusetts | 782 | 3,197 | 24.5% |
| 4 | Hawaii | 146 | 681 | 21.4% |
| 5 | New Jersey | 593 | 3,205 | 18.5% |
| 6 | New Mexico | 1,058 | 5,825 | 18.2% |
| 7 | Louisiana | 797 | 4,944 | 16.1% |
| 8 | New York | 1,705 | 10,763 | 15.8% |
| 9 | Alaska | 302 | 2,056 | 14.7% |
| 10 | Washington | 943 | 6,510 | 14.5% |
| 11 | Wisconsin | 1,514 | 11,141 | 13.6% |
| 12 | Colorado | 1,066 | 8,031 | 13.3% |
| 13 | Maryland | 364 | 2,909 | 12.5% |
| 14 | Pennsylvania | 1,330 | 12,189 | 10.9% |
| 15 | Connecticut | 181 | 1,674 | 10.8% |
| 16 | Mississippi | 791 | 7,435 | 10.6% |
| 17 | West Virginia | 343 | 3,485 | 9.8% |
| 18 | Arizona | 530 | 5,566 | 9.5% |
| 19 | Illinois | 1,170 | 12,396 | 9.4% |
| 20 | Oklahoma | 574 | 6,600 | 8.7% |
| 21 | Ohio | 779 | 9,112 | 8.5% |
| 22 | Iowa | 427 | 5,118 | 8.3% |
| 23 | Michigan | 827 | 10,682 | 7.7% |
| 24 | North Carolina | 686 | 9,429 | 7.3% |
| 24 | Texas | 2,151 | 29,401 | 7.3% |
| 26 | South Carolina | 433 | 6,409 | 6.8% |
| 27 | New Hampshire | 96 | 1,474 | 6.5% |
| 28 | Maine | 140 | 2,193 | 6.4% |
| 29 | Missouri | 595 | 9,760 | 6.1% |
| 30 | Virginia | 480 | 8,059 | 6.0% |
| 31 | Idaho | 236 | 3,985 | 5.9% |
| 32 | Arkansas | 292 | 5,253 | 5.6% |
| 33 | Oregon | 350 | 6,353 | 5.5% |
| 34 | Vermont | 41 | 788 | 5.2% |
| 35 | Delaware | 26 | 509 | 5.1% |
| 35 | Nebraska | 390 | 7,681 | 5.1% |
| 37 | Montana | 327 | 7,094 | 4.6% |
| 38 | Tennessee | 263 | 5,879 | 4.5% |
| 39 | Indiana | 232 | 6,214 | 3.7% |
| 40 | Minnesota | 420 | 11,764 | 3.6% |
| 40 | Utah | 145 | 4,081 | 3.6% |
| 42 | Florida | 326 | 10,277 | 3.2% |
| 42 | Kentucky | 177 | 5,521 | 3.2% |
| 44 | South Dakota | 183 | 6,561 | 2.8% |
| 44 | Wyoming | 118 | 4,190 | 2.8% |
| 46 | Kansas | 222 | 8,616 | 2.6% |
| 46 | North Dakota | 163 | 6,266 | 2.6% |
| 48 | Georgia | 256 | 11,421 | 2.2% |
| 48 | Nevada | 72 | 3,292 | 2.2% |
| 50 | Alabama | 149 | 8,171 | 1.8% |
Some states saw road conditions worsen significantly
Road conditions improved modestly across the U.S. between 2019 and 2024, with the nationwide share of road miles in poor condition declining from 9.2% to 8.9%.
Despite national improvements, several states moved in the opposite direction. Idaho experienced the most significant deterioration, with a 68.6% increase in the share of road miles in poor condition. Oklahoma (29.9%) and California (28.6%) saw the next largest increases.
At the same time, some states made substantial improvements. Minnesota led the way with a 60.9% reduction in the share of road miles in poor condition, followed by Indiana (51.9%) and South Dakota (48.1%).
While infrastructure trends can influence safety, their direct impact on insurance costs is less clear.
“Insurance rates usually come down to driving behavior — specifically crash frequency and severity,” Bhatt says. “Infrastructure plays a role, but factors like impaired driving, speeding, distracted driving and seat belt use tend to have a bigger impact on crash rates.”
Full rankings: States where road conditions worsened the most, 2019-24
| Rank | State | % of road miles in poor condition, 2019 | % of road miles in poor condition, 2024 | % change | % point change |
|---|---|---|---|---|---|
| 1 | Idaho | 3.5% | 5.9% | 68.6% | 2.4 |
| 2 | Oklahoma | 6.7% | 8.7% | 29.9% | 2.0 |
| 3 | California | 21.0% | 27.0% | 28.6% | 6.0 |
| 4 | New Mexico | 14.5% | 18.2% | 25.5% | 3.7 |
| 5 | Arizona | 7.6% | 9.5% | 25.0% | 1.9 |
| 5 | Virginia | 4.8% | 6.0% | 25.0% | 1.2 |
| 5 | Oregon | 4.4% | 5.5% | 25.0% | 1.1 |
| 8 | Louisiana | 13.6% | 16.1% | 18.4% | 2.5 |
| 9 | Florida | 2.8% | 3.2% | 14.3% | 0.4 |
| 10 | Mississippi | 9.3% | 10.6% | 14.0% | 1.3 |
| 11 | Colorado | 11.7% | 13.3% | 13.7% | 1.6 |
| 12 | Washington | 12.8% | 14.5% | 13.3% | 1.7 |
| 13 | South Carolina | 6.3% | 6.8% | 7.9% | 0.5 |
| 14 | Wyoming | 2.6% | 2.8% | 7.7% | 0.2 |
| 15 | Missouri | 5.7% | 6.1% | 7.0% | 0.4 |
| 16 | Maryland | 11.8% | 12.5% | 5.9% | 0.7 |
| 17 | West Virginia | 9.3% | 9.8% | 5.4% | 0.5 |
| 18 | Iowa | 7.9% | 8.3% | 5.1% | 0.4 |
| 19 | Nevada | 2.1% | 2.2% | 4.8% | 0.1 |
| 20 | Alaska | 14.4% | 14.7% | 2.1% | 0.3 |
| 21 | North Carolina | 7.3% | 7.3% | 0.0% | 0.0 |
| 21 | Vermont | 5.2% | 5.2% | 0.0% | 0.0 |
| 23 | Kansas | 2.7% | 2.6% | -3.7% | -0.1 |
| 24 | New York | 16.5% | 15.8% | -4.2% | -0.7 |
| 25 | Pennsylvania | 11.6% | 10.9% | -6.0% | -0.7 |
| 26 | Montana | 4.9% | 4.6% | -6.1% | -0.3 |
| 27 | Texas | 7.8% | 7.3% | -6.4% | -0.5 |
| 28 | North Dakota | 2.8% | 2.6% | -7.1% | -0.2 |
| 29 | Massachusetts | 26.6% | 24.5% | -7.9% | -2.1 |
| 30 | Georgia | 2.4% | 2.2% | -8.3% | -0.2 |
| 31 | New Hampshire | 7.2% | 6.5% | -9.7% | -0.7 |
| 32 | Tennessee | 5.0% | 4.5% | -10.0% | -0.5 |
| 33 | Illinois | 10.7% | 9.4% | -12.1% | -1.3 |
| 34 | Rhode Island | 37.1% | 31.5% | -15.1% | -5.6 |
| 35 | Wisconsin | 16.1% | 13.6% | -15.5% | -2.5 |
| 36 | Ohio | 10.1% | 8.5% | -15.8% | -1.6 |
| 37 | Arkansas | 6.7% | 5.6% | -16.4% | -1.1 |
| 38 | Kentucky | 3.9% | 3.2% | -17.9% | -0.7 |
| 39 | Hawaii | 26.1% | 21.4% | -18.0% | -4.7 |
| 40 | Delaware | 6.3% | 5.1% | -19.0% | -1.2 |
| 41 | Connecticut | 13.7% | 10.8% | -21.2% | -2.9 |
| 42 | Michigan | 10.2% | 7.7% | -24.5% | -2.5 |
| 43 | Alabama | 2.5% | 1.8% | -28.0% | -0.7 |
| 44 | New Jersey | 26.1% | 18.5% | -29.1% | -7.6 |
| 45 | Nebraska | 8.2% | 5.1% | -37.8% | -3.1 |
| 46 | Utah | 6.2% | 3.6% | -41.9% | -2.6 |
| 47 | Maine | 12.2% | 6.4% | -47.5% | -5.8 |
| 48 | South Dakota | 5.4% | 2.8% | -48.1% | -2.6 |
| 49 | Indiana | 7.7% | 3.7% | -51.9% | -4.0 |
| 50 | Minnesota | 9.2% | 3.6% | -60.9% | -5.6 |
Nationally, 4.9% of bridge area is in poor condition
Across the U.S., 4.9% of bridge area is in poor condition. (Note: While the latest road condition data is from 2024, the bridge area data is from 2025.)
Some states far exceed this national average: West Virginia ranks highest, with 12.9% of its bridge area in poor condition. New York (12.3%) and Rhode Island (12.0%) follow — each more than double the national share.
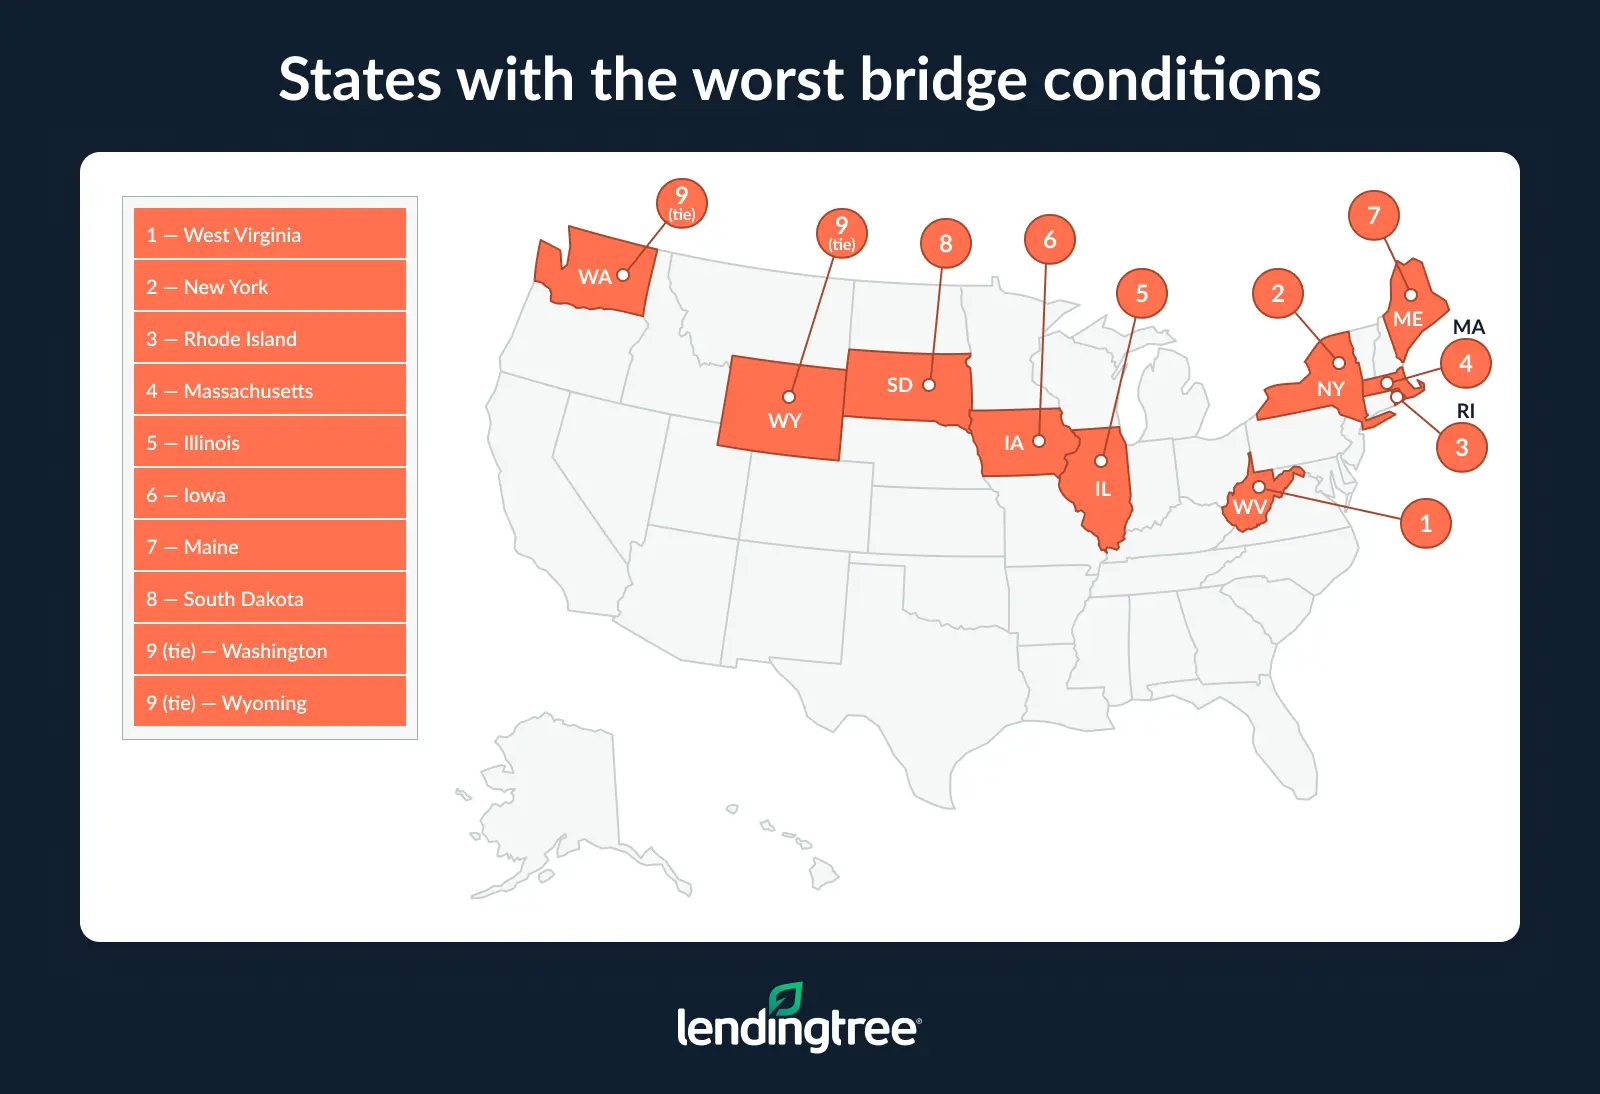
In contrast, only a few states report exceptionally low shares of poor bridge area. Nevada has the lowest share at just 0.9%, with Georgia and Arizona close behind at 1.0%.
Full rankings: States with the worst bridge conditions (2025)
| Rank | State | Bridge area (poor condition) | Total bridge area evaluated | % of bridge area in poor condition |
|---|---|---|---|---|
| 1 | West Virginia | 503,600 | 3,914,854 | 12.9% |
| 2 | New York | 1,647,703 | 13,424,125 | 12.3% |
| 3 | Rhode Island | 88,813 | 742,666 | 12.0% |
| 4 | Massachusetts | 475,429 | 4,171,606 | 11.4% |
| 5 | Illinois | 1,539,533 | 13,805,340 | 11.2% |
| 6 | Iowa | 901,485 | 9,186,833 | 9.8% |
| 7 | Maine | 125,355 | 1,292,408 | 9.7% |
| 8 | South Dakota | 158,041 | 1,871,057 | 8.4% |
| 9 | Washington | 600,182 | 7,205,094 | 8.3% |
| 9 | Wyoming | 111,454 | 1,343,706 | 8.3% |
| 11 | Missouri | 862,628 | 10,963,314 | 7.9% |
| 12 | Michigan | 467,775 | 6,450,282 | 7.3% |
| 13 | Alaska | 53,922 | 787,759 | 6.8% |
| 14 | Pennsylvania | 895,024 | 13,464,405 | 6.6% |
| 15 | Connecticut | 217,801 | 3,413,750 | 6.4% |
| 16 | Louisiana | 1,036,320 | 16,978,377 | 6.1% |
| 16 | Montana | 128,084 | 2,096,582 | 6.1% |
| 16 | Kentucky | 418,998 | 6,868,279 | 6.1% |
| 19 | New Jersey | 450,710 | 7,602,770 | 5.9% |
| 20 | Arkansas | 401,445 | 7,001,618 | 5.7% |
| 21 | California | 1,712,552 | 30,671,655 | 5.6% |
| 21 | South Carolina | 410,657 | 7,349,903 | 5.6% |
| 21 | North Carolina | 626,819 | 11,246,824 | 5.6% |
| 21 | New Hampshire | 65,186 | 1,170,171 | 5.6% |
| 25 | North Dakota | 65,622 | 1,342,991 | 4.9% |
| 26 | Nebraska | 214,935 | 4,493,733 | 4.8% |
| 27 | Tennessee | 505,202 | 10,636,602 | 4.7% |
| 28 | Vermont | 43,624 | 950,356 | 4.6% |
| 28 | Minnesota | 331,687 | 7,187,018 | 4.6% |
| 30 | Wisconsin | 315,543 | 7,278,524 | 4.3% |
| 31 | Idaho | 69,356 | 1,846,239 | 3.8% |
| 31 | Ohio | 535,061 | 14,230,555 | 3.8% |
| 31 | Indiana | 321,474 | 8,454,963 | 3.8% |
| 34 | Colorado | 196,213 | 5,261,562 | 3.7% |
| 35 | Oklahoma | 333,174 | 9,424,516 | 3.5% |
| 36 | New Mexico | 71,634 | 2,105,833 | 3.4% |
| 36 | Oregon | 174,460 | 5,141,940 | 3.4% |
| 36 | Maryland | 186,518 | 5,480,244 | 3.4% |
| 39 | Kansas | 296,671 | 9,085,441 | 3.3% |
| 40 | Mississippi | 317,422 | 9,980,945 | 3.2% |
| 40 | Delaware | 33,190 | 1,029,060 | 3.2% |
| 42 | Virginia | 316,984 | 10,536,540 | 3.0% |
| 43 | Hawaii | 37,901 | 1,451,134 | 2.6% |
| 44 | Utah | 49,469 | 2,073,239 | 2.4% |
| 45 | Alabama | 210,209 | 10,096,415 | 2.1% |
| 46 | Florida | 249,695 | 19,050,127 | 1.3% |
| 47 | Texas | 611,425 | 57,257,901 | 1.1% |
| 48 | Arizona | 60,207 | 6,230,419 | 1.0% |
| 48 | Georgia | 108,298 | 10,770,879 | 1.0% |
| 50 | Nevada | 17,539 | 1,988,741 | 0.9% |
Bridge conditions worsened by 200.0% in Utah
Bridge conditions across the U.S. improved slightly between 2020 and 2025, with bridge area in poor condition falling from 5.2% to 4.9% nationwide. (Because bridge area data is from 2025 rather than 2024, we’re using 2020 as the comparison point rather than 2019 to highlight the same change in years.)
Still, some states experienced significant deterioration. Utah saw the sharpest increase by far, with the share of bridge area in poor condition rising by 200.0%. New York (28.1%) and Maine (26.0%) also recorded notable increases.
Bhatt believes the high cost of infrastructure projects may be to blame.
“These projects are expensive, and while the federal government helps, it often requires matching funds from local agencies,” he says. “Many states and municipalities don’t have the budget for that, so some systems are allowed to deteriorate until there’s enough public pressure to invest.”
Meanwhile, other states made meaningful progress. Rhode Island reduced its share of poor bridge area by 41.5%, while Georgia and Arizona each improved by 33.3%.
Full rankings: States where bridge conditions worsened the most, 2020-25
| Rank | State | % of bridge area in poor condition, 2020 | % of bridge area in poor condition, 2025 | % change | % point change |
|---|---|---|---|---|---|
| 1 | Utah | 0.8% | 2.4% | 200.0% | 1.6 |
| 2 | New York | 9.6% | 12.3% | 28.1% | 2.7 |
| 3 | Maine | 7.7% | 9.7% | 26.0% | 2.0 |
| 4 | Washington | 6.6% | 8.3% | 25.8% | 1.7 |
| 5 | Kentucky | 4.9% | 6.1% | 24.5% | 1.2 |
| 6 | Alabama | 1.7% | 2.1% | 23.5% | 0.4 |
| 7 | Arkansas | 4.8% | 5.7% | 18.8% | 0.9 |
| 8 | Vermont | 3.9% | 4.6% | 17.9% | 0.7 |
| 9 | North Dakota | 4.2% | 4.9% | 16.7% | 0.7 |
| 10 | Ohio | 3.3% | 3.8% | 15.2% | 0.5 |
| 11 | Minnesota | 4.1% | 4.6% | 12.2% | 0.5 |
| 12 | Wisconsin | 3.9% | 4.3% | 10.3% | 0.4 |
| 13 | Kansas | 3.0% | 3.3% | 10.0% | 0.3 |
| 14 | Delaware | 3.0% | 3.2% | 6.7% | 0.2 |
| 15 | Wyoming | 7.8% | 8.3% | 6.4% | 0.5 |
| 16 | Maryland | 3.3% | 3.4% | 3.0% | 0.1 |
| 17 | Indiana | 3.7% | 3.8% | 2.7% | 0.1 |
| 18 | Tennessee | 4.6% | 4.7% | 2.2% | 0.1 |
| 19 | Iowa | 9.8% | 9.8% | 0.0% | 0.0 |
| 19 | Hawaii | 2.6% | 2.6% | 0.0% | 0.0 |
| 21 | Nebraska | 4.9% | 4.8% | -2.0% | -0.1 |
| 22 | Michigan | 7.5% | 7.3% | -2.7% | -0.2 |
| 23 | Oregon | 3.5% | 3.4% | -2.9% | -0.1 |
| 24 | Massachusetts | 11.9% | 11.4% | -4.2% | -0.5 |
| 25 | Alaska | 7.2% | 6.8% | -5.6% | -0.4 |
| 26 | South Carolina | 6.0% | 5.6% | -6.7% | -0.4 |
| 27 | Missouri | 8.5% | 7.9% | -7.1% | -0.6 |
| 27 | Florida | 1.4% | 1.3% | -7.1% | -0.1 |
| 29 | Illinois | 12.1% | 11.2% | -7.4% | -0.9 |
| 30 | Nevada | 1.0% | 0.9% | -10.0% | -0.1 |
| 31 | Virginia | 3.4% | 3.0% | -11.8% | -0.4 |
| 32 | South Dakota | 9.7% | 8.4% | -13.4% | -1.3 |
| 33 | California | 6.5% | 5.6% | -13.8% | -0.9 |
| 33 | North Carolina | 6.5% | 5.6% | -13.8% | -0.9 |
| 35 | West Virginia | 15.0% | 12.9% | -14.0% | -2.1 |
| 36 | Connecticut | 7.5% | 6.4% | -14.7% | -1.1 |
| 37 | Pennsylvania | 7.8% | 6.6% | -15.4% | -1.2 |
| 38 | Montana | 7.3% | 6.1% | -16.4% | -1.2 |
| 39 | New Jersey | 7.1% | 5.9% | -16.9% | -1.2 |
| 40 | New Hampshire | 6.8% | 5.6% | -17.6% | -1.2 |
| 41 | Mississippi | 3.9% | 3.2% | -17.9% | -0.7 |
| 42 | Texas | 1.4% | 1.1% | -21.4% | -0.3 |
| 43 | New Mexico | 4.4% | 3.4% | -22.7% | -1.0 |
| 44 | Idaho | 5.0% | 3.8% | -24.0% | -1.2 |
| 45 | Oklahoma | 4.8% | 3.5% | -27.1% | -1.3 |
| 46 | Louisiana | 8.4% | 6.1% | -27.4% | -2.3 |
| 47 | Colorado | 5.2% | 3.7% | -28.8% | -1.5 |
| 48 | Arizona | 1.5% | 1.0% | -33.3% | -0.5 |
| 48 | Georgia | 1.5% | 1.0% | -33.3% | -0.5 |
| 50 | Rhode Island | 20.5% | 12.0% | -41.5% | -8.5 |
Bridge and road conditions vary by state
Some states rank poorly for both roads and bridges, while others show a clear split between the two. Rhode Island, for example, ranks first for poor roads (31.5%) and third for poor bridge conditions (12.0%), suggesting broader infrastructure challenges across the board.
California, however, tells a different story. While it ranks second for poor road conditions (27.0%), it falls much lower — 22nd — for bridge conditions (5.6%). That’s largely because the Golden Gate Bridge, a major tourist attraction and highly traveled bridge, has received $400 million in federal funding through the U.S. Department of Transportation (DOT) Bridge Investment Program.
Using auto insurance to prepare for poor roads: Top expert tips
Poor road conditions are a major inconvenience, but they can also lead to costly vehicle damage and unexpected repairs. While drivers can’t control infrastructure quality, they can make smarter insurance decisions to protect themselves financially. The right coverage, paired with a proactive approach, can help minimize the impact of potholes, uneven pavement and other roadway hazards. We recommend the following:
- Consider collision and comprehensive coverage. Collision coverage can help pay for damage if you hit a pothole or uneven road surface, while comprehensive coverage may apply to certain non-collision incidents. Without these protections, drivers may have to cover repair costs — like bent rims or suspension damage — entirely out of pocket. If you live in a state with a high share of poor roads, carrying both coverages can provide valuable peace of mind.
- Choose a deductible you can afford. Lower deductibles mean higher monthly premiums, but they also reduce the amount you’ll pay out of pocket after a claim. For drivers regularly navigating rough roads, a lower deductible can make frequent, smaller claims — like pothole damage — more manageable. On the other hand, a higher deductible may make sense if you’re prepared to cover occasional repairs yourself.
- Document damage and road conditions carefully. If your vehicle is damaged by poor road conditions, documentation can make a big difference when filing a claim. Take photos of the damage, the road hazard (like a pothole) and the surrounding area as soon as it’s safe to do so. Keeping detailed records can help support your claim and may even be useful if you pursue reimbursement from a local municipality or agency responsible for road maintenance.
Methodology
LendingTree analyzed Federal Highway Administration (FHWA) Highway Statistics Series data for roads (2024 and 2019) and bridges (2025 and 2020) to evaluate infrastructure conditions across U.S. states.
For road conditions, analysts summed total miles across all rural and urban road classifications by state and categorized them as poor based on International Roughness Index (IRI) thresholds defined in federal regulations. Roads with IRI values above 170 were classified as poor. The share of road miles in poor condition was calculated by dividing miles in poor condition by total evaluated miles for each state and nationally.
For bridge conditions, analysts used total bridge area (in square meters) and calculated the share classified as poor by dividing bridge area in poor condition by total bridge area for each state.
The analysis excludes the District of Columbia due to limited sample size.
To measure change over time, LendingTree compared the share of road miles in poor condition between 2019 and 2024 and the share of bridge area in poor condition between 2020 and 2025. Percentage changes were calculated based on these shares.