Information Subsectors Lead US Wage Growth, With Broadcasting Wages Up Nearly 17%


Pay is climbing across the private sector, but nowhere faster than in the information sector. Data shows average weekly wages in this sector rose 9.4% between 2024 and 2025 — and half of the 10 subsectors with the biggest pay gains were in the information sector.
Here’s a closer look.
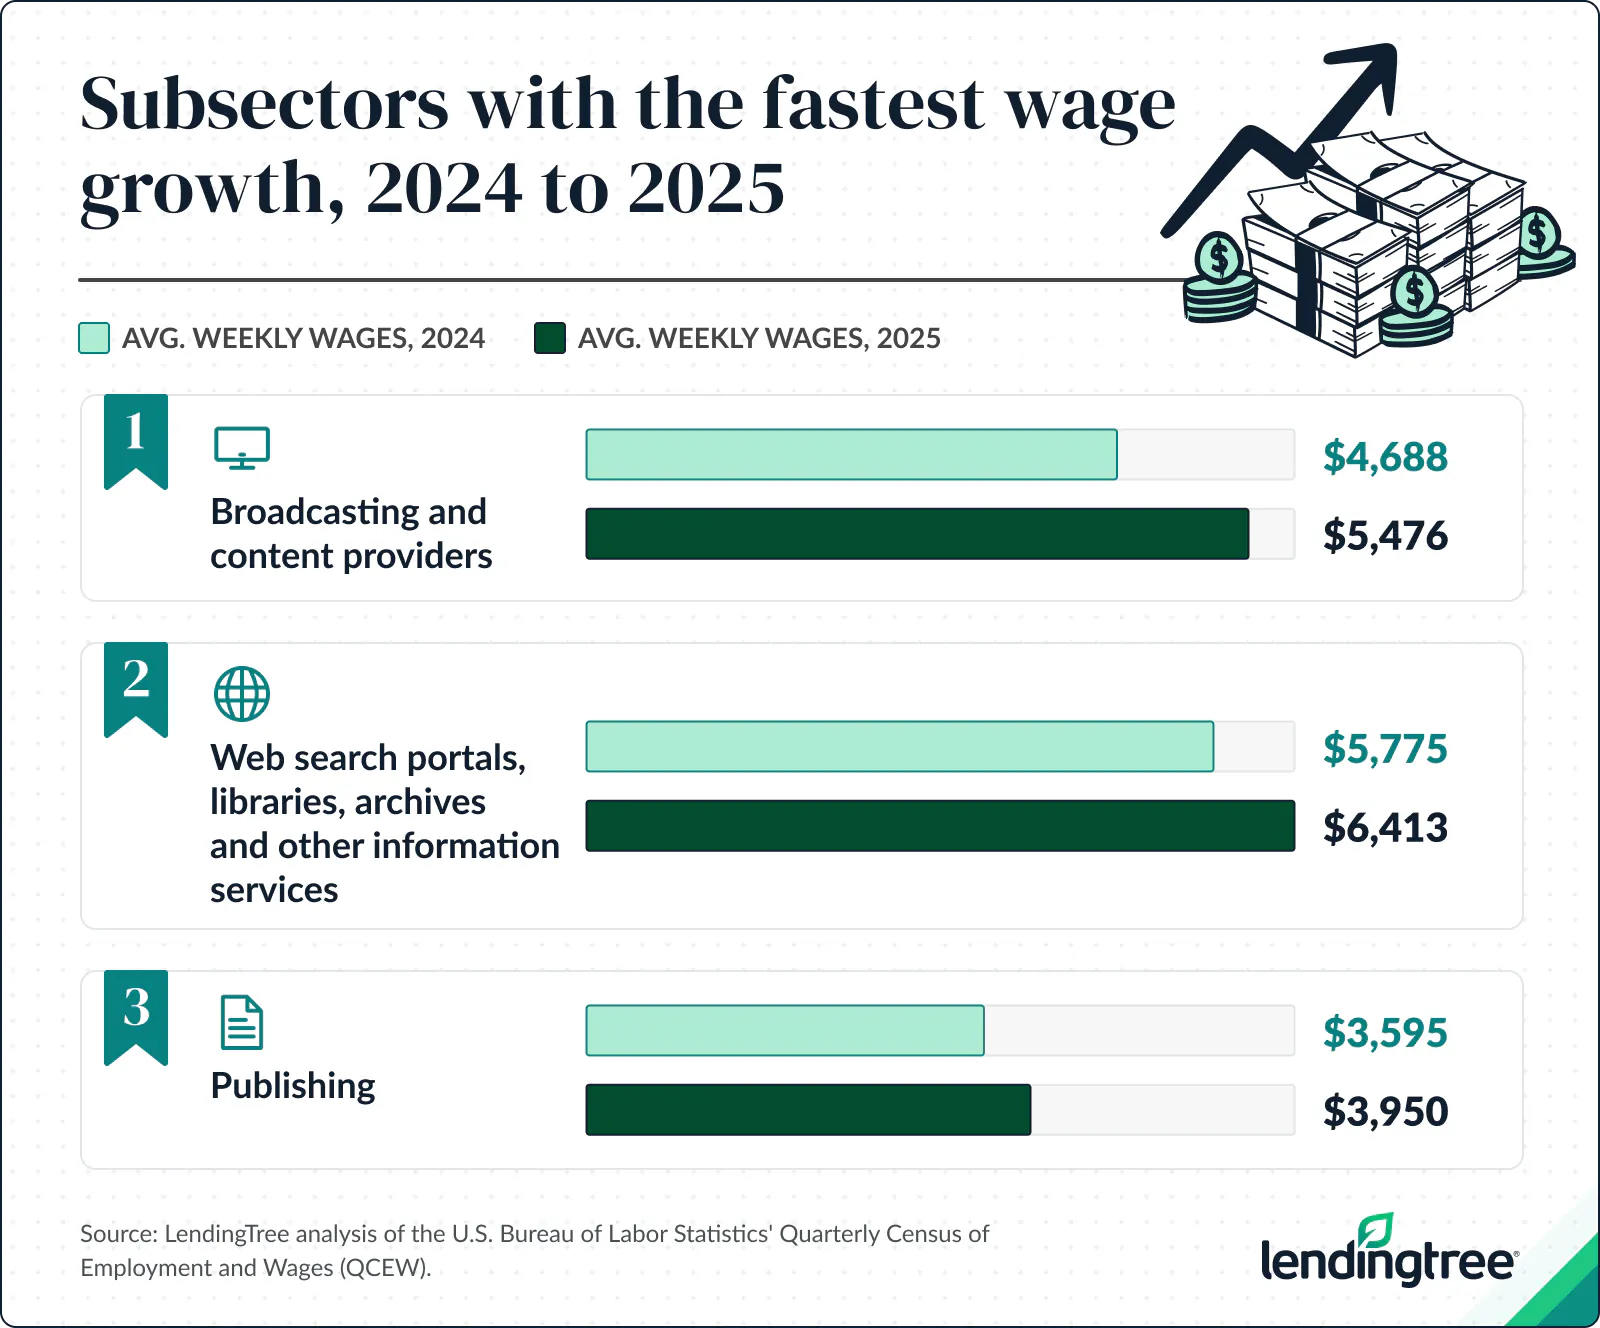
- The information sector dominated wage growth. Average weekly wages across private-sector industries increased 4.2% between 2024 and 2025, and five of the 10 subsectors with the fastest wage growth were in the information sector. Broadcasting and content providers led all subsectors, with average weekly wages increasing 16.8%, or $788.
- Healthcare drove private-industry employment growth. Annual average employment in the healthcare and social assistance sector increased 3.4% between 2024 and 2025 — far faster than the 0.4% increase across private-sector industries.
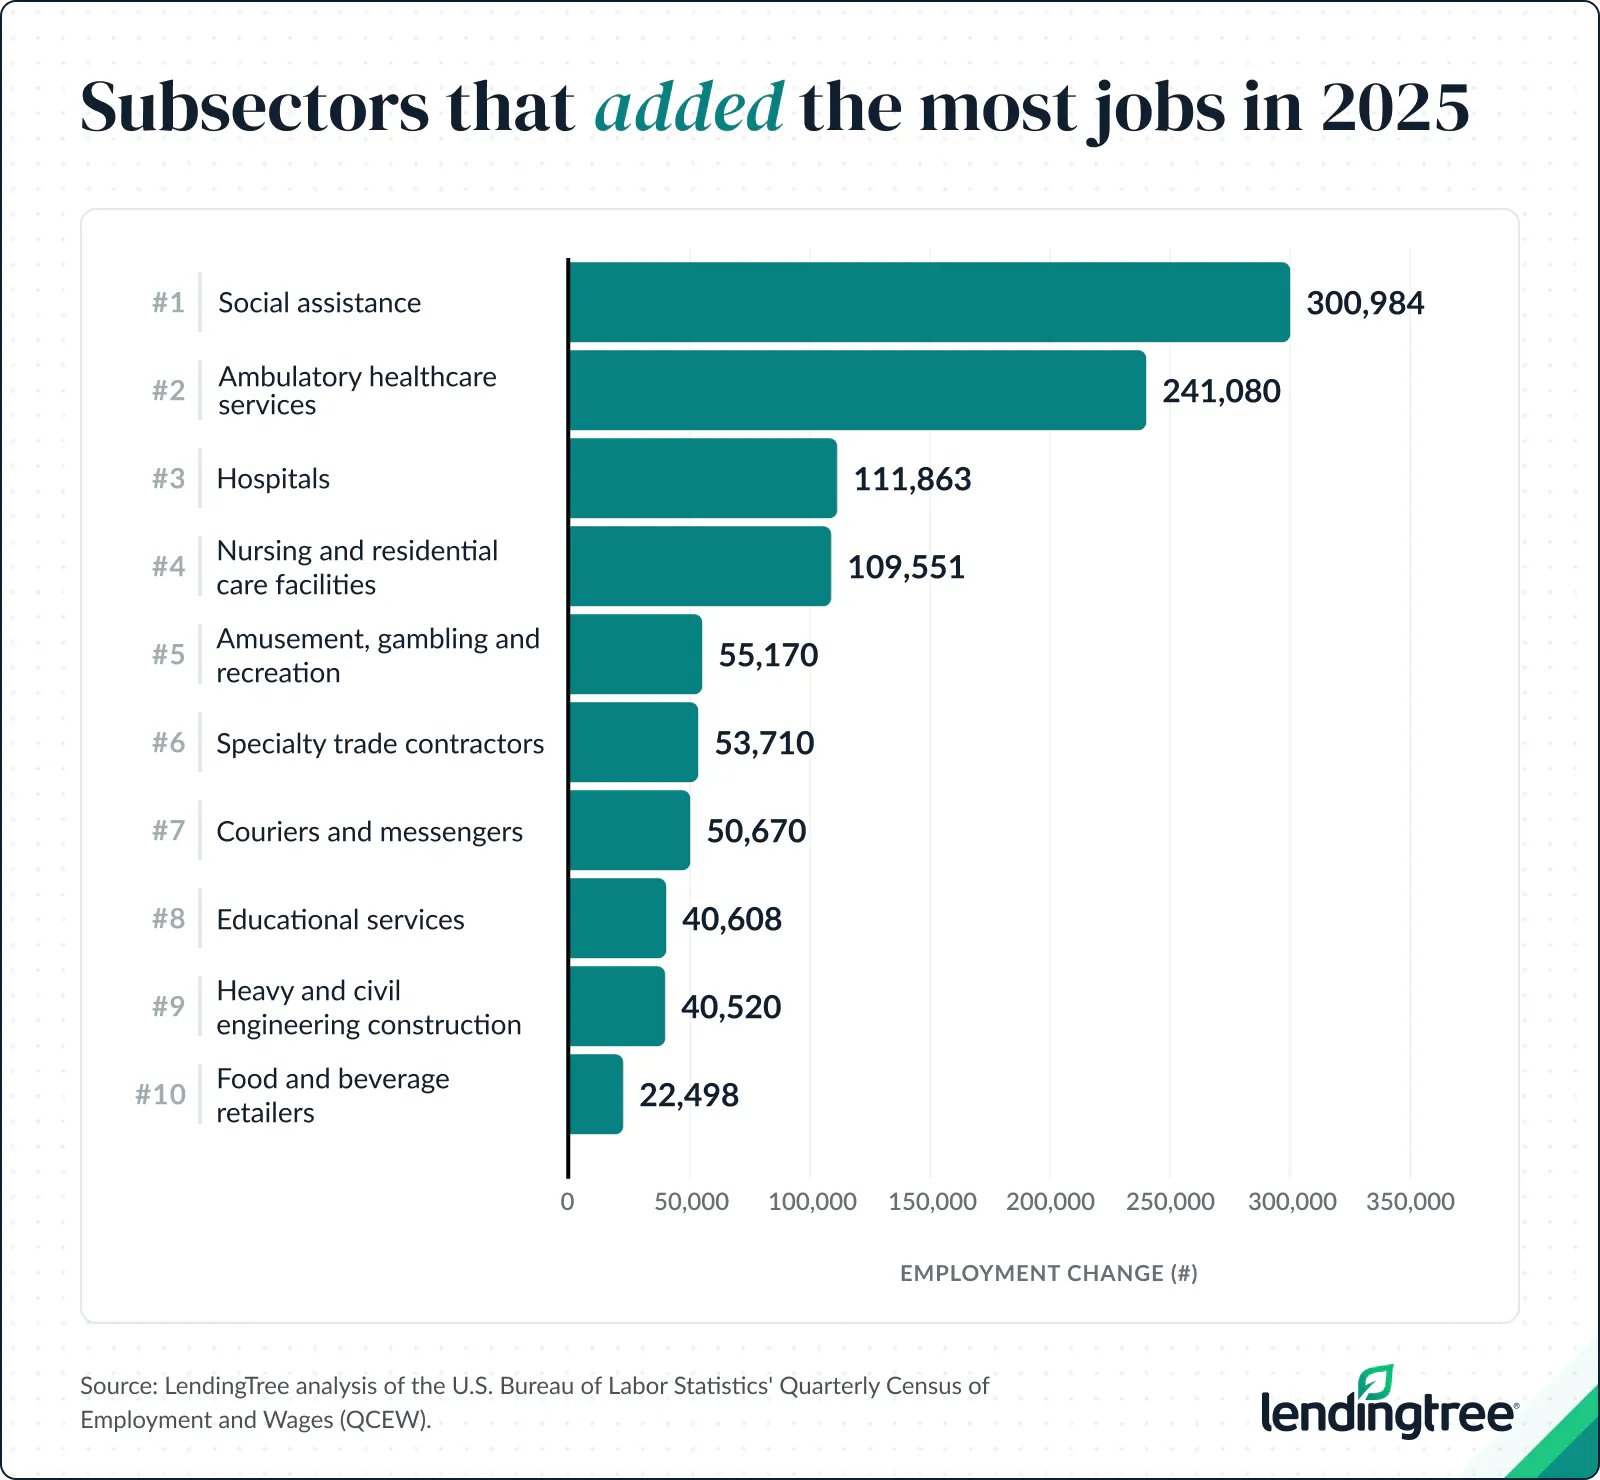
- By subsector, social assistance led employment growth. Annual average employment in social assistance increased by 300,984 workers, or 6.4%, between 2024 and 2025. The next largest employment gains also came from the healthcare and social assistance sector: ambulatory healthcare services (241,080), hospitals (111,863) and nursing and residential care facilities (109,551).
- Outside healthcare, employment gains were much smaller. The remaining subsectors in the top 10 accounted for just 25.6% of the roughly 1.03 million jobs added across the 10 fastest-growing subsectors. Among subsectors outside of the healthcare space, amusement, gambling and recreation added 55,170 jobs, followed by specialty trade contractors (53,710) and couriers and messengers (50,670).
Information sector posts steepest wage gain
Between 2024 and 2025, average weekly wages rose 4.2% (or $62) across private-sector industries. Of the subsectors, broadcasting and content providers had the single largest pay increase, climbing 16.8% — a jump of $788 weekly.
Matt Schulz, LendingTree chief consumer finance analyst and author of “Ask Questions, Save Money, Make More: How to Take Control of Your Financial Life,” says that strong wage growth reflects serious demand for talent in those fields. This level of demand creates a real problem for smaller businesses.
“Trying to win a salary bidding war against a large information company may be a losing proposition, simply because that big firm has so many more resources,” he says. “That means that small businesses may have to emphasize different things, such as flexibility or room for advancement, to get an edge. Of course, salary is a huge factor in determining where people want to work, but it isn’t the only one.”
Web search portals, libraries, archives and other information services was next, with an 11.0% increase, or $638. That was followed by publishing, where average weekly wages rose 9.9%, or $355. In total, five of the 10 subsectors with the fastest wage growth were in the information sector.
On the other hand, just one industry saw a decrease in weekly wages: the motion picture and sound recording industry. The industry posted a 2.0% (or $36) decrease in weekly wages from 2024 to 2025.
Full rankings: Subsectors with the fastest wage growth in 2025
| Rank | Subsector | Avg. weekly wage, 2024 | Avg. weekly wage, 2025 | Weekly wage change ($) | Weekly wage change (%) |
|---|---|---|---|---|---|
| 1 | Broadcasting and content providers | $4,688 | $5,476 | $788 | 16.8% |
| 2 | Web search portals, libraries, archives and other information services | $5,775 | $6,413 | $638 | 11.0% |
| 3 | Publishing industries | $3,595 | $3,950 | $355 | 9.9% |
| 4 | Securities, commodity contracts and other financial investments and related activities | $5,533 | $6,020 | $487 | 8.8% |
| 5 | Computer and electronic product manufacturing | $2,949 | $3,161 | $212 | 7.2% |
| 6 | Credit intermediation and related activities | $2,208 | $2,365 | $157 | 7.1% |
| 7 | Transportation equipment manufacturing | $1,793 | $1,906 | $113 | 6.3% |
| 8 | Telecommunications | $2,220 | $2,353 | $133 | 6.0% |
| 9 | Computing infrastructure providers, data processing, web hosting and related services | $3,746 | $3,959 | $213 | 5.7% |
| 10 | Professional, scientific and technical services | $2,463 | $2,602 | $139 | 5.6% |
| 11 | Miscellaneous manufacturing | $1,582 | $1,662 | $80 | 5.1% |
| 12 | Electrical equipment, appliance and component manufacturing | $1,649 | $1,730 | $81 | 4.9% |
| 13 | General merchandise retailers | $639 | $670 | $31 | 4.9% |
| 14 | Beverage and tobacco product manufacturing | $1,176 | $1,233 | $57 | 4.8% |
| 15 | Specialty trade contractors | $1,447 | $1,516 | $69 | 4.8% |
| 16 | Support activities for transportation | $1,408 | $1,475 | $67 | 4.8% |
| 17 | Construction of buildings | $1,699 | $1,779 | $80 | 4.7% |
| 18 | Utilities | $2,595 | $2,716 | $121 | 4.7% |
| 19 | Primary metal manufacturing | $1,716 | $1,796 | $80 | 4.7% |
| 20 | Furniture and related product manufacturing | $1,141 | $1,194 | $53 | 4.6% |
| 21 | Oil and gas extraction | $4,128 | $4,318 | $190 | 4.6% |
| 22 | Merchant wholesalers, durable goods | $1,992 | $2,082 | $90 | 4.5% |
| 23 | Animal production and aquaculture | $984 | $1,028 | $44 | 4.5% |
| 24 | Real estate | $1,503 | $1,570 | $67 | 4.5% |
| 25 | Chemical manufacturing | $2,273 | $2,372 | $99 | 4.4% |
| 26 | Accommodation | $833 | $869 | $36 | 4.3% |
| 27 | Support activities for agriculture and forestry | $864 | $901 | $37 | 4.3% |
| 28 | Nonmetallic mineral product manufacturing | $1,452 | $1,514 | $62 | 4.3% |
| 29 | Fabricated metal product manufacturing | $1,408 | $1,468 | $60 | 4.3% |
| 30 | Paper manufacturing | $1,571 | $1,637 | $66 | 4.2% |
| 31 | Wholesale trade agents and brokers | $2,481 | $2,581 | $100 | 4.0% |
| 32 | Religious, grantmaking, civic, professional and similar organizations | $1,196 | $1,244 | $48 | 4.0% |
| 33 | Private households | $819 | $851 | $32 | 3.9% |
| 34 | Performing arts, spectator sports and related industries | $2,208 | $2,294 | $86 | 3.9% |
| 35 | Amusement, gambling and recreation industries | $594 | $617 | $23 | 3.9% |
| 36 | Heavy and civil engineering construction | $1,834 | $1,905 | $71 | 3.9% |
| 37 | Museums, historical sites and similar institutions | $909 | $944 | $35 | 3.9% |
| 38 | Hospitals | $1,599 | $1,657 | $58 | 3.6% |
| 39 | Clothing, clothing accessories, shoe and jewelry retailers | $663 | $687 | $24 | 3.6% |
| 40 | Ambulatory healthcare services | $1,473 | $1,526 | $53 | 3.6% |
| 41 | Food and beverage retailers | $642 | $665 | $23 | 3.6% |
| 42 | Merchant wholesalers, nondurable goods | $1,788 | $1,852 | $64 | 3.6% |
| 43 | Administrative and support services | $1,091 | $1,130 | $39 | 3.6% |
| 44 | Motor vehicle and parts dealers | $1,315 | $1,362 | $47 | 3.6% |
| 45 | Insurance carriers and related activities | $2,115 | $2,190 | $75 | 3.5% |
| 46 | Printing and related support activities | $1,175 | $1,216 | $41 | 3.5% |
| 47 | Air transportation | $2,286 | $2,365 | $79 | 3.5% |
| 48 | Machinery manufacturing | $1,689 | $1,747 | $58 | 3.4% |
| 49 | Repair and maintenance | $1,169 | $1,207 | $38 | 3.3% |
| 50 | Crop production | $862 | $890 | $28 | 3.2% |
| 51 | Food manufacturing | $1,181 | $1,219 | $38 | 3.2% |
| 52 | Sporting goods, hobby, musical instrument, book and miscellaneous retailers | $720 | $742 | $22 | 3.1% |
| 53 | Wood product manufacturing | $1,200 | $1,236 | $36 | 3.0% |
| 54 | Educational services | $1,231 | $1,267 | $36 | 2.9% |
| 55 | Health and personal care retailers | $964 | $992 | $28 | 2.9% |
| 56 | Management of companies and enterprises | $3,101 | $3,190 | $89 | 2.9% |
| 57 | Mining (except oil and gas) | $1,903 | $1,957 | $54 | 2.8% |
| 58 | Food services and drinking places | $533 | $548 | $15 | 2.8% |
| 59 | Nursing and residential care facilities | $872 | $895 | $23 | 2.6% |
| 60 | Furniture, home furnishings, electronics and appliance retailers | $1,162 | $1,191 | $29 | 2.5% |
| 61 | Plastics and rubber products manufacturing | $1,333 | $1,365 | $32 | 2.4% |
| 62 | Truck transportation | $1,297 | $1,328 | $31 | 2.4% |
| 63 | Rental and leasing services | $1,361 | $1,393 | $32 | 2.4% |
| 64 | Personal and laundry services | $728 | $745 | $17 | 2.3% |
| 65 | Social assistance | $659 | $674 | $15 | 2.3% |
| 66 | Gasoline stations and fuel dealers | $661 | $676 | $15 | 2.3% |
| 67 | Building material and garden equipment and supplies dealers | $858 | $875 | $17 | 2.0% |
| 68 | Couriers and messengers | $1,076 | $1,096 | $20 | 1.9% |
| 69 | Waste management and remediation services | $1,519 | $1,547 | $28 | 1.8% |
| 70 | Support activities for mining | $2,192 | $2,231 | $39 | 1.8% |
| 71 | Petroleum and coal products manufacturing | $2,718 | $2,764 | $46 | 1.7% |
| 72 | Warehousing and storage | $1,075 | $1,090 | $15 | 1.4% |
| 73 | Transit and ground passenger transportation | $995 | $998 | $3 | 0.3% |
| 74 | Motion picture and sound recording industries | $1,764 | $1,728 | -$36 | -2.0% |
Healthcare and social assistance outpaces other private-sector hiring
While the information sector is winning on pay, healthcare and social assistance is where the jobs are. Employment in this sector grew 3.4% between 2024 and 2025 — nearly nine times the 0.4% increase across private-sector industries.
Schulz believes that’s further proof that not every corner of the economy is booming.
“No one should be surprised that healthcare and social assistance is growing rapidly, especially as the nation’s population ages,” he says. “We also shouldn’t be surprised that the industry is appealing to lots of workers. While demand for other goods and services can have its peaks and valleys, demand for healthcare is persistent, which means that there will likely always be a need for workers in that field. That kind of predictability and security is a big deal. It also means that small businesses in other sectors may have to compete with the lure of the healthcare space to attract and keep employees.”
Following that, the arts, entertainment and recreation sector grew 2.4%, and utilities grew 2.2%. Meanwhile, nine of the 20 sectors analyzed saw a decrease in employment between 2024 and 2025. Mining, quarrying and oil and gas extraction saw the largest decline (2.6%), followed by information (1.9%) and agriculture, forestry, fishing and hunting (1.9%).
Sectors that added or lost the most jobs in 2025 by sector
| Rank | Sector | Annual avg. employment, 2024 | Annual avg. employment, 2025 | Employment change (#) | Employment change (%) |
|---|---|---|---|---|---|
| 1 | Healthcare and social assistance | 22,217,638 | 22,981,116 | 763,478 | 3.4% |
| 2 | Arts, entertainment and recreation | 2,605,233 | 2,667,272 | 62,039 | 2.4% |
| 3 | Utilities | 589,311 | 602,003 | 12,692 | 2.2% |
| 4 | Construction | 8,135,442 | 8,245,605 | 110,163 | 1.4% |
| 5 | Educational services | 3,204,582 | 3,245,190 | 40,608 | 1.3% |
| 6 | Transportation and warehousing | 6,562,468 | 6,618,717 | 56,249 | 0.9% |
| 8 | Finance and insurance | 6,290,311 | 6,314,825 | 24,514 | 0.4% |
| 9 | Accommodation and food services | 14,092,895 | 14,112,189 | 19,294 | 0.1% |
| 10 | Real estate and rental and leasing | 2,406,045 | 2,409,313 | 3,268 | 0.1% |
| 11 | Other services (except public administration) | 4,666,503 | 4,672,278 | 5,775 | 0.1% |
| 12 | Management of companies and enterprises | 2,613,063 | 2,604,036 | -9,027 | -0.3% |
| 13 | Professional, scientific and technical services | 10,781,508 | 10,742,541 | -38,967 | -0.4% |
| 14 | Retail trade | 15,479,194 | 15,387,732 | -91,462 | -0.6% |
| 15 | Administrative and support and waste management and remediation services | 9,123,838 | 9,021,805 | -102,033 | -1.1% |
| 16 | Wholesale trade | 6,106,692 | 6,037,191 | -69,501 | -1.1% |
| 17 | Manufacturing | 12,733,350 | 12,577,655 | -155,695 | -1.2% |
| 18 | Agriculture, forestry, fishing and hunting | 1,254,363 | 1,230,725 | -23,638 | -1.9% |
| 19 | Information | 2,904,986 | 2,848,554 | -56,432 | -1.9% |
| 20 | Mining, quarrying and oil and gas extraction | 586,238 | 570,824 | -15,414 | -2.6% |
Social assistance is the single fastest-growing subsector
Within healthcare and social assistance, social assistance itself is the standout: Employment there grew by 300,984 workers between 2024 and 2025 — a 6.4% increase. That marks the fastest employment growth of any qualifying subsector, and it’s more than any other subsector added in raw job numbers.
Schulz says there are a few reasons why this may be the case. “Our population is aging, with most boomers now well past retirement age,” he says. “That creates a massive strain on our healthcare system, but it creates real opportunity for small businesses. The healthcare space needs help with staffing, payroll, cybersecurity, cleaning and countless other services that small businesses may be better fit to provide than bigger companies. It’s up to companies to offer solutions for these needs and grow from there.”
Subsectors that added or lost the most jobs in 2025 by number
| Rank | Subsector | Annual avg. employment, 2024 | Annual avg. employment, 2025 | Employment change (%) | Employment change (#) |
|---|---|---|---|---|---|
| 1 | Social assistance | 4,679,485 | 4,980,469 | 6.4% | 300,984 |
| 2 | Ambulatory healthcare services | 8,770,814 | 9,011,894 | 2.7% | 241,080 |
| 3 | Hospitals | 5,454,513 | 5,566,376 | 2.1% | 111,863 |
| 4 | Nursing and residential care facilities | 3,312,826 | 3,422,377 | 3.3% | 109,551 |
| 5 | Amusement, gambling and recreation industries | 1,853,713 | 1,908,883 | 3.0% | 55,170 |
| 6 | Specialty trade contractors | 5,151,234 | 5,204,944 | 1.0% | 53,710 |
| 7 | Couriers and messengers | 1,072,397 | 1,123,067 | 4.7% | 50,670 |
| 8 | Educational services | 3,204,582 | 3,245,190 | 1.3% | 40,608 |
| 9 | Heavy and civil engineering construction | 1,143,755 | 1,184,275 | 3.5% | 40,520 |
| 10 | Food and beverage retailers | 3,221,250 | 3,243,748 | 0.7% | 22,498 |
| 11 | Securities, commodity contracts and other financial investments and related activities | 1,082,446 | 1,103,352 | 1.9% | 20,906 |
| 12 | Transit and ground passenger transportation | 543,550 | 564,240 | 3.8% | 20,690 |
| 13 | Personal and laundry services | 1,563,145 | 1,579,922 | 1.1% | 16,777 |
| 14 | Construction of buildings | 1,840,453 | 1,856,387 | 0.9% | 15,934 |
| 15 | Food services and drinking places | 12,179,963 | 12,194,453 | 0.1% | 14,490 |
| 16 | Utilities | 589,311 | 602,003 | 2.2% | 12,692 |
| 17 | Electrical equipment, appliance and component manufacturing | 420,092 | 432,508 | 3.0% | 12,416 |
| 18 | Waste management and remediation services | 507,902 | 517,669 | 1.9% | 9,767 |
| 19 | Warehousing and storage | 1,892,154 | 1,900,438 | 0.4% | 8,284 |
| 20 | Food manufacturing | 1,766,665 | 1,774,492 | 0.4% | 7,827 |
| 21 | Air transportation | 565,156 | 571,881 | 1.2% | 6,725 |
| 22 | Real estate | 1,811,086 | 1,816,500 | 0.3% | 5,414 |
| 23 | Performing arts, spectator sports and related industries | 573,228 | 578,290 | 0.9% | 5,062 |
| 24 | Accommodation | 1,912,932 | 1,917,735 | 0.3% | 4,803 |
| 25 | Animal production and aquaculture | 267,147 | 269,870 | 1.0% | 2,723 |
| 26 | Museums, historical sites and similar institutions | 178,292 | 180,099 | 1.0% | 1,807 |
| 27 | Motor vehicle and parts dealers | 2,042,338 | 2,043,888 | 0.1% | 1,550 |
| 28 | Insurance carriers and related activities | 2,593,435 | 2,594,974 | 0.1% | 1,539 |
| 29 | Gasoline stations and fuel dealers | 1,046,273 | 1,047,224 | 0.1% | 951 |
| 30 | Support activities for transportation | 817,773 | 818,047 | 0.0% | 274 |
| 31 | Computing infrastructure providers, data processing, web hosting and related services | 483,804 | 483,992 | 0.0% | 188 |
| 32 | Credit intermediation and related activities | 2,562,299 | 2,562,223 | 0.0% | -76 |
| 33 | Repair and maintenance | 1,459,248 | 1,458,919 | 0.0% | -329 |
| 34 | Clothing, clothing accessories, shoe and jewelry retailers | 1,143,367 | 1,142,524 | -0.1% | -843 |
| 35 | Petroleum and coal products manufacturing | 110,253 | 109,312 | -0.9% | -941 |
| 36 | Chemical manufacturing | 893,669 | 892,405 | -0.1% | -1,264 |
| 37 | Rental and leasing services | 572,734 | 570,944 | -0.3% | -1,790 |
| 38 | Nonmetallic mineral product manufacturing | 416,207 | 413,674 | -0.6% | -2,533 |
| 39 | Miscellaneous manufacturing | 613,220 | 610,665 | -0.4% | -2,555 |
| 40 | Mining (except oil and gas) | 190,629 | 187,897 | -1.4% | -2,732 |
| 41 | Paper manufacturing | 354,234 | 351,184 | -0.9% | -3,050 |
| 42 | Private households | 208,560 | 205,019 | -1.7% | -3,541 |
| 43 | Oil and gas extraction | 121,340 | 116,785 | -3.8% | -4,555 |
| 44 | Web search portals, libraries, archives and other information services | 181,282 | 176,495 | -2.6% | -4,787 |
| 45 | Broadcasting and content providers | 343,165 | 338,015 | -1.5% | -5,150 |
| 46 | Publishing industries | 900,847 | 895,212 | -0.6% | -5,635 |
| 47 | Beverage and tobacco product manufacturing | 334,155 | 328,170 | -1.8% | -5,985 |
| 48 | Primary metal manufacturing | 368,726 | 362,458 | -1.7% | -6,268 |
| 49 | Religious, grantmaking, civic, professional and similar organizations | 1,435,550 | 1,428,419 | -0.5% | -7,131 |
| 50 | Support activities for mining | 274,270 | 266,142 | -3.0% | -8,128 |
| 51 | Management of companies and enterprises | 2,613,063 | 2,604,036 | -0.3% | -9,027 |
| 52 | Wood product manufacturing | 412,134 | 401,651 | -2.5% | -10,483 |
| 53 | Furniture and related product manufacturing | 343,843 | 333,348 | -3.1% | -10,495 |
| 54 | Merchant wholesalers, durable goods | 3,411,168 | 3,400,276 | -0.3% | -10,892 |
| 55 | Support activities for agriculture and forestry | 390,252 | 379,091 | -2.9% | -11,161 |
| 56 | Printing and related support activities | 355,998 | 344,352 | -3.3% | -11,646 |
| 57 | Merchant wholesalers, nondurable goods | 2,203,794 | 2,192,146 | -0.5% | -11,648 |
| 58 | Fabricated metal product manufacturing | 1,437,729 | 1,425,535 | -0.8% | -12,194 |
| 59 | Crop production | 542,058 | 528,538 | -2.5% | -13,520 |
| 60 | Building material and garden equipment and supplies dealers | 1,384,951 | 1,370,025 | -1.1% | -14,926 |
| 61 | Motion picture and sound recording industries | 377,210 | 361,162 | -4.3% | -16,048 |
| 62 | Machinery manufacturing | 1,106,882 | 1,087,336 | -1.8% | -19,546 |
| 63 | Plastics and rubber products manufacturing | 719,721 | 700,170 | -2.7% | -19,551 |
| 64 | Health and personal care retailers | 1,080,139 | 1,058,603 | -2.0% | -21,536 |
| 65 | Sporting goods, hobby, musical instrument, book and miscellaneous retailers | 1,502,096 | 1,480,534 | -1.4% | -21,562 |
| 66 | Computer and electronic product manufacturing | 1,019,785 | 997,907 | -2.1% | -21,878 |
| 67 | Telecommunications | 618,678 | 593,678 | -4.0% | -25,000 |
| 68 | General merchandise retailers | 3,260,345 | 3,231,603 | -0.9% | -28,742 |
| 69 | Furniture, home furnishings, electronics and appliance retailers | 798,436 | 769,582 | -3.6% | -28,854 |
| 70 | Truck transportation | 1,510,110 | 1,478,123 | -2.1% | -31,987 |
| 71 | Transportation equipment manufacturing | 1,770,605 | 1,735,918 | -2.0% | -34,687 |
| 72 | Professional, scientific and technical services | 10,781,508 | 10,742,541 | -0.4% | -38,967 |
| 73 | Wholesale trade agents and brokers | 491,730 | 444,769 | -9.6% | -46,961 |
| 74 | Administrative and support services | 8,615,936 | 8,504,136 | -1.3% | -111,800 |
The next three subsectors with the largest employment gains also came from the healthcare and social assistance sector: ambulatory healthcare services (241,080), hospitals (111,863), and nursing and residential care facilities (109,551).
Not only did social assistance add more jobs than any other qualifying subsector, but it also recorded the fastest employment growth (6.4%) between 2024 and 2025. Couriers and messengers (4.7%) and transit and ground passenger transportation (3.8%) rounded out the top three here.
Meanwhile, 41 of the 74 subsectors analyzed saw percentage decreases in employment during this time, led by wholesale trade agents and brokers (9.6%), motion picture and sound recording industries (4.3%) and telecommunications (4.0%)
Full rankings: Subsectors that added or lost the most jobs in 2025 by percentage change
| Rank | Subsector | Annual avg. employment, 2024 | Annual avg. employment, 2025 | Employment change (#) | Employment change (%) |
|---|---|---|---|---|---|
| 1 | Social assistance | 4,679,485 | 4,980,469 | 300,984 | 6.4% |
| 2 | Couriers and messengers | 1,072,397 | 1,123,067 | 50,670 | 4.7% |
| 3 | Transit and ground passenger transportation | 543,550 | 564,240 | 20,690 | 3.8% |
| 4 | Heavy and civil engineering construction | 1,143,755 | 1,184,275 | 40,520 | 3.5% |
| 5 | Nursing and residential care facilities | 3,312,826 | 3,422,377 | 109,551 | 3.3% |
| 6 | Amusement, gambling and recreation industries | 1,853,713 | 1,908,883 | 55,170 | 3.0% |
| 7 | Electrical equipment, appliance and component manufacturing | 420,092 | 432,508 | 12,416 | 3.0% |
| 8 | Ambulatory healthcare services | 8,770,814 | 9,011,894 | 241,080 | 2.7% |
| 9 | Utilities | 589,311 | 602,003 | 12,692 | 2.2% |
| 10 | Hospitals | 5,454,513 | 5,566,376 | 111,863 | 2.1% |
| 11 | Securities, commodity contracts and other financial investments and related activities | 1,082,446 | 1,103,352 | 20,906 | 1.9% |
| 12 | Waste management and remediation services | 507,902 | 517,669 | 9,767 | 1.9% |
| 13 | Educational services | 3,204,582 | 3,245,190 | 40,608 | 1.3% |
| 14 | Air transportation | 565,156 | 571,881 | 6,725 | 1.2% |
| 15 | Personal and laundry services | 1,563,145 | 1,579,922 | 16,777 | 1.1% |
| 16 | Specialty trade contractors | 5,151,234 | 5,204,944 | 53,710 | 1.0% |
| 17 | Animal production and aquaculture | 267,147 | 269,870 | 2,723 | 1.0% |
| 18 | Museums, historical sites and similar institutions | 178,292 | 180,099 | 1,807 | 1.0% |
| 19 | Performing arts, spectator sports and related industries | 573,228 | 578,290 | 5,062 | 0.9% |
| 20 | Construction of buildings | 1,840,453 | 1,856,387 | 15,934 | 0.9% |
| 21 | Food and beverage retailers | 3,221,250 | 3,243,748 | 22,498 | 0.7% |
| 22 | Food manufacturing | 1,766,665 | 1,774,492 | 7,827 | 0.4% |
| 23 | Warehousing and storage | 1,892,154 | 1,900,438 | 8,284 | 0.4% |
| 24 | Real estate | 1,811,086 | 1,816,500 | 5,414 | 0.3% |
| 25 | Accommodation | 1,912,932 | 1,917,735 | 4,803 | 0.3% |
| 26 | Food services and drinking places | 12,179,963 | 12,194,453 | 14,490 | 0.1% |
| 27 | Gasoline stations and fuel dealers | 1,046,273 | 1,047,224 | 951 | 0.1% |
| 28 | Motor vehicle and parts dealers | 2,042,338 | 2,043,888 | 1,550 | 0.1% |
| 29 | Insurance carriers and related activities | 2,593,435 | 2,594,974 | 1,539 | 0.1% |
| 30 | Computing infrastructure providers, data processing, web hosting and related services | 483,804 | 483,992 | 188 | 0.0% |
| 31 | Support activities for transportation | 817,773 | 818,047 | 274 | 0.0% |
| 32 | Credit intermediation and related activities | 2,562,299 | 2,562,223 | -76 | 0.0% |
| 33 | Repair and maintenance | 1,459,248 | 1,458,919 | -329 | 0.0% |
| 34 | Clothing, clothing accessories, shoe and jewelry retailers | 1,143,367 | 1,142,524 | -843 | -0.1% |
| 35 | Chemical manufacturing | 893,669 | 892,405 | -1,264 | -0.1% |
| 36 | Rental and leasing services | 572,734 | 570,944 | -1,790 | -0.3% |
| 37 | Merchant wholesalers, durable goods | 3,411,168 | 3,400,276 | -10,892 | -0.3% |
| 38 | Management of companies and enterprises | 2,613,063 | 2,604,036 | -9,027 | -0.3% |
| 39 | Professional, scientific and technical services | 10,781,508 | 10,742,541 | -38,967 | -0.4% |
| 40 | Miscellaneous manufacturing | 613,220 | 610,665 | -2,555 | -0.4% |
| 41 | Religious, grantmaking, civic, professional and similar organizations | 1,435,550 | 1,428,419 | -7,131 | -0.5% |
| 42 | Merchant wholesalers, nondurable goods | 2,203,794 | 2,192,146 | -11,648 | -0.5% |
| 43 | Nonmetallic mineral product manufacturing | 416,207 | 413,674 | -2,533 | -0.6% |
| 44 | Publishing industries | 900,847 | 895,212 | -5,635 | -0.6% |
| 45 | Fabricated metal product manufacturing | 1,437,729 | 1,425,535 | -12,194 | -0.8% |
| 46 | Petroleum and coal products manufacturing | 110,253 | 109,312 | -941 | -0.9% |
| 47 | Paper manufacturing | 354,234 | 351,184 | -3,050 | -0.9% |
| 48 | General merchandise retailers | 3,260,345 | 3,231,603 | -28,742 | -0.9% |
| 49 | Building material and garden equipment and supplies dealers | 1,384,951 | 1,370,025 | -14,926 | -1.1% |
| 50 | Administrative and support services | 8,615,936 | 8,504,136 | -111,800 | -1.3% |
| 51 | Mining (except oil and gas) | 190,629 | 187,897 | -2,732 | -1.4% |
| 52 | Sporting goods, hobby, musical instrument, book and miscellaneous retailers | 1,502,096 | 1,480,534 | -21,562 | -1.4% |
| 53 | Broadcasting and content providers | 343,165 | 338,015 | -5,150 | -1.5% |
| 54 | Private households | 208,560 | 205,019 | -3,541 | -1.7% |
| 55 | Primary metal manufacturing | 368,726 | 362,458 | -6,268 | -1.7% |
| 56 | Machinery manufacturing | 1,106,882 | 1,087,336 | -19,546 | -1.8% |
| 57 | Beverage and tobacco product manufacturing | 334,155 | 328,170 | -5,985 | -1.8% |
| 58 | Transportation equipment manufacturing | 1,770,605 | 1,735,918 | -34,687 | -2.0% |
| 59 | Health and personal care retailers | 1,080,139 | 1,058,603 | -21,536 | -2.0% |
| 60 | Truck transportation | 1,510,110 | 1,478,123 | -31,987 | -2.1% |
| 61 | Computer and electronic product manufacturing | 1,019,785 | 997,907 | -21,878 | -2.1% |
| 62 | Crop production | 542,058 | 528,538 | -13,520 | -2.5% |
| 63 | Wood product manufacturing | 412,134 | 401,651 | -10,483 | -2.5% |
| 64 | Web search portals, libraries, archives and other information services | 181,282 | 176,495 | -4,787 | -2.6% |
| 65 | Plastics and rubber products manufacturing | 719,721 | 700,170 | -19,551 | -2.7% |
| 66 | Support activities for agriculture and forestry | 390,252 | 379,091 | -11,161 | -2.9% |
| 67 | Support activities for mining | 274,270 | 266,142 | -8,128 | -3.0% |
| 68 | Furniture and related product manufacturing | 343,843 | 333,348 | -10,495 | -3.1% |
| 69 | Printing and related support activities | 355,998 | 344,352 | -11,646 | -3.3% |
| 70 | Furniture, home furnishings, electronics and appliance retailers | 798,436 | 769,582 | -28,854 | -3.6% |
| 71 | Oil and gas extraction | 121,340 | 116,785 | -4,555 | -3.8% |
| 72 | Telecommunications | 618,678 | 593,678 | -25,000 | -4.0% |
| 73 | Motion picture and sound recording industries | 377,210 | 361,162 | -16,048 | -4.3% |
| 74 | Wholesale trade agents and brokers | 491,730 | 444,769 | -46,961 | -9.6% |
Job growth outside healthcare is comparatively modest
Strip healthcare out of the picture, and hiring in the remaining top subsectors looks a lot lower. Nonhealthcare subsectors in the top 10 accounted for just 25.6% of the roughly 1.03 million jobs added across the 10 fastest-growing subsectors (by number).
The largest of these outside healthcare were amusement, gambling and recreation (55,170), specialty trade contractors (53,710), and couriers and messengers (50,670).
Notably, only six qualifying subsectors outperformed the private-industry average in both employment and wage growth. They included: electrical equipment, appliance and component manufacturing; utilities; securities, commodity contracts and other financial investments; specialty trade contractors; animal production and aquaculture; and construction of buildings.
Competing for talent without breaking the budget: Top expert tips
Small businesses may not always be able to outbid larger employers on pay, but compensation is only one part of what keeps good employees around. For small businesses in the most competitive industries, we offer the following advice:
- Compete on more than pay. “Don’t assume that competing for workers always means writing the biggest paycheck,” Schulz says. “Ask your best employees what keeps them around. Flexible schedules, opportunities to advance and feeling heard can make a meaningful difference.”
- Invest in the employees you have. “Turnover is expensive and disruptive, so retaining strong employees can pay off,” he says. “A well-timed raise or bonus may cost less than replacing a valued team member and training someone new.”
- Look for other ways to strengthen your business. Regularly reviewing staffing, benefits and operating expenses can help you find a balance between staying competitive and protecting your margins.
Methodology
LendingTree analyzed annual average employment and average weekly wage data from the U.S. Bureau of Labor Statistics’ Quarterly Census of Employment and Wages (QCEW) for U.S. private-sector industries, retrieved on Aug. 4, 2026.
Employment and wage growth were calculated by comparing 2024 and 2025 annual averages for private-sector three-digit and two-digit NAICS industries. The analysis was limited to sectors with at least 100,000 annual average employees in 2025.
Industries were ranked based on three criteria:
- Percentage growth in annual average employment
- The number of jobs added
- Percentage growth in average weekly wages
Get debt consolidation loan offers from up to 5 lenders in minutes